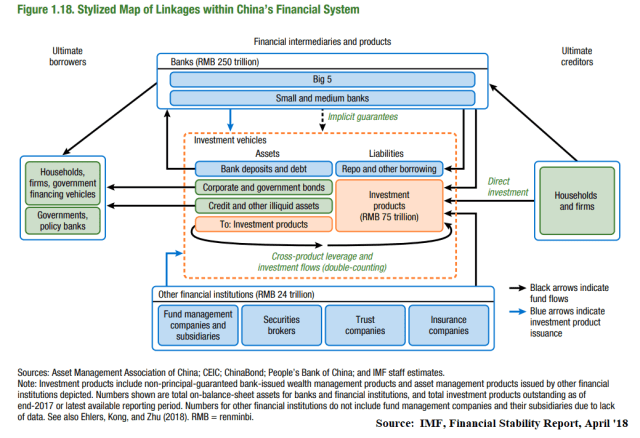
Awesome chart on the opaque China’s Financial System from the IMF’s latest Global Financial Stability Report. China has been a hedge fund graveyard as short positions on the country have moved sideways if not against the perps. .
The country spent over $1 trillion in reserves defending its currency over the past few years and now seems to have arrested capital flight. Pressure is building on the Hong Kong dollar, but we would not bet against it. At least not until it or if it breaks.
China is, after fall, still a command economy. The government can intervene whenever and with whatever policy it desires to protect and further the Party’s economic and political goals. Market discipline is not an issue in China if it threatens the government and political stability.
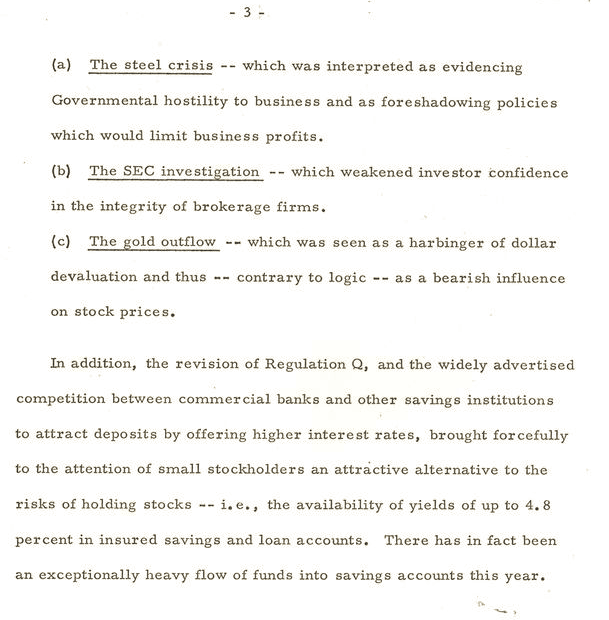
The U.S. Savings and Loans Crisis
For example, think of how bank deposit insurance subverts market discipline in the U.S. financial system. Though necessary to avert bank runs, financial institutions can remain in business with government deposit guarantees even with Frankensteinesque balance sheets.
GAO Report
As a graduate student, I worked at the General Accounting Office (GAO), the research arm of the U.S. Congress. I spent most of my time doing econometrics for a piece commissioned by a congressman who wanted to know what it would cost the government to resolve the 1980’s Savings and Loans crisis.
We estimated the cost of an immediate resolution of around $22 billion to close all the bankrupt S&Ls that were still able to operate due to the deposit guarantee (FSLIC). These thrifts were highly unprofitable as they paid higher deposit rates to attract funds and made riskier loans trying to hit the home runs or bet the ranch to “get them back to even.”
If they were allowed to continue in business – that is, if the government chose forebearence – we concluded it would eventually cost the taxpayer over $200 billion.
Because President Reagan wanted to avoid a further increase in record budget deficits, the Administration chose forbearance. At the end of the day more than half of the S&Ls failed costing Poppy Bush and the taxpayer more $200 billion. Some reports put the final cost closer to $500 billion.
Our report is still widely cited today.
Moral Hazard
The moral hazard of government guarantees can avert bank runs and market discipline but with a cost. A balance must be struck.
The one thing that is still etched in my mind after running thousands of statistical iterations during that paper are the many S&Ls that had a negative net worth or equity of more than 60 percent of total assets.
Can you imagine having your savings in such a deeply bankrupt institution? It did not matter with deposit guarantees, however. Moreover, you were earning 25-100 bps higher interest on what was effeectively U.S. Treasury risk. Not one penny of guaranteed deposits was lost.
China
China is moral hazard times a million. The system can remain afloat much longer than expected. China will do whatever it takes to survive.
We have been intermittent China macro bears over the past several years but, thank goodness, we never had the ‘nads to bet against the country.
Upshot
At the end of the day, it is clear to us governments will do whatever it takes to keep a sinking ship afloat. If it means printing $15 trillion in fiat currency, so be it. I never thought we would see this day, but it is what it is.
Our conclusion is the endgame will be inflation but probably not before several major deflation scares.
Argentina nationalized and directly monetized public pension short falls and debt payments. Don’t you think the U.S. and other governments will do the same or will politicians have the courage to restructure the promises they have made? Easy answer given recent history.
We bet Argentina over 1930’s America. Sorry defaltionistas.
The large-scale and opaque interconnections of the Chinese financial system continue to pose stability risks (Figure 1.18). China’s RMB 250 trillion (300 percent of GDP) banking system is tightly linked to the shadow banking sector through its exposure to off-balance-sheet investment vehicles. These vehicles are largely funded through the issuance of investment products (RMB 75 trillion), with roughly half sold to multiple investors as high-yielding alternatives to bank deposits and half held by single investors, including banks.47 They invest in various assets, such as bonds, bank deposits, and nonstandard credit assets, as well as in other investment products. Insurance companies also have considerable exposure to these vehicles because they invest in their products and use them as a source of funding. These little-regulated vehicles have played a critical role in facilitating China’s historic credit boom and have helped create a complex web of exposure between financial institutions.
Banks are exposed to investment vehicles along many dimensions—as investors, creditors, borrowers, guarantors, and managers. These vehicles rely on banks’ short-term financing to use leverage and manage their maturity mismatches. Banks, in turn, receive significant flows from these vehicles in the form of deposits and bond investments. Banks and other financial institutions are also direct investors in investment products. Small and medium-sized banking institutions and insurance companies are particularly exposed, with investment products accounting for one-fifth and one-third of their assets, respectively. About one-quarter of investment vehicle assets, in turn, are invested in other vehicles, leading to opaque cross-holding and leverage structures that are difficult for regulators and investors to monitor. Banks in particular are seen as implicitly guaranteeing the RMB 25 trillion in investment products they manage, which allows them to package high-risk credit investments as low-risk retail savings products. Investment vehicles managed by nonbank financial institutions are perceived to be higher risk, but in most cases banks still bear some risk as creditor, end investor, or guarantor.
The authorities have substantially tightened the regulatory framework to reduce risks related to investment vehicles and other borrowing between financial institutions. Since the summer of 2016, regulators have incorporated bank-sponsored investment vehicles in the macroprudential framework and have taken other steps to curb financial sector leverage and interconnectedness.48 Proposed asset management rules would also overhaul the investment product market beginning in 2018. In addition to limits on investment vehicle leverage and complexity, banks would be gradually restricted from investing in these vehicles or providing them with financial support. This restriction would limit their ability to implicitly guarantee investment products’ fixed-yield returns, effectively converting roughly half of the market from deposit-like products into mutual funds. In addition, the insurance regulator has clamped down on the sale of short-term investment products by life insurers. – IMF, Financial Stability Report