…Just Like The Titanic, But It’s Full of Bears!

Bad inflation print, bad retail print.

Market had a Jackie Moon moment just after the data release and is now trying to stabilize.  Ten minutes to open.  Big test today.  Not a buyer.

The S&P500 needs to hold 2612.97, the 23.6 fibo.   If that breaks, then Friday’s S&P low at 2532.69, which is just a few points below the 200-day moving average, is the red line.   If that breaks, look out below.

The massive short position in bond futures may provide some support. 

If you are gonna panic, you gotta do it before everyone else does.

Posted in Equities, Uncategorized | Tagged | Leave a comment

FinTech Investment By Top U.S. Banks

Fintech_Feb13

Posted in Banking, Uncategorized | Tagged , | Leave a comment

Watch These Levels

Is that it?  Is the sell-off over, new highs on the short-tem horizon?

Nobody knows.  The recovery is a process and unfolds one step tick at a time.

In our last Week In Review post, we noted,

Only three times since 1950 has intraday volatility jumped so high as measured by a modified version of the Average True Range: 1) September 1955 after an extraordinarily period of calm the S&P500 tanked on September 26th when markets opened after President Eisenhower’s heart attack on the 8th hole of Cherry Hills Country Club over the weekend. The market quickly recovered; 2) January 1962 when the “Kennedy slide” began to accelerate, and 3) the October 1987 stock market crash. – Global Macro Monitor, February 11

Given the historic vol shock we just experienced, we thought we would take a look at how the bear market of 1987 and 1962 unfolded after their volatility spikes.

We dismiss the 1955 Eisenhower heart attack shock as it was short-lived and did not result in a bear market.


S&P500_Feb12

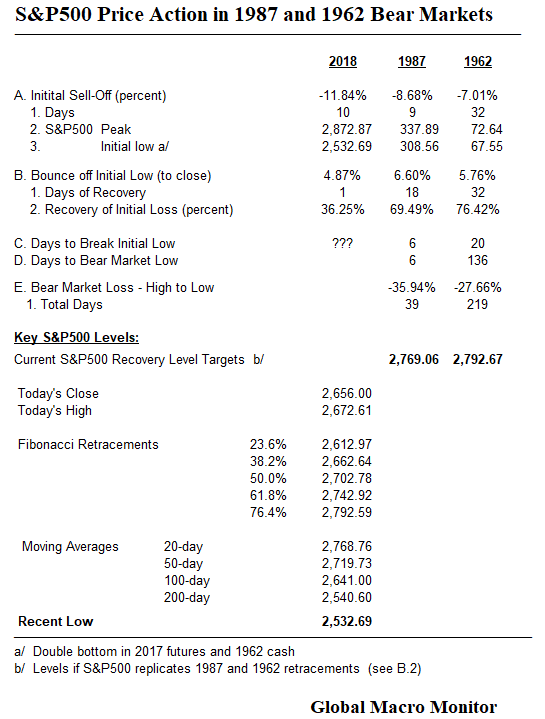
The table juxtaposes the 1987 and 1962 bear markets with the current S&P500.

The recent sell-off is several hundred basis points greater than that of the first wave of both the 1987 and 1962 bear markets, 11.84 versus 8.68 percent in 1987 and 1962’s 7.01 percent.  The first leg of the bear took nine days in 1987 and 32 days in 1962 versus ten days in this recent period.

Note the first leg down of the 1962 bear also ended with a double bottom as did the current S&P500 futures.
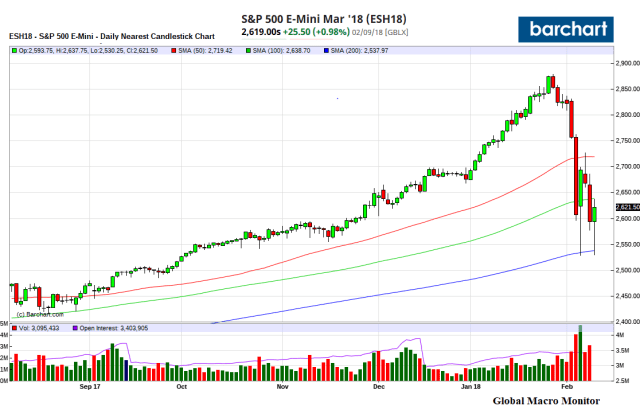
First Bounce

The S&P500 has thus far rebounded 4.87 percent off its Friday low, recovering 36.23 percent of its losses from the peak.  It compares to the initial bounce of 6.60 percent, and a 69.49 percent recovery in 1987, which lasted 18 days; and 5.76 percent in 1962, which recovered 76.42 percent of its peak to first low loss in 32 days.

Next Leg Down

The data are still unfolding for the current S&P500.

In 1987,  it took six days to break the initial lows after making the swing high.  The market then bounced 1.66 percent on October 13th, to close back above that low.  It was the last hope and gasp of the bulls, however.

The S&P500 then rolled over hard and fell 2.95 percent, 2.34 percent, and 5.16 percent the next three days going into the eve of the crash.

The S&P500 closed down 20.47 percent on Black Monday and finally bottomed the next day.

The total loss of the 1987 bear market was 35.94 percent on S&P500 from its high to low, and lasted 39 days,  40 days and 40 nights of testing.

1962

The 1962 bear market unfolded much slower.

After the initial bounce, the S&P500 took 20 days to take out the initial low and bounced around that level for ten days then rolled over hard.

The 1962 bear market also experienced a flash crash on May 28th, falling 6.7 percent.

“The stock market careened downward yesterday,” reported The Wall Street Journal on May 29, 1962, “leaving traders shaken and exhausted.” The Dow Jones Industrial Average fell 5.7% that day, down 34.95, the second-largest point decline then on record.

“The drop took place on volume so heavy,” added the Journal, that the “ticker wasn’t able to finish reporting floor transactions until 5:59 p.m., two hours and 29 minutes after the market closed.”

…The crash of 1962 is a reminder that markets always have been messy and that investors’ morale always has been fragile. What’s more, the problems the regulators sought to solve nearly a half-century ago are still with us today. They probably will be tomorrow, too.  — Jason Zweig,  Wall St. Journal

The S&P500 took 136 days to bottom after breaking its initial low, beginning its rebound after the Soviets stood down during the Cuban Missile Crisis.

The 1962 bear market clipped 27.66 percent of the S&P500 and lasted 219 trading days.

Current S&P500 Target Levels

The table also shows the key levels for the current S&P500.

Most interesting are those levels which replicate the initial bounce of the 1987 bear, a 2,760.06 S&P500 and 1962, a level of 2,792. 67.  The message here is not to get complacent or too lathered up as the market rallies hard off the recent low.   It can go a lot further and is commonplace even in bear markets.

Noteworthy is that the S&P traded through the 38.2 fibo today but failed to close above it.
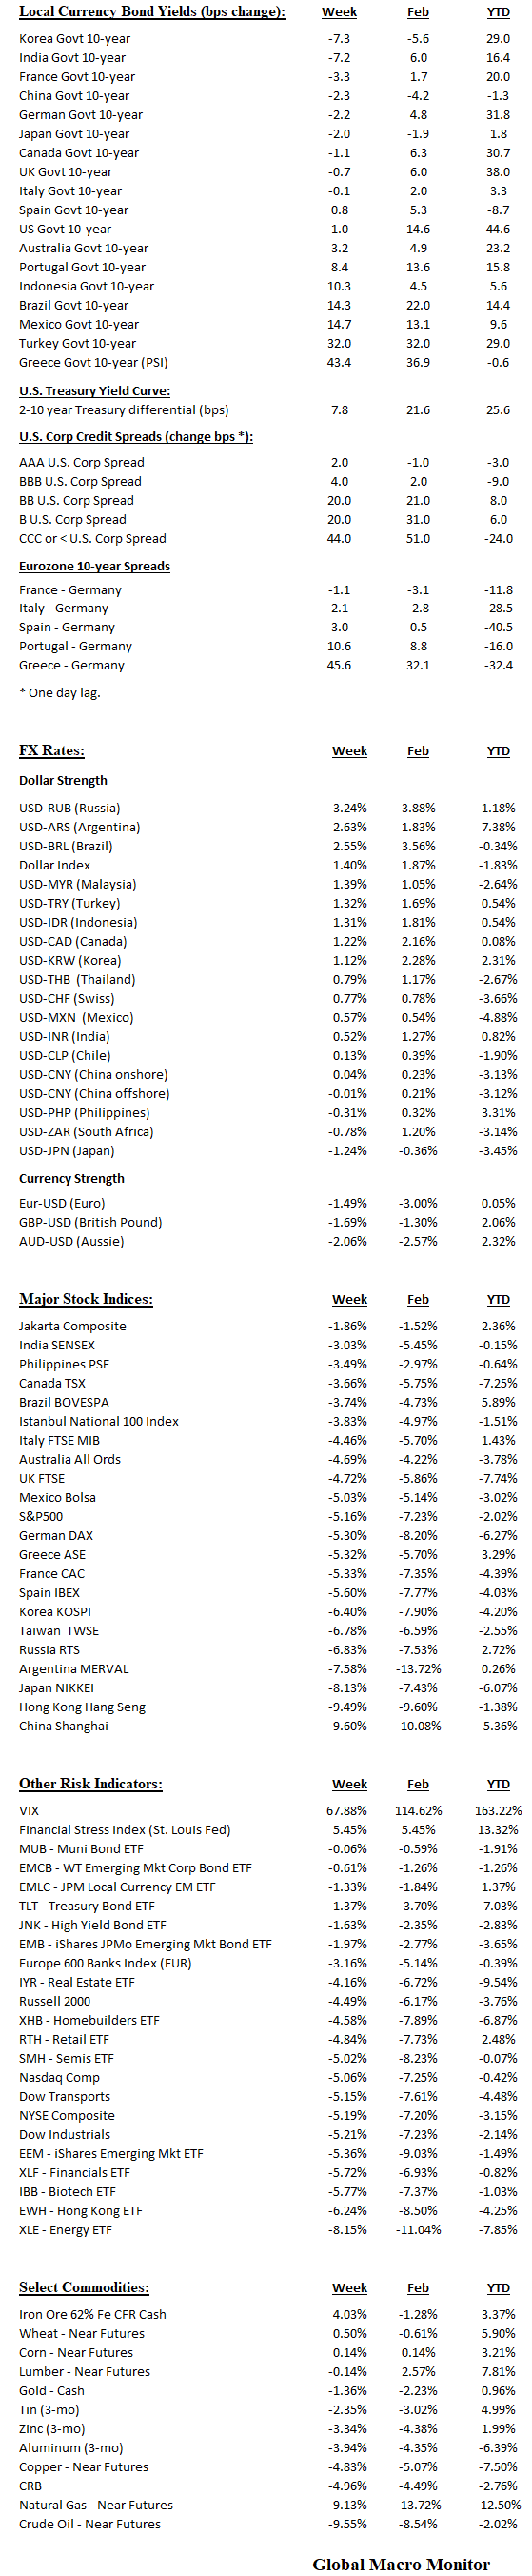
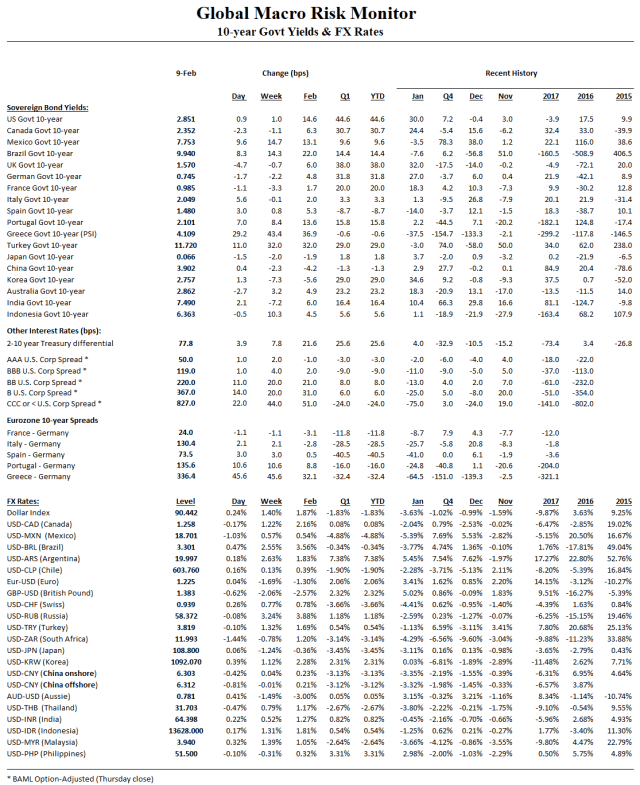
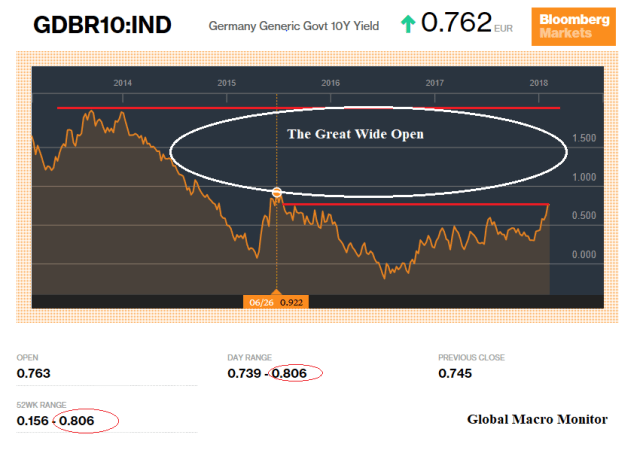
Bond Yields

We are also watching bond yields closely because their path is going to determine the direction of the stock market

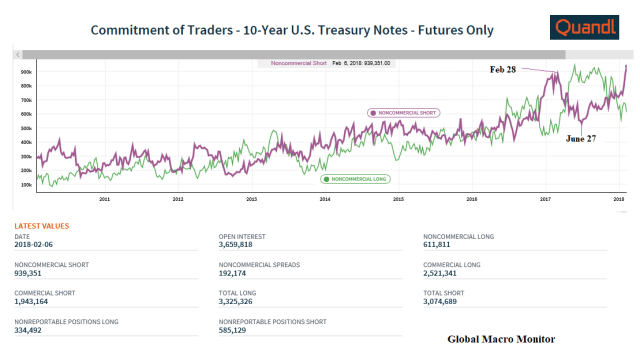
As the Quandl chart shows, the fast money crowd is significantly short 10-year note futures.

It is not always a prelude to an imminent short squeeze, however,  as the 10-year note yield chart shows the fast money had pretty good timing as yields temporarily spiked at their maximum short positions.

They then had to scramble to cover their positions generating the massive squeezes.


CFTC_Feb12

We sense the market technicals are rapidly changing, however.  The Fed is out and now running down their book.  Foreigners are tepid buyers, at best.

Moreover, the increase in supply in the form of future new issuance is not insignificant. Starting to catch a whiff of concern about the U.S financing its budget deficits.  Triple yikes!

Nevertheless, keep the CFTC data on your radar going into Wednesday’s CPI release.  If the number misses to the downside, it could get squeezy.

TNOTE_Feb12

Upshot

Is the stock market out of the woods?

Can’t say with certainty, but as the IMF representative in Uruguay used to respond when we pressed him if the government, who was facing elections in two months, could obtain a Fund program,

It is possible, but not probable.”  –  IMF Uruguay Rep, circa…

We knew damn well there would be no deal.

Will we see a new high on the S&P500 sometime soon?   It is possible,  but not probable.

One Last Thing

Another take away from our data crunching exercise is that if the recent S&P low at 2,532.69 is taken out,  we suspect the exits will be jammed with those trying to get horizontal, and fast.   Take 1987 as your analog.

Finally,  we are the first to acknowledge that though the facts may be correct, our conclusions may be wrong.   Also keep that on your radar.

Good luck, folks

Posted in Bonds, Equities, Uncategorized | Tagged , | 57 Comments

Week In Review: JP And The JFK-Trump S&P500 Analog

Not a lot of poetry or prose again this week. We posted much material on our thoughts over the last few days. Have a look.

Also review the data tables below.

We do think markets are in for a bounce for a few days, but we believe we are far from out of the woods.  Credit spreads are starting to wobble.

Historic Volatility Spike

Only three times since 1950 has intraday volatility jumped so high as measured by a modified version of the Average True Range:  1) September 1955 after an extraordinarily period of calm the S&P500 tanked on September 26th when markets opened after President Eisenhower’s heart attack on the 8th hole of Cherry Hills Country Club over the weekend. The market quickly recovered; 2) January 1962 when the “Kennedy slide” began to accelerate; and 3) the October 1987 stock market crash.

Kennedy-Trump S&P500 Analog

This market is starting to look very similar to the JFK post-election rally, top, and bear market, which eventually bottomed when Khrushchev backed down during the Cuban Missile Crisis. We will post more on the JFK-Trump S&P500 analog later in the week.

We were planning on doing it later today but have to visit a dear friend in the hospital.

JP

Do us a favor.  Shoot up a prayer, send and think good thoughts, light a candle, or whatever works for you for our good friend JP.  We love him dearly.

He is a true American hero and a such a great and decent human being.   Think of it as your cost of admission to the Global Macro Monitor and duty to the international brotherhood of man.  No political correctness here.

If only the world were full of JPs, we would be in such a better place.

Please fight hard, as you always do, and get well, my brother.

This Week

The key on Sunday night is to watch how the Hang Seng trades.  It should have a big bounce, followed by rallies in Europe, signaling the U.S. market has some legs.

Most important, however, is the action in the bond markets. Higher interest rates will snuff out any bounce and continue to reprice equity values at lower levels.

Good luck this week, folks.

.

JFK_Trump S&P500_Analog

.

Week_2017_ETFs

.Weekly_Table


Posted in Uncategorized, Week in Review | Tagged , , , , , | 51 Comments

Could 2018 Be the Year of the Next Financial Crisis?

Interesting this was posted two days before market top.  One of the major concerns was a spike in volatility.  So prescient.

Davos was so lathered up with Bull.  Always so contrarian.

Is the century’s longest stock market bull run about to come to an end? Get ahead of the trends that will determine the world’s asset markets in 2018.

· Michael C. Bodson, President and CEO, Depository Trust & Clearing Corporation  (DTCC)
· Hélène Rey, Lord Bagri Professor of Economics, London Business School, UK

Moderated by Peter Wolodarski, Editor-in-Chief, Dagens Nyheter, Sweden

http://www.weforum.org/


Posted in Equities, Uncategorized | Tagged , , | Leave a comment

Sector ETF Performance – February 9

ETF_D

ETF_W

ETF_M

ETF_YTD

Posted in Sector ETF Peformance, Uncategorized | Tagged , | Leave a comment

Global Risk Monitor – February 9

RiskMon_1

RiskMon_2

Posted in Daily Risk Monitor, Uncategorized | Tagged , , , , , | Leave a comment

Just Another Day At The Office

Day at the office_Feb9
Wola-freakin’-tility!

The Dow traded in a 1,022 point, or 4.3 percent, intraday range today.  That is emerging market volatility, folks.

Dow_Feb9

What a close to an ugly week and a bookend win to the week for the bulls.

Classic double bottom bounce for S&P500 futures off its 200-day moving average, but was  rejected at its 100-day to close off the intraday high.   The traders and algos tracks all over this market today.

Note the first bottom was made in overnight trading early Tuesday morning;  the cash S&P500 never had a chance to trade there.

S&P_Feb9

Out of the woods?   Don’t know but doubt it.

Just as trees do not grow to the sky, dead cats do bounce, and the oversold conditions should generate some more bounce.   This is a process and reveals itself only one step at a time.

If the market is in the “heal thyself” mode, the first upside target for the S&P500 is today’s high, the 100-day, at 2638 and then 2650.   These seem meaningless, however, given the yuge volatility.

We are looking more to the bond market for direction in stocks because that is where the fire started.

Posted in Algos, Bonds, Equities, Uncategorized | Tagged , , | Leave a comment

Watch These Spaces

It seems like an eternity since our January 28th Sunday night post, Watch This Space.

The S&P500 had closed at the high of the day on Friday and also what was the high of 2018. We warned to watch the German 10-year bund yield because Europe is where big bond bubble is.

Because the eurozone is where the big bond bubble lives.

Though the euro periphery is now in Convergence 2.0 mode on hopes of eMac’s vision of a more integrated ‘zone, the German 10-year is at a critical level, and yields only 63 basis points in an economy that is probably growing close to 5 percent on a nominal annual basis. It reflects a stunningly loose monetary policy and a central bank way behind the curve.

A spike in bund yields could put further pressure on U.S. bond yields and may be the trigger for the long-awaited and ever fleeting equity market correction. – Global Macro Monitor

What went little unnoticed today, is that the German 10-year yield traded with an 80 bps handle before falling back into the close. It has not been up there since the summer of 2015 and is now only about 15 bps from busting out Into The Great Wide Open, where there is little resistance  until 2 percent.

Bund_Feb8

That would do some major damage to the U.S. bond market, pushing 10-year yields through 3 percent and further resetting equity valuations.

Every Central Bank Still Has Negative Real Policy Rates

We are also looking at how far behind the curve every major central bank is in raising their policy rates. Charlie’s table below shows that even though the global manufacturing PMI is at a seven-year high, all the major central banks of the world still have negative real policy interest rates.

CenBanks_Feb8

Any wonder why the great Paul Tudor Jones fears we are on the eve of a great inflation?

Bond Market Vigilantes Back

Furthermore, U.S. fiscal promiscuity appears to have resurrected the bond market vigilantes. Haven’t seen those buzzards in over twenty years.

We have a growing economy, the labor market’s tight, we don’t have a lot of idle resources,” said Matthew Mitchell, the director of the Project for the Study of American Capitalism at the Mercatus Center at George Mason University. “Basically, the very best argument for Keynesian economics doesn’t apply now. So it really is the time to be austere.” – NY Times, February 6

In fact, the current supply and demand dynamics of the bond market are not favorable.  On the supply side, the U.S deficit is skyrocketing.

Demand for U.S Debt is diminishing.  The Fed, which has financed almost 100 percent of U.S. deficits over much of the last ten years are gone and now running off their Treasury book.

Furthermore, foreign buyers, who own more than 50 percent of the stock of marketable long-term Treasury bonds, now appear hesitant to buy more, either because they are full up and/or they fear dollar weakness, due to the perception that U.S. leadership in the world is declining and not helped by Mr. Mnuchin’s dollar faux pas in Davos.

Fundamentals

To conclude, we believe it is the above two factors, among others, that are putting the fear in the stock market.

Is it a change in fundamentals as the financial pundits overwhelmingly dismiss?

We think so but it is more complicated.   David Darst of Morgan Stanley couldn’t put it better,

Markets don’t change when fundamentals change; markets change when beliefs change – David Darst

Like a change from the euphoria of a synchronized global recovery to the fear of synchronized global quantitative tightening?

Turn Around Friday?

As we write, the S&P500 looks to open up over one percent. Hope it holds as it needs a strong close on a Friday afternoon to stabilize.   Not the norm for Fridays,  however.

Markets do need some help to stabilize, but central banks are not there yet. The sell-off has thus far been “small potatoes” in the words  of NY Fed President,  Bill Dudley.

Another 10 percent down it will be time for the sequel to the Bonds With A Draghi Tattoo.


Posted in Bonds, Currency, Global Stock Performance, Uncategorized | Tagged , , , | 66 Comments

Fugly Trading Week

Posted in Equities, Uncategorized | Tagged | Leave a comment