Europe’s Bad Debts Still Haunt The Euro Banks

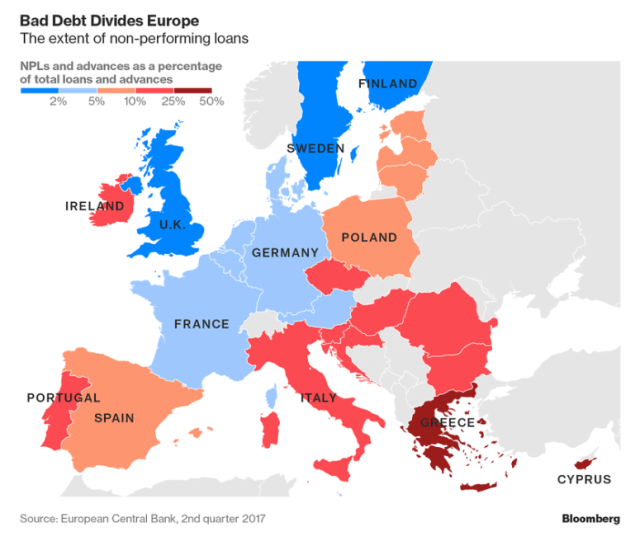
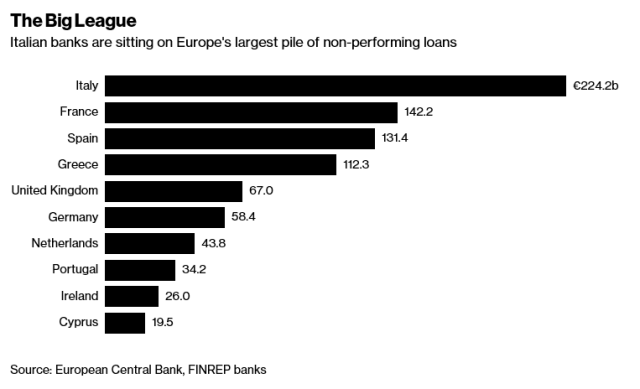
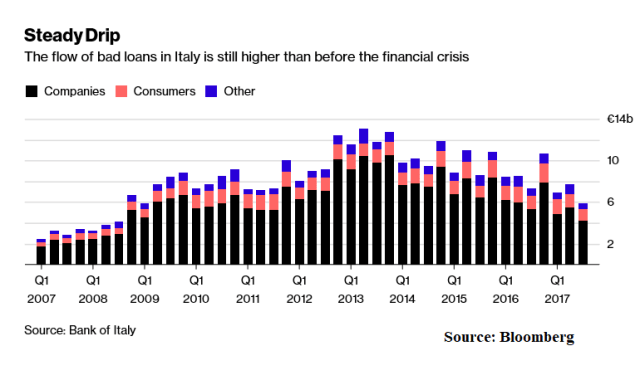
Looks like the new “Iron Curtain” in Europe is the non-performing loans (NPLs)  in each country’s banking system.    Greece and Italy stand out.

For European banks, it’s a headache that just won’t go away: the 944 billion euros ($1.17 trillion) of non-performing loans that’s weighing down their balance sheets.

Economists say the pile of past-due and delinquent debt makes it harder for banks to lend more money, hurting their earnings. European authorities are prodding lenders to sell or wind down non-performing credit, but they’re split on how to tackle the issue, and some investors are disappointed by the pace of progress.  – Bloomberg

Europe's Bad Debt Problems_Feb14


Europe's Bad Debt Problems__2_Feb14

Europe's Bad Debt Problems__3_Feb14

Posted in Banking, Debt, Euro, Uncategorized | Tagged , , | 2 Comments

Impressive Win For The Bulls


WinFlag_Feb14

That was impressive.

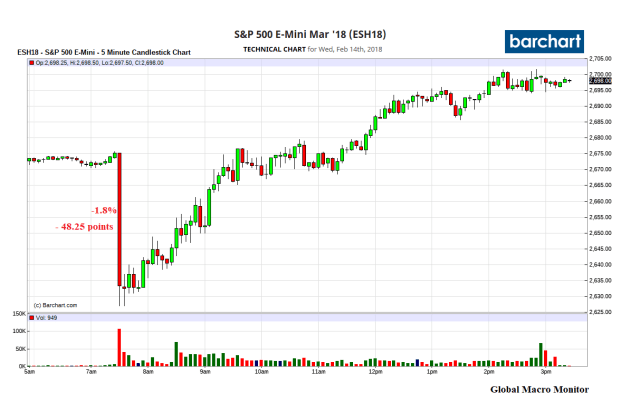
The hot CPI and weak retail sales data hits the tape at 8:30 eastern, S&P500 futures trade down 48.25 points or 1.8 percent in a Jackie Moon moment,  bounces around for about 20 minutes, then takes off and trades up 2.8 percent from the low into the close.  Even as the 10-year yield breaks and closes through the Maginot Line of 2.9 percent.

S&P500_intraday_Feb14

The cash S&P500 has now rallied 6.55 percent off its Friday low and recovered 48.78 percent of the high-to-low loss in this market move.   A move through the 20-day moving average at around 2770 will force the bears and shorts to reconsider their market view.

Can’t believe we are sucked into commenting on short-term moves, which are noise and random at best, determined almost solely by how the fast money is positioned and leaning.  But in the long-run there is always another short-run.

Nevertheless, today’s price action signals:  1) the market is “sold out” in the short-term;  2) there are few real sellers left in this leg, and 3) the fast money and machines were offside going into the CPI betting on an Armageddon number, which they kind of  got but were not rewarded.  Bond shorts faired much better.

The bullish and FOMO psychology hasn’t washed out yet and thus still makes us suspect the lows are not in.   The market is still very expensive and you can throw out the widely touted “fairly valued” EPS, which are the result of financial engineering and stock buybacks.

We like the S&P500 Price to Sales ratio as a more objective valuation metric as even earnings can easily be manipulated and are creatures of corporate CFOs.   We know that from our experience of working in a large money center bank.

Moreover,  the dollar continues to weaken, when fundamentals favors strength, which is a major concern.  Especially as interest rates rise.

Something is rotten and driving the capital flight.

Today was impressive, however.  Chalk another one up for the bulls.

Next Levels

Today’s high on the cash S&P500 was 2702.1, just a little more than 50 bps below 2702.78, the 50 percent retracement and key Fibonacci level.  The next level is 2726.67, last Wednesday’s high before the swan dive to 2532.69 on Friday morning.

Where Are 10-Year Yields Headed?

Nobody knows and because of that uncertainty, we look to gurus or technical analysis to comfort us and ease the anxiety of not knowing the future.

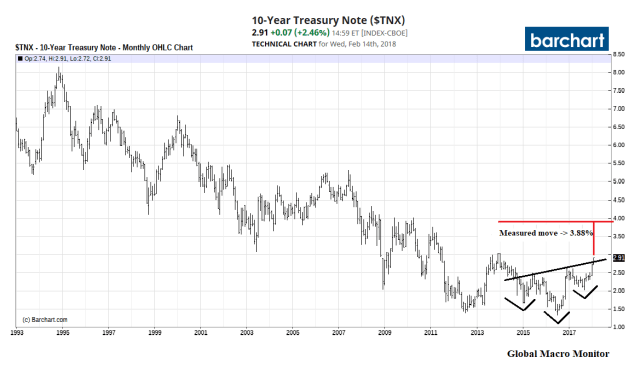
We do know the long-term downtrend on yields has been broken and looking at the chart, a reverse head-and-shoulders bottom has formed.   The neckline has been broken and a measured move  will take the 10-year to around 4 percent.

TNOTE Yield_Feb14

Makes sense to us, fundamentally,  as real interest rates are set to rise due to the supply and demand dynamics in the U.S. bond market and inflation is increasing.    A two to three percent real rate plus inflation has always been a running assumption for the long-term equilibrium interest rate all throughout our research career.

Technical Analysis

Technical analysis is imperfect but a tool, and one way to light the uncertain and a foggy-lit path of future prices.    We are not religious zealots and only half way sold on the utility of technical analysis but just throwing it out there for you.

We infer from the price action and lots of losses of the past several years that the machines use technical analysis to set bear and bull traps.   It has rarely paid to place a bet when a key technical level breaks as the algos are programmed to generate a giant reversal and squeeze when they calculate and estimate the net position of traders is leaning the wrong way.

Whatever your view, however, three percent is the next big number for the 10-year note yield.

By the way, remind us not to comment on short-term market moves.

Posted in Bonds, Equities, Uncategorized | Tagged , , | Leave a comment

German coalition agreement: AI program shows bias

Wow,  the robots are even coming for the political scientists.

Researchers used artificial intelligence to compare the manifestos of the German parties with the coalition agreement. And it showed that 70 percent of the content referred to the SPD manifesto and only 30 percent to that of the conservatives…

READ MORE:  http://www.euronews.com/2018/02/13/german-coalition-agreement-ai-program-shows-bias


Posted in Germany, Politics, Uncategorized | Tagged , , | Leave a comment

…Just Like The Titanic, But It’s Full of Bears!

Bad inflation print, bad retail print.

Market had a Jackie Moon moment just after the data release and is now trying to stabilize.  Ten minutes to open.  Big test today.  Not a buyer.

The S&P500 needs to hold 2612.97, the 23.6 fibo.   If that breaks, then Friday’s S&P low at 2532.69, which is just a few points below the 200-day moving average, is the red line.   If that breaks, look out below.

The massive short position in bond futures may provide some support. 

If you are gonna panic, you gotta do it before everyone else does.

Posted in Equities, Uncategorized | Tagged | Leave a comment

FinTech Investment By Top U.S. Banks

Fintech_Feb13

Posted in Banking, Uncategorized | Tagged , | Leave a comment

Watch These Levels

Is that it?  Is the sell-off over, new highs on the short-tem horizon?

Nobody knows.  The recovery is a process and unfolds one step tick at a time.

In our last Week In Review post, we noted,

Only three times since 1950 has intraday volatility jumped so high as measured by a modified version of the Average True Range: 1) September 1955 after an extraordinarily period of calm the S&P500 tanked on September 26th when markets opened after President Eisenhower’s heart attack on the 8th hole of Cherry Hills Country Club over the weekend. The market quickly recovered; 2) January 1962 when the “Kennedy slide” began to accelerate, and 3) the October 1987 stock market crash. – Global Macro Monitor, February 11

Given the historic vol shock we just experienced, we thought we would take a look at how the bear market of 1987 and 1962 unfolded after their volatility spikes.

We dismiss the 1955 Eisenhower heart attack shock as it was short-lived and did not result in a bear market.
 

S&P500_Feb12

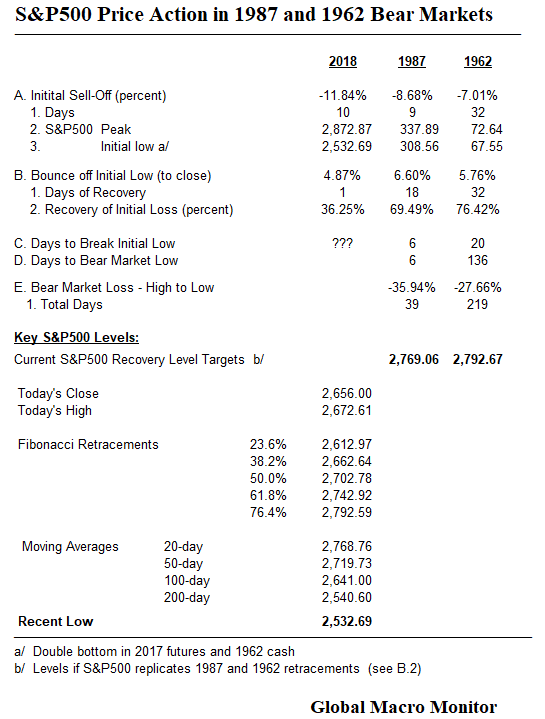
The table juxtaposes the 1987 and 1962 bear markets with the current S&P500.

The recent sell-off is several hundred basis points greater than that of the first wave of both the 1987 and 1962 bear markets, 11.84 versus 8.68 percent in 1987 and 1962’s 7.01 percent.  The first leg of the bear took nine days in 1987 and 32 days in 1962 versus ten days in this recent period.

Note the first leg down of the 1962 bear also ended with a double bottom as did the current S&P500 futures.

First Bounce

The S&P500 has thus far rebounded 4.87 percent off its Friday low, recovering 36.23 percent of its losses from the peak.  It compares to the initial bounce of 6.60 percent, and a 69.49 percent recovery in 1987, which lasted 18 days; and 5.76 percent in 1962, which recovered 76.42 percent of its peak to first low loss in 32 days.

Next Leg Down

The data are still unfolding for the current S&P500.

In 1987,  it took six days to break the initial lows after making the swing high.  The market then bounced 1.66 percent on October 13th, to close back above that low.  It was the last hope and gasp of the bulls, however.

The S&P500 then rolled over hard and fell 2.95 percent, 2.34 percent, and 5.16 percent the next three days going into the eve of the crash.

The S&P500 closed down 20.47 percent on Black Monday and finally bottomed the next day.

The total loss of the 1987 bear market was 35.94 percent on S&P500 from its high to low, and lasted 39 days,  40 days and 40 nights of testing.

1962

The 1962 bear market unfolded much slower.

After the initial bounce, the S&P500 took 20 days to take out the initial low and bounced around that level for ten days then rolled over hard.

The 1962 bear market also experienced a flash crash on May 28th, falling 6.7 percent.

“The stock market careened downward yesterday,” reported The Wall Street Journal on May 29, 1962, “leaving traders shaken and exhausted.” The Dow Jones Industrial Average fell 5.7% that day, down 34.95, the second-largest point decline then on record.

“The drop took place on volume so heavy,” added the Journal, that the “ticker wasn’t able to finish reporting floor transactions until 5:59 p.m., two hours and 29 minutes after the market closed.”

…The crash of 1962 is a reminder that markets always have been messy and that investors’ morale always has been fragile. What’s more, the problems the regulators sought to solve nearly a half-century ago are still with us today. They probably will be tomorrow, too.  — Jason Zweig,  Wall St. Journal

The S&P500 took 136 days to bottom after breaking its initial low, beginning its rebound after the Soviets stood down during the Cuban Missile Crisis.

The 1962 bear market clipped 27.66 percent of the S&P500 and lasted 219 trading days.

Current S&P500 Target Levels

The table also shows the key levels for the current S&P500.

Most interesting are those levels which replicate the initial bounce of the 1987 bear, a 2,760.06 S&P500 and 1962, a level of 2,792. 67.  The message here is not to get complacent or too lathered up as the market rallies hard off the recent low.   It can go a lot further and is commonplace even in bear markets.

Noteworthy is that the S&P traded through the 38.2 fibo today but failed to close above it.

Bond Yields

We are also watching bond yields closely because their path is going to determine the direction of the stock market

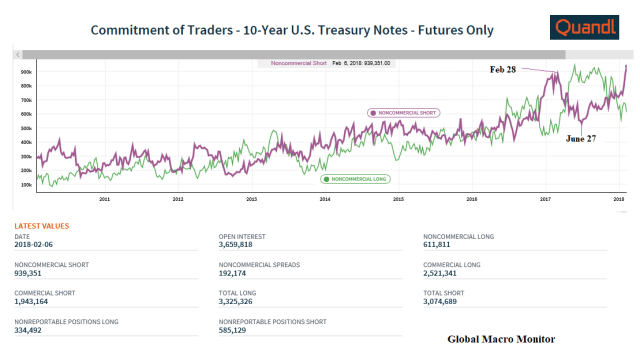
As the Quandl chart shows, the fast money crowd is significantly short 10-year note futures.

It is not always a prelude to an imminent short squeeze, however,  as the 10-year note yield chart shows the fast money had pretty good timing as yields temporarily spiked at their maximum short positions.

They then had to scramble to cover their positions generating the massive squeezes.
 

CFTC_Feb12

We sense the market technicals are rapidly changing, however.  The Fed is out and now running down their book.  Foreigners are tepid buyers, at best.

Moreover, the increase in supply in the form of future new issuance is not insignificant. Starting to catch a whiff of concern about the U.S financing its budget deficits.  Triple yikes!

Nevertheless, keep the CFTC data on your radar going into Wednesday’s CPI release.  If the number misses to the downside, it could get squeezy.

TNOTE_Feb12

Upshot

Is the stock market out of the woods?

Can’t say with certainty, but as the IMF representative in Uruguay used to respond when we pressed him if the government, who was facing elections in two months, could obtain a Fund program,

“It is possible, but not probable.”  –  IMF Uruguay Rep, circa…

We knew damn well there would be no deal.

Will we see a new high on the S&P500 sometime soon?   It is possible,  but not probable.

One Last Thing

Another take away from our data crunching exercise is that if the recent S&P low at 2,532.69 is taken out,  we suspect the exits will be jammed with those trying to get horizontal, and fast.   Take 1987 as your analog.

Finally,  we are the first to acknowledge that though the facts may be correct, our conclusions may be wrong.   Also keep that on your radar.

Good luck, folks

Posted in Bonds, Equities, Uncategorized | Tagged , | 57 Comments

Week In Review: JP And The JFK-Trump S&P500 Analog

Not a lot of poetry or prose again this week. We posted much material on our thoughts over the last few days. Have a look.

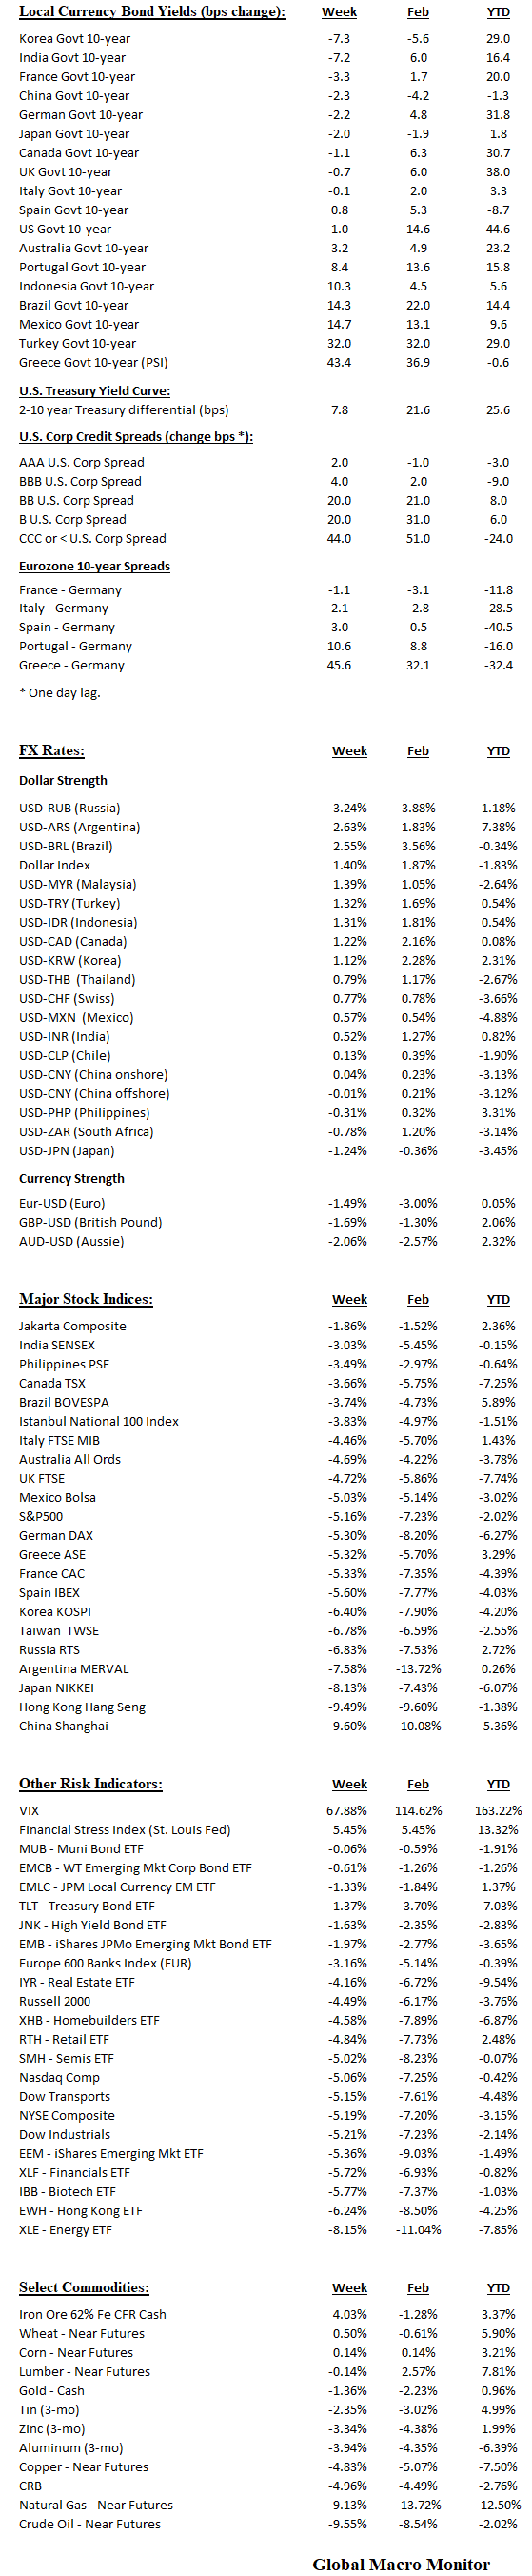
Also review the data tables below.

We do think markets are in for a bounce for a few days, but we believe we are far from out of the woods.  Credit spreads are starting to wobble.

Historic Volatility Spike

Only three times since 1950 has intraday volatility jumped so high as measured by a modified version of the Average True Range:  1) September 1955 after an extraordinarily period of calm the S&P500 tanked on September 26th when markets opened after President Eisenhower’s heart attack on the 8th hole of Cherry Hills Country Club over the weekend. The market quickly recovered; 2) January 1962 when the “Kennedy slide” began to accelerate; and 3) the October 1987 stock market crash.

Kennedy-Trump S&P500 Analog

This market is starting to look very similar to the JFK post-election rally, top, and bear market, which eventually bottomed when Khrushchev backed down during the Cuban Missile Crisis. We will post more on the JFK-Trump S&P500 analog later in the week.

We were planning on doing it later today but have to visit a dear friend in the hospital.

JP

Do us a favor.  Shoot up a prayer, send and think good thoughts, light a candle, or whatever works for you for our good friend JP.  We love him dearly.

He is a true American hero and a such a great and decent human being.   Think of it as your cost of admission to the Global Macro Monitor and duty to the international brotherhood of man.  No political correctness here.

If only the world were full of JPs, we would be in such a better place.

Please fight hard, as you always do, and get well, my brother.

This Week

The key on Sunday night is to watch how the Hang Seng trades.  It should have a big bounce, followed by rallies in Europe, signaling the U.S. market has some legs.

Most important, however, is the action in the bond markets. Higher interest rates will snuff out any bounce and continue to reprice equity values at lower levels.

Good luck this week, folks.

.

JFK_Trump S&P500_Analog

.

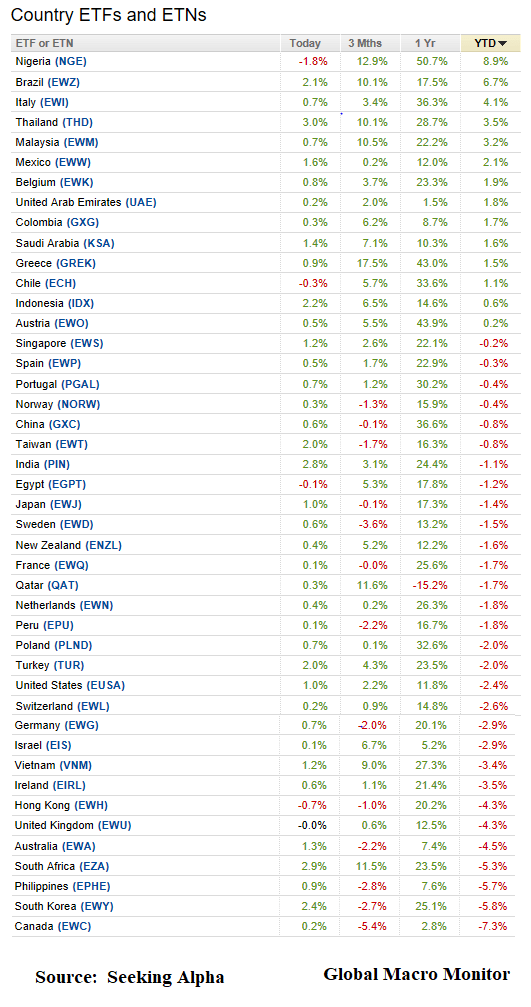
Week_2017_ETFs

.Weekly_Table


Posted in Uncategorized, Week in Review | Tagged , , , , , | 51 Comments

Could 2018 Be the Year of the Next Financial Crisis?

Interesting this was posted two days before market top.  One of the major concerns was a spike in volatility.  So prescient.

Davos was so lathered up with Bull.  Always so contrarian.

Is the century’s longest stock market bull run about to come to an end? Get ahead of the trends that will determine the world’s asset markets in 2018.

· Michael C. Bodson, President and CEO, Depository Trust & Clearing Corporation  (DTCC)
· Hélène Rey, Lord Bagri Professor of Economics, London Business School, UK

Moderated by Peter Wolodarski, Editor-in-Chief, Dagens Nyheter, Sweden

http://www.weforum.org/


Posted in Equities, Uncategorized | Tagged , , | Leave a comment

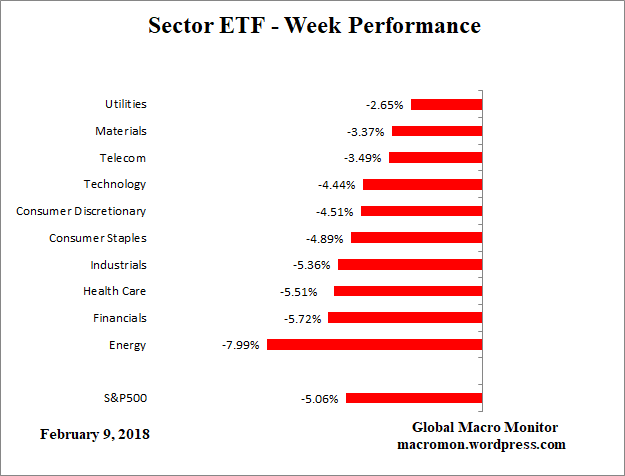
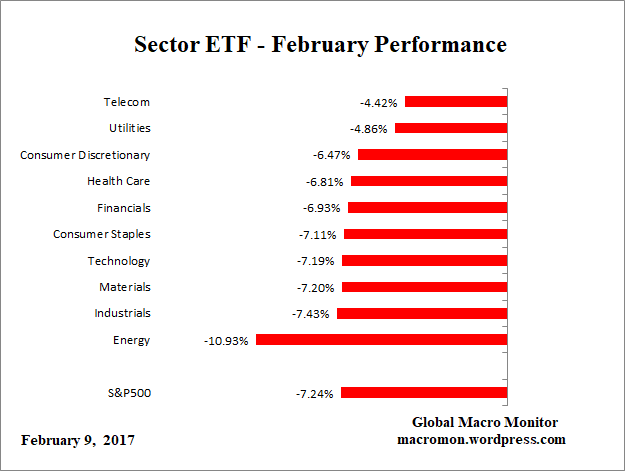
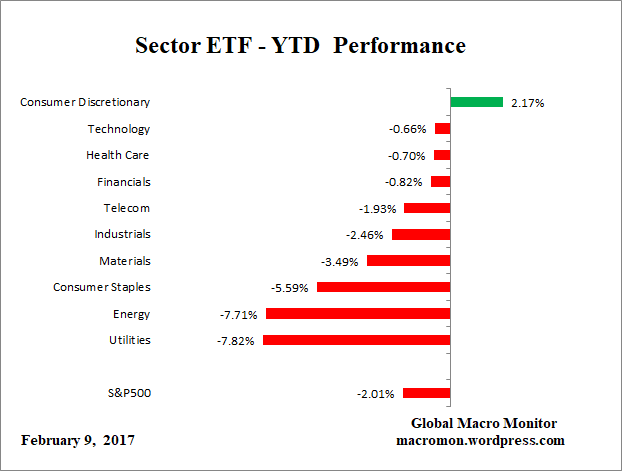
Sector ETF Performance – February 9

ETF_D

ETF_W

ETF_M

ETF_YTD

Posted in Sector ETF Peformance, Uncategorized | Tagged , | Leave a comment

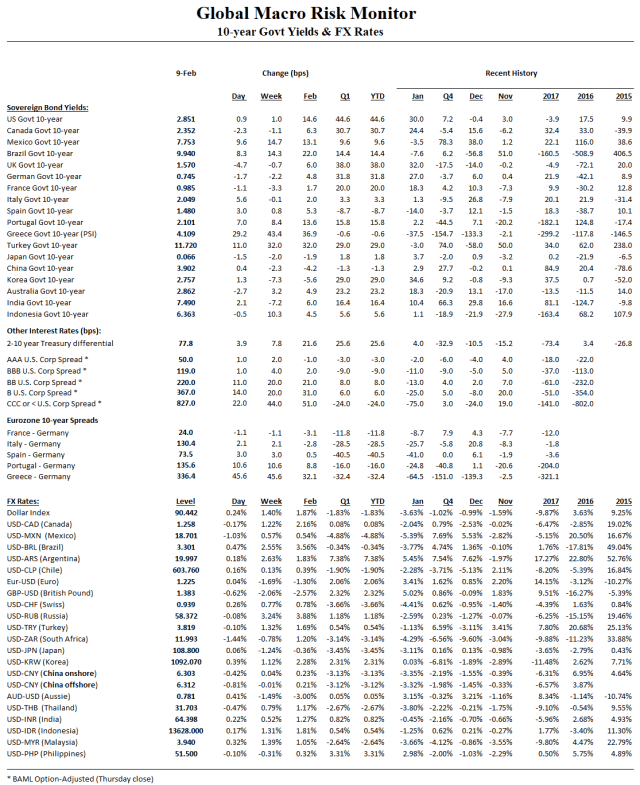
Global Risk Monitor – February 9

RiskMon_1

RiskMon_2

Posted in Daily Risk Monitor, Uncategorized | Tagged , , , , , | Leave a comment