Textbook Progression To A Bear Market

OK.  Not a bear market quite yet.

The official level of the S&P500 for the current sell-off to morph into a bear market (down 20 percent from local high) is 2298.30, down 14.92 percent from today’s close.  The official correction level, 2585.58, was hit and broken on February 8th.

We believe there will be a stock bear market in 2018 but less confident on its depth and length, however.   We will turn that page, if, and when, we get there.

Key Data and Levels

The following table is updated with some key economic indicators and S&P target levels.
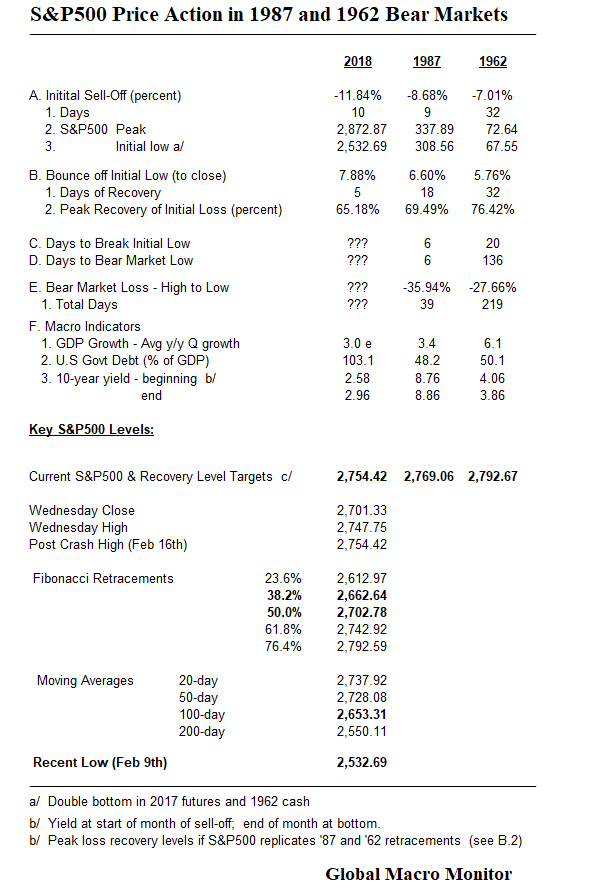
 

Table_Feb21

Recall in our earlier posts (see here and here), there have been three other massive volatility shocks since 1950,  similar to the one the S&P500 just experienced.

1) 1955: Ike’s heart attack;  2) 1962:  the “Kennedy slide” or JFK bear market; and 3) 1987:  the “crash” bear market, which lasted only 38 days.

We threw out Ike’s heart attack as it was not a prelude to a bear market.  The S&P500 recovered shortly after the sharp Monday sell-off after President Eisenhower had a heart attack on the 8th hole at Cherry Hills Country Club the prior Saturday afternoon.

Bear Markets Do Not Happen Without Recession?

To that, we say, poppycock!  Time to tune out the cheerleaders.

The data are clear.  The U.S. economy thrived during the 1962 bear market, growing at more than 6 percent, on average.  The economy grew at 3 ½  percent in 1987.   No recession, not even close, in those two bears.

The Great Moderation

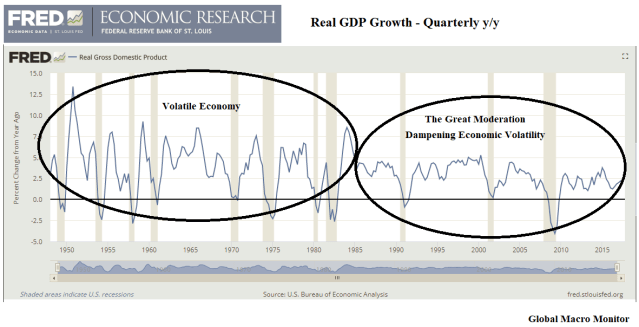
Before the early 1980’s, the U.S. economy experienced much higher short-term volatility. The FRED table illustrates the dampening of volatility over the past 30 years, though at much lower growth rates.  Economists refer to this recent period as The Great Moderation.

Debt Concerns

The current U.S. government debt-to-GDP ratio is more than double what is was in both the 1987 and 1962 bear markets.  It is the crux of the current sell-off, in our opinion.

We sense that the global markets are growing increasingly concerned about high debt levels in a rising interest rate environment.   Couple that with Washington’s fiscal promiscuity and extreme valuations and overbought conditions, and the ingredients of a bear market are baked in.  It is also probably why the dollar is so weak.

We can make a very bearish case with debt doom loops and all kinds of macro instability, but won’t go there until price discovery takes us there.

Nevertheless,  keep these words on your radar:  fette Schwänze, colas gordas,  grosses queues, or in simple English,  Fat Tails.   As volatility spikes,  girth increases.

Recent Price Action

Notice how the market traded today.  Up big then reversed as the 10-year yield spiked through 2.95 percent.

Interest Rates

Interest rates were not a concern in 1962 as the data show the 10-year yield declined 30 basis points during the bear market.  Not the case in 1987,  however, where  rising interest rates and a weak dollar culminated in the October 19th global stock market crash.

Some possible reasons for the stock market crash of 1987 and for the rapid psychological shift of the market participants:

  • rapidly increasing short term US interest rates (the annualized yield of 3M US Treasury Bills increased from 5.30% on 20.01.1987 to the high print of the year: 7.19% on 14.10.1987 – an increase of 189 basis points)
  • rapidly increasing long term US interest rates (the yield of 30Y US Treasury Bonds increased from the low print of the year: 7.29% on 09.01.1987 to the high print of the year: 10.25% on 19.10.1987 – an increase of 296 basis points)
  • weakening US dollar (=falling against most major foreign currencies)
  • deteriorating US current account deficit
  • escalating US government debt
  • very high price-earnings-ratios (P/E)
  • very low dividend yields
  • very bullish investor sentiment figures (= too much optimism by investors)
  • deteriorating “market breadth” (e.g.: weak Advance-Decline-Line)

Source:  www.sniper.at

Wow,  sounds eerily familiar, no?

Market Recovery Falters

The S&P could not hold the key 61.8 percent Fibo level at 2742.92 nor 2728.08, its 50-day moving average.

Moreover, the index closed today just below the 50 percent Fibonacci retracement level.

Normal Path To A Bear Market

At Friday’s intraday high,  the index had retraced 65.18 percent of its first leg down, very close to the 1962 (76.42 percent) and 1987 (69.49 percent)  retracements (see table).

In other words, last week’s recovery was a normal bounce off the initial lows on the path to a bear market.

Levels To Watch

The next critical levels on the downside for the S&P is the 38.2 percent Fibo at 2662.64 and 2653.31, the 100-day moving average.

On the upside,  2702.78, the 50 percent Fibo.   Then some clustering in a range of 2730-2755:  the 50-day at 2728..08; the 20-day at 2737.92; the 61.8 percent Fib at 2742.92; and, most important, Friday’s high at 2754.42, the new marker.

Also watch the bearish cross as the 20-day moving average trades through the 50-day, which is not far off.

A 1962-1987 Hybrid Bear Market?

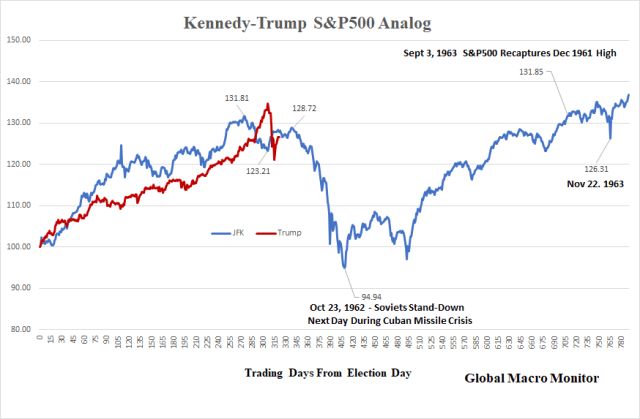
Though the S&P500 has the same theme, set-up, and backdrop as the JFK post-election rally and bear market in 1961-62,  the fundamentals drivers of the current correction are very similar to those of the 1987 rout (see above).
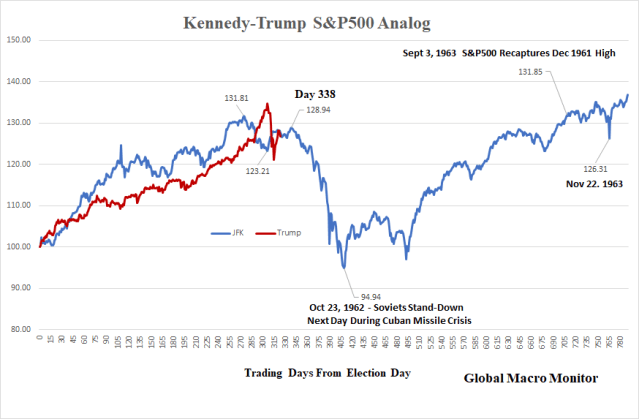
JFK_Trump_Feb21

As of today’s close,  the Trump and JFK S&P500 sit right on top of each other,  0.68 percent apart, 323 trading days after election day.

Recovery

Though the 1987 bear market bottomed the day after the crash, the S&P500 did not recover its August 25, 1987, high until July 21, 1989.   It could be sometime before the index makes a new high.  Or maybe not.

Stay tuned.

Appendix:
Economy_Feb21

Posted in Equities, Uncategorized | Tagged , , , | 21 Comments

Karl, The Comeback Kid?

Why do we think the world is about to see the resurrection of the “comrade culture club” over the next ten years?

Make no mistake; there will be a visceral political reaction to the coming acceleration of  labor disrupting technology.  We got a little taste of it in the 2016 election.

Just wait until it hits the doctoring, lawyering, and accounting class.

To take an example, COIN (contract intelligence) interprets commercial loan agreements that previously consumed 360,000 hours of lawyers’ time per year. ROSS intelligence is another example, combining a simple, Google-like search system to find up-to-date cases, law and extensive advice in seconds, by quickly sifting through databases of legal history. — marketMogul

Karl and Friedrich wrote about it over 150 years ago:

On disruptive labor destroying technology (AI and the robots are coming):

Constant revolutionizing of production, uninterrupted disturbance of all social conditions, everlasting uncertainty and agitation distinguish the bourgeois epoch from all earlier ones.  – Marx and Engels

On free-trade and globalism (protectionism on the rise):

The need of a constantly expanding market for its products chases the bourgeoisie over the whole surface of the globe. It must nestle everywhere, settle everywhere, establish connexions everywhere. – Marx and Engels

Then there are the political leanings of the millennials:

Millennials opt for socialism over capitalism

Given the choice, most Americans would opt for a capitalist country. However, one third would prefer to live in a socialist nation. Millennials are the leading force behind this preference with more than four in ten opting for socialism.  – YouGov

Socialism_Feb19

Absolutely stunning.  More than 50 percent of American millennials prefer to live in a socialist or communist country.  Can you blame them?

Debt is a happiness killer. None of us can be truly happy if we’re saddled with debt.

…At the present time, the average American household with student debt owes about $49,000. Graduates in their twenties spend more than $350 per month, on average, on student loan payments and interest. Since the average “entry-level” job was worth about $50,000 a year in 2016 for new graduates, “truly average” college grads in America can expect to see their earnings garnished by between eight and 10% for roughly ten to twelve years after they graduate. —  Forbes 

Remember Bernie?

Therein lies the spectre that will haunt the investor class over what is sure to be a tumultuous next decade.

Of course, we are not predicting America is on the verge of a communist revolution.

Nordic Capitalism Cometh

We do believe, however, if things continue as they are,  and there is not a major political and economic reset, the move to Nordic capitalism, or Nordic socialism  — call it what you will —  is a done deal in the United States.

Time To Wake Up

Look at the rising political power of the high school students over the past week, now revolting over the country’s revolting gun laws.   It feels like a watershed moment to us, and they smell it, a chance to change the culture.  They and their older brothers and sisters are the future.

Moreover,  what do you think their reaction will be when they have the epiphany the baby boomers have screwed most of them economically?

One should always be cognizant that an increase in the relative price of assets (prices to income), and housing, in particular, is generally a transfer of wealth from the younger generations to the older generations.

The $112 trillion question is what generation will take the hit?  Will it be the baby boomers as their asset prices mean revert to income or the younger generations who are forced to pay up for the overvalued assets?  Or will a leveling of the playing field take place through the political system?

We have been writing about the coming Clash of Generations for years now.

No Sugar Coating It

Our recommendation to the one percenters and the comfortably numb retired baby boomers, who have bequeathed to and saddled the younger generations with massive pension and public sector debt liabilities?

You better Wake The F&*k Up!

Posted in Economics, Politics, Uncategorized | Tagged , , | 40 Comments

Historical Ranking of U.S. Presidents

Happy Presidents Day!

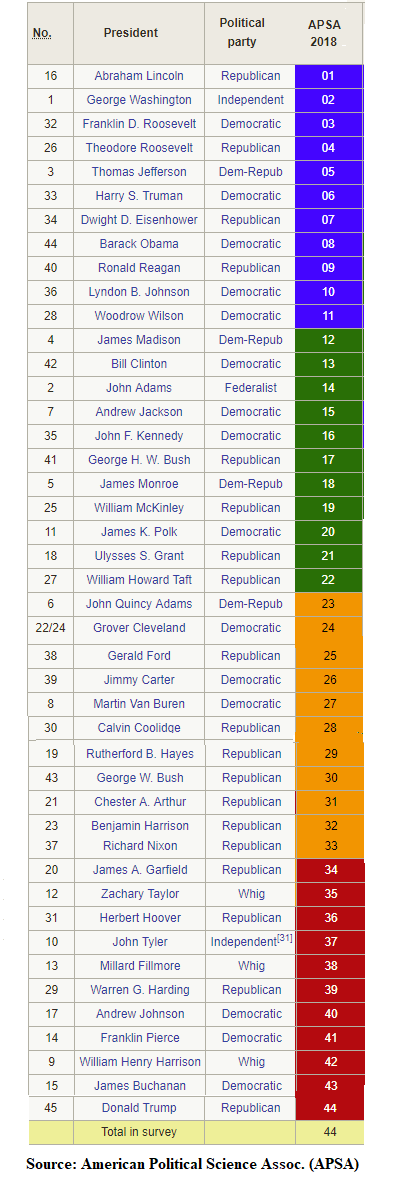
The American Presidency was one of our favorite college courses, so we find the latest survey and rankings of American presidents (colored by quartiles) always interesting.

The following table is the 2018 ranking of U.S. presidents by historians in the American Political Science Association (APSA).   Abraham Lincoln is consistently ranked numero uno in the surveys.   President Trump ranks dead last this year.  The silver lining for the current president is that there is only upside.

President Trump and Senator Hatch do need to brush up on their history, however,   Or maybe see a shrink.

During a Thursday press conference at the GOP retreat, President Donald Trump praised Senator Orrin Hatch (R-Utah) for calling him the greatest president in American history.

“Orrin is—I love listening to him speak…he actually once said I’m the greatest president in the history of our country and I said, ‘Does that include Lincoln and Washington?’ He said yes. I said, ‘I love this guy,'” 

…A spokesperson for Hatch told Newsweek that the senator “has said that he would like to work with the president to make this the greatest presidency in history for the American people.” White House spokeswoman Sarah Huckabee Sanders confirmed Trump’s statement.  – Newsweek, February 1, 2018

The historical surveys should be read with a sense of skepticism.   President Kennedy voiced his concerns for such rankings,

…Kennedy voiced his deep dissatisfaction and resentment with historians who had rated some of his predecessors. Kennedy said: “No one has a right to grade a President—even poor James Buchanan—who has not sat in his chair, examined the mail and information that came across his desk, and learned why he made his decisions”  — Wikipedia 


Presidential Rank_Feb29

See here for a matrix of presidential historical rankings over time.

Posted in President Trump, Uncategorized | Tagged , | Leave a comment

QOTD: Paul Tudor Jones

“We are in the throes of a burgeoning financial bubble.  If I had a choice between holding a U.S. Treasury bond or a hot burning coal in my hand, I would choose the coal.” – Paul Tudor Jones 

(QOTD = Quote of the Day)

Posted in Bonds, Quote of the Day | Tagged , , | Leave a comment

Week In Review – February 16

Nice bounce.

The S&P500 is up 7.88 percent off the low and has recovered 58.65 percent of its loss.  It looks like the pivot is the .618 Fibonacci retracement level, which it traded through but could not hold as the market sold off into Friday’s close.

We are still following the Kennedy-Trump analog and won’t trash it until the S&P500 closes firmly above the 2,800 level.

Interest rates seem to have stabilized and came back nicely in Germany, which provided some cover for equities to bounce.   Credit spreads are wider in February.

The dollar continued on its weak path with the index making a new low on Friday before bouncing.  Tread carefully if rates start moving higher and dollar lower.

Financial stress in the system is increasing, but note, the data is lagged by a week.

Copper and Zinc up big this week. Natural gas is, and will always be, the widow maker.


.Weekly Chart_1


Weekly Chart_2

Week_2017_ETFs

Weekly_Table


Posted in Uncategorized, Week in Review | Tagged , , , , , , , | Leave a comment

Fate of ‘Dreamers’ and US border wall in doubt – FT

Efforts to reach a US immigration deal suffered a major setback as Senate failed to approve a bipartisan plan that would have granted legal status to unauthorised immigrants known as Dreamers

► Subscribe to FT.com here:http://bit.ly/2GakujT

Posted in Economics, Uncategorized | Tagged , , | Leave a comment

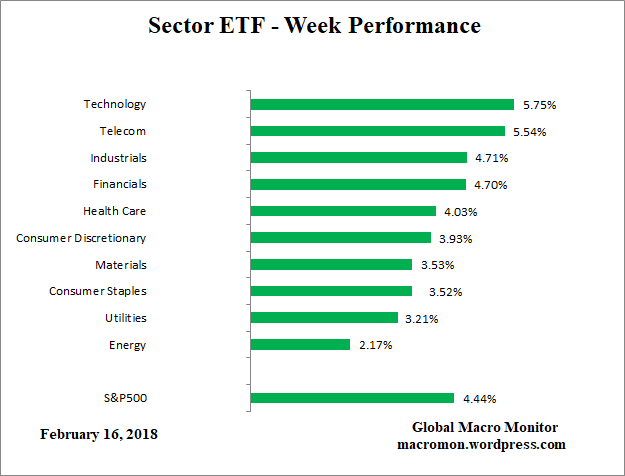
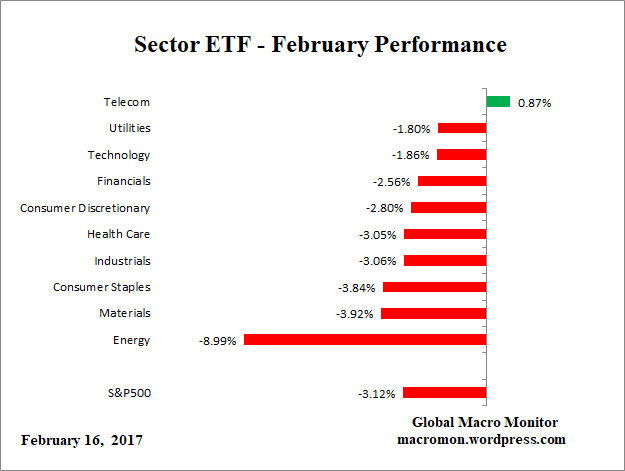
Sector ETF Performance – February 16

ETF_D

ETF_W

ETF_M

ETF_YTD

Posted in Sector ETF Peformance, Uncategorized | Tagged , | Leave a comment

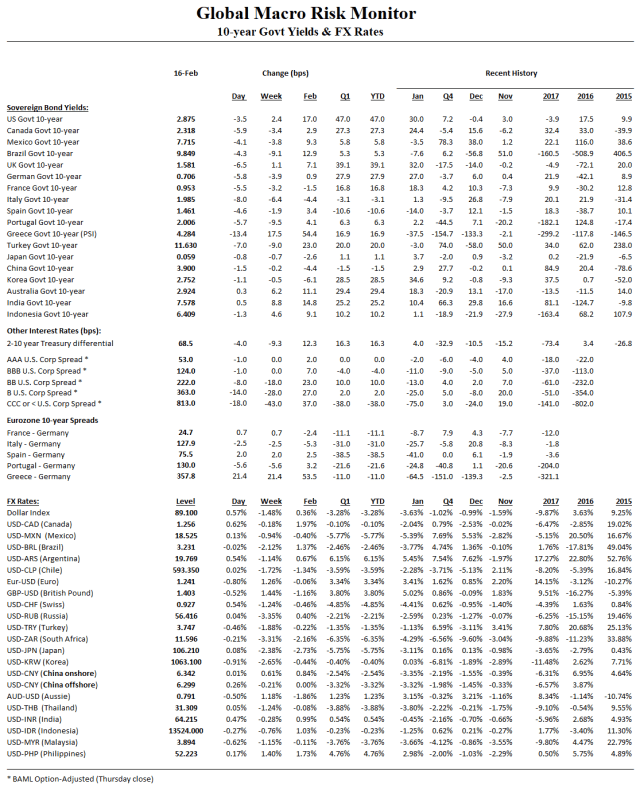
Global Risk Monitor – February 16

RiskMon_1

RiskMon_2

Posted in Daily Risk Monitor, Uncategorized | Tagged , , , , , | Leave a comment

When Algos Go Rogue

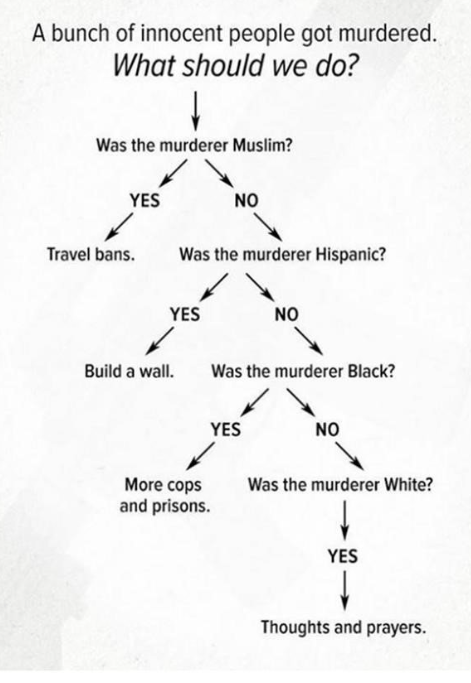
No political statement here but the following decision tree illustrates how algorithms can be biased. Note decision trees are a fundamental tool of artificial intelligence, algorithms and predictive analytics and their biases can destroy lives and even countries.

Rogue Algo_Feb16                          Hat Tip:  @ianbremmer

Algo Or Government Reaction Function 

We hope the decision tree is not the algo or reaction function of the current U.S. government and the Congressional leadership, but to use Milton Friedman’s analogy of the pool player using but not understanding the laws of physics, they act as if it is.

To illustrate this, consider Milton Friedman’s famous exposition of the as if argument. He used the analogy of a snooker player who does not know the geometry of the shots they make but behaves in close approximation to how they would if they did make the appropriate calculations. We could, therefore, model the snooker player’s game by using such equations, even though this would not strictly describe the mechanics of the game. – Unlearning Economics

It is also one reason why we are bearish on the American Street and expect political and social instability to increase in the U.S. over the next few years. The politicos are stunningly tone deaf to the mood and needs of the vast majority of the American public.   The “Swamp” is now at the elbow of  exponential growth.   Something is going to break.

We now fear the American Street more than the Arab Street.

Don’t Forget The Victims Of Florida School Shooting

Just look at the pictures and listen to stories of the kids and adults killed in the recent school shooting in Florida.  Heartbreaking.

Picture of Victim_Feb16

The reaction of the country, the victims’ families, and even the high school students that survived the shooting seems different this time.

Do you sense the rage building?  Could this be the tipping point?

The Second Amendment

We are strict constructionists in reading the U.S. Constitution here at the Global Macro Monitor.  Therefore we believe the second amendment allows for the right of every American to carry a Brown Bess, the most common musket used on both sides during the Revolutionary War, the timeframe when the Constitution was written.  Nothing more.

Brown Bess_Feb16
Assault rifles, such as the AR-15?  No f#*king way  (NFW).

On The Side Of Reagan And Scalia

We side with both President Reagan and Justice Scalia on this one.

“I do not believe in taking away the right of the citizen for sporting, for hunting and so forth, or for home defense,” he said. “But I do believe that an AK-47, a machine gun, is not a sporting weapon or needed for defense of a home.” – President Reagan

“It may be objected that if weapons that are most useful in military service — M-16 rifles and the like — may be banned, then the Second Amendment right is completely detached from the prefatory clause. But as we have said, the conception of the militia at the time of the Second Amendment’s ratification was the body of all citizens capable of military service, who would bring the sorts of lawful weapons that they possessed at home to militia duty. It may well be true today that a militia, to be as effective as militias in the 18th century, would require sophisticated arms that are highly unusual in society at large. Indeed, it may be true that no amount of small arms could be useful against modern-day bombers and tanks. But the fact that modern developments have limited the degree of fit between the prefatory clause and the protected right cannot change our interpretation of the right.” – Justice Scalia

The time, though long past, has come.

Appendix 

If you have time, make sure to watch this 12 minute video on the dangers of bias in algos and artificial intelligence.  Well worth your time.


Posted in Politics, Uncategorized | Tagged , , | Leave a comment

Lies, Damned Lies, And Statistics…And The CPI

The first three of those words are attributed to the British Prime Minister,  Benjamin Disraeli, and also sometimes associated with Mark Twain.

You know our skepticism of most government data, especially the BLS calculation of inflation in consumer goods and services.  The data are so massaged by seasonal and hedonic adjustments, and even full-blown methodological revamps when the numbers do not fit the objectives of the government, they just don’t reflect reality.

Go back to 1982 when the BLS came up with the concept of “owner’s equivalent rent (OER),” a large component of how the price of shelter is calculated in the CPI.  This was in response to the government believing rising housing prices were distorting the true cost of housing.  Houses were then recategorized as capital goods.   The data for OER are not hard,  not real world data points that can be measured,  such as egg prices.

A friend pointed out the following in today’s Wall Street Journal,

A monthly measure of what households pay for everything except gasoline and food rose a seasonally adjusted 0.349% in January—the strongest one-month increase since March 2005—driven by broad-based increases in costs like rent, clothing and medical services.  – WSJ, February 15

We wonder out loud about the 0.349 percent print.  Round it down, Charlie Brown!

Just another 0.001 percent and the BLS would have posted a core CPI monthly change of 0.4 instead of the 0.3 percent. The market response?

The headline number print of 0.5 percent was also very close to its rounding point.   Going out three more decimals, the number was .5448 percent.  Another 0.0012 percent, headline CPI prints at 0.6 percent.

Could they have?

Bureaucrats day trading (the data not securities) the monthly economic data?  The word comes down from on high not to kill Goldilocks with RoundUp?

You decide.

File this one under all things rigged and don’t cry for me, Argentina!


Posted in Inflation/Deflation, Uncategorized | Tagged , | 125 Comments