


The German chancellor’s conservative bloc and left-of-centre rivals the Social Democrats have achieved a breakthrough in exploratory talks on forming a new ‘grand coalition’
► Subscribe to FT.com here: http://bit.ly/2r8RJzM
.
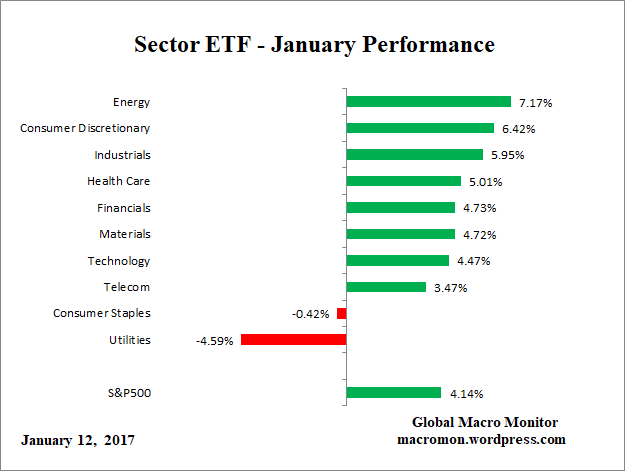
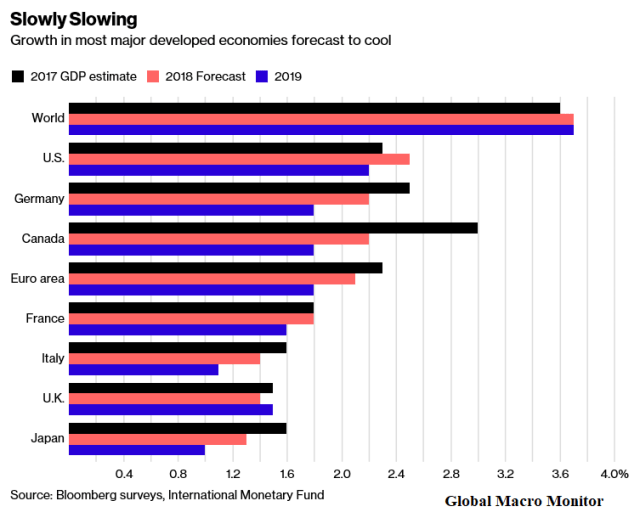
We have updated with the latest 2018 and 2019-20 average annual forecasts and ranked the world’s country 2018 GDP forecasts in our ginormous table below. The data are from the October 2017 IMF’s World Economic Outlook. The forecasts probably underestimate world growth, but we believe the ordinal ranking is fairly accurate.
Let’s begin by first checking out the G20 data.
.
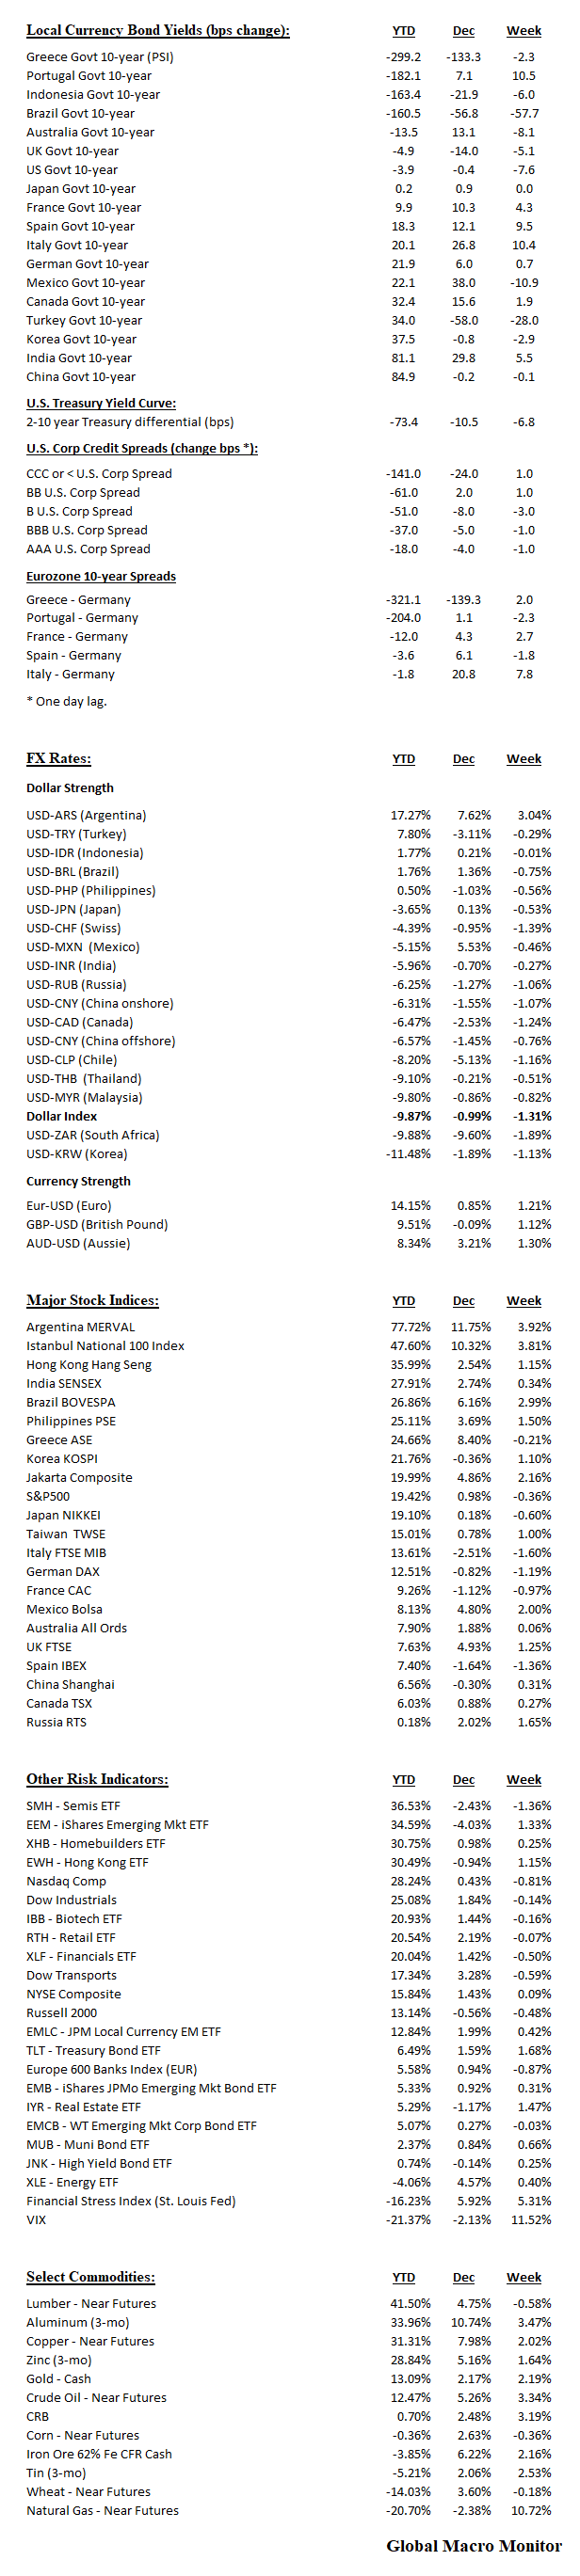
What a first week to start the year. Frothy the Snowman refuses to melt!
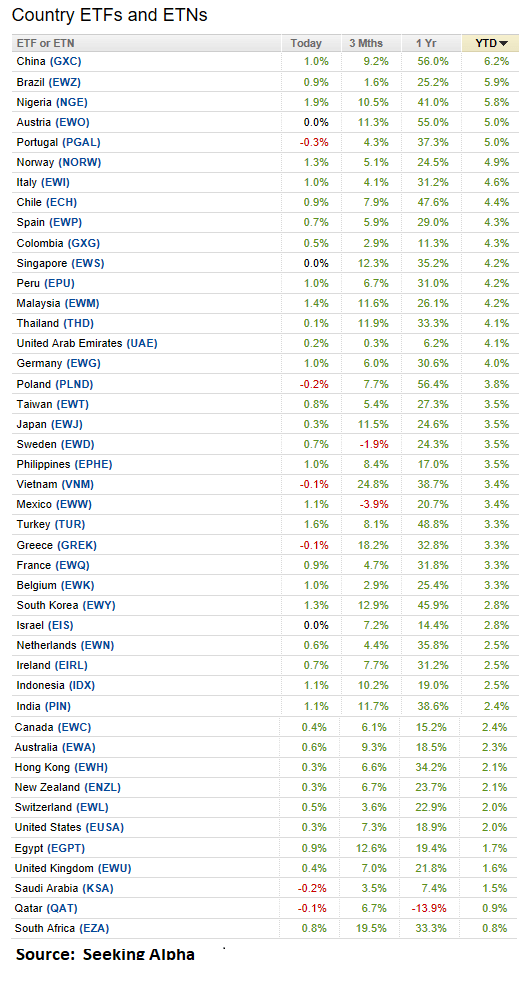
Emerging markets still all the rage.
No supply, my friends. Global markets have gone parabolic.
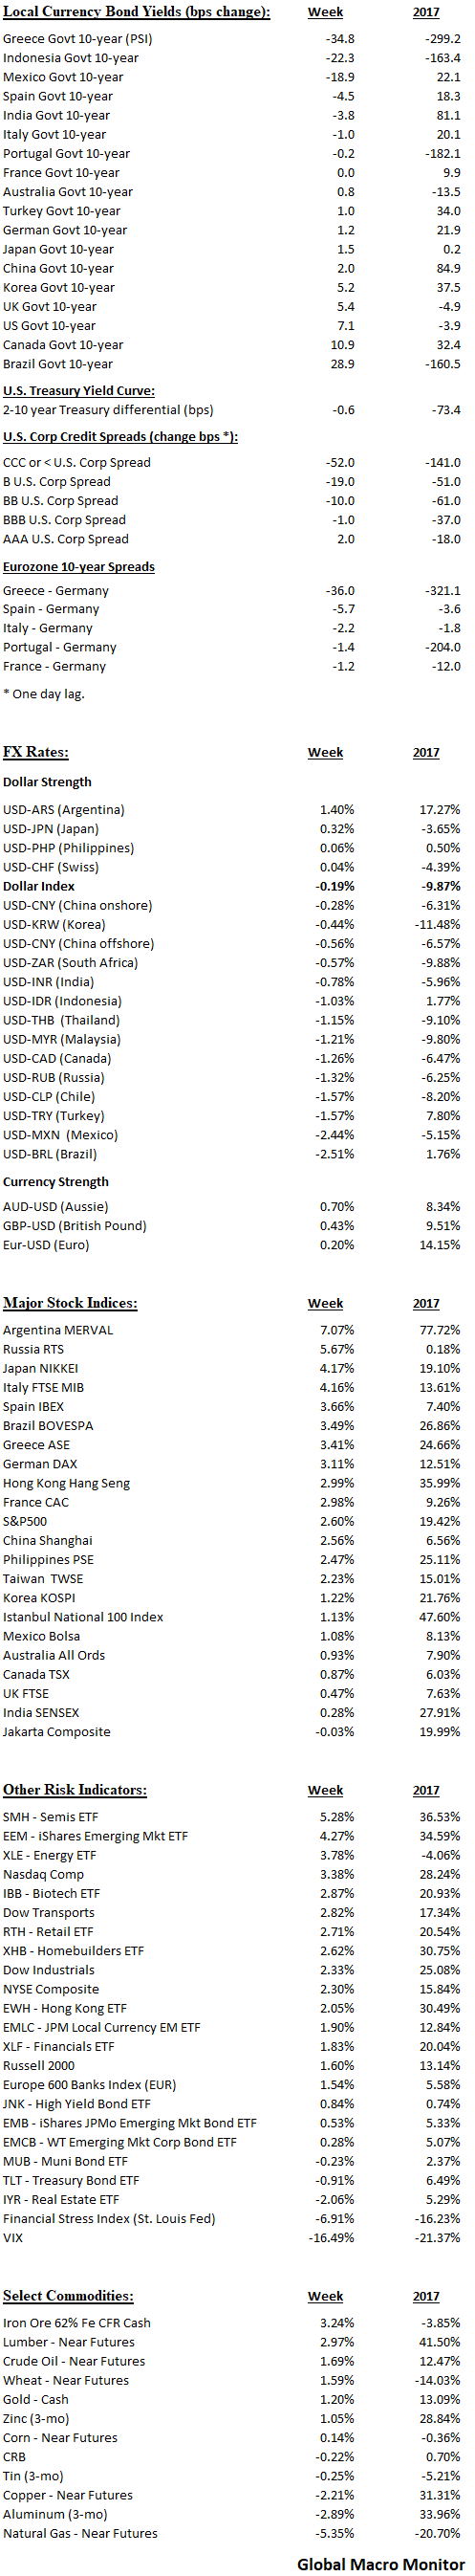
Fixed-income
– Greece bond yields hit 12-year low as the post-bailout era beckons;
– Indonesia continues to attract yield seekers;
– Mexico 10-year yields 20 bps lower. Talk of 10-year dollar bond at 160 bps.
– The dash for trash continues with CCC in over 50 bps on the week. B in 20 bps ;
– DM bond yields slightly higher. Fears of overheating starting to creep into markets.
Currency
– Dollar index relatively flat;
– EM currencies strong as capital flows continue to fly into the sector.
Stocks
– EM stocks continue to melt-up;
– Japan making 26 year highs on growth surprise. Nikkei still 40 below 1989 high.
.
Other Risk Indicators
– U.S. tech still rocking the free world;
– U.S. semiconductor ETF up another 5 percent after stellar 2017. Pass the A.I. chips, bro;
— VIX collapses again. Approaching new all-time lows.
Commodities
– Iron ore higher probably due to upward revisions to China growth;
– Gold continues to rally as Bitcoin wobbles;
– Nattie gave back some of last week’s 10 percent gain even as America freezes.

Maybe President Trump should not read this but last year was all about “Making The World Great Again.”
Financial Markets
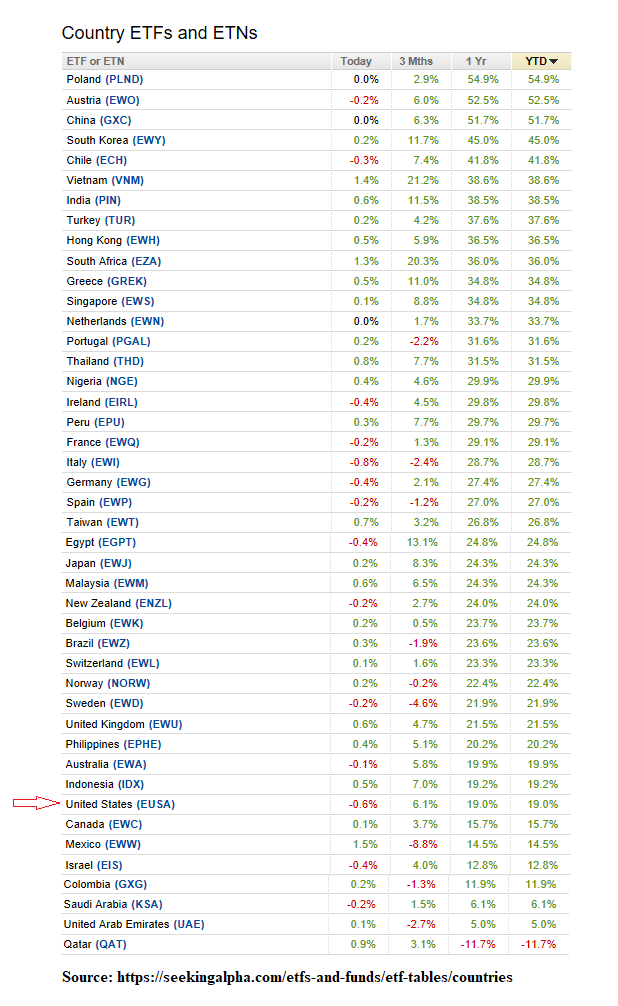
As the data and graphs illustrate below, the U.S. stock market was in the bottom quintile of performance in dollar terms. The ETF table does not include the Argentina country ETF, which was up over 53 percent in 2017.
Some of the rest or world’s outperformance was due to dollar weakness, which fell against the euro by almost 15 percent and was down against almost all G20 currencies, ex/ Argentina and Turkey, which experienced significant drops due to inflation differentials. The dollar had small gains versus Brazil and Indonesia.
Economy
Furthermore, the rest of the world’s major economies also exceeded expectations. U.S GDP growth was third among G7 countries, trailing Canada and Germany.
The U.S. economy just met expectations, however, whereas other G7 economies significantly outperformed expectations. The U.S. recovery is much more mature than most of the G7, which may explain the positive economic surprises.
Upshot
Hey, but we ain’t complaining. The U.S. markets and economy had a banner year. Hats off to those lifting the heavy lumber (up over 40 percent in 2017, BTW) to make it happen. However, keep it in a global perspective, comrades!
Let’s see what 2018 brings.
After 30 years in the markets, we have learned it usually pays to expect the unexpected. Good luck this year!

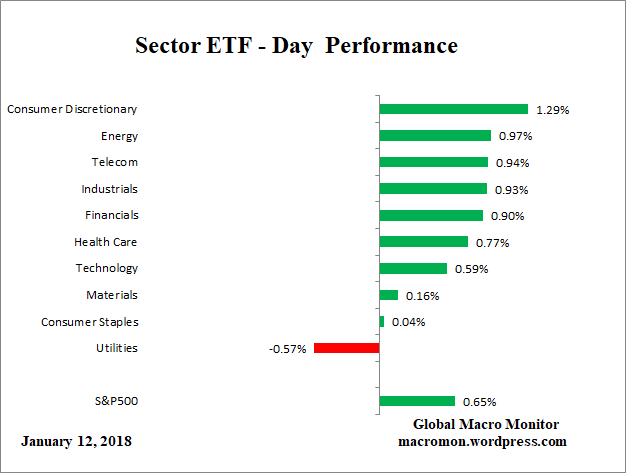
An incredible year in the markets. Here’s a quick snapshot:
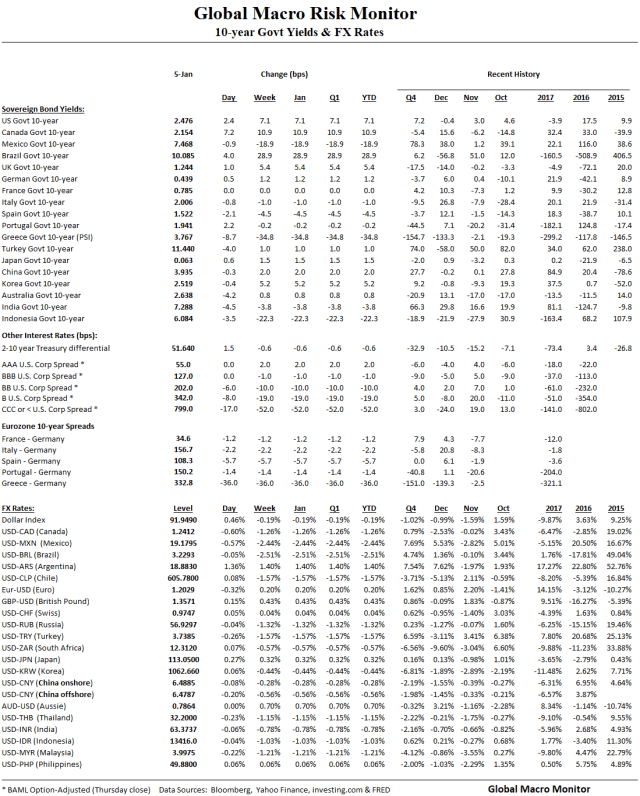
Fixed-income
– The high yielders significantly outperformed;
– Greece 10-year yield down 300 bps in 2017;
– China 10-year moved 85 bps higher to around 4 percent;
– The U.S. yield curve pancaked with the 10-2’s spread 73 bps lower;
– Junk tighter with the dash for trash outperforming. CCC in 141 bps;
– Greece and Portugal 10-year tightened bigly against the German bund;
Currency
– Dollar index down almost 10 percent;
– Euro/$ up over 14 percent;
– Dollar/Argie peso up 17 percent due to inflation differentials. Ditto for Turkish lira;
– Dollar/Korea 11 ½ percent weaker. Should relieve some protectionist pressure.
Stocks
– 2017 was the year of emerging markets catch-up trade;
– Argentina up 78 percent in local currency, over 50 percent in dollar terms;
– Hang Seng up 36 percent;
– Russia flat;
Other Risk Indicators
– 2017 was a big year for tech;
– U.S. semiconductor ETF up over 36 percent;
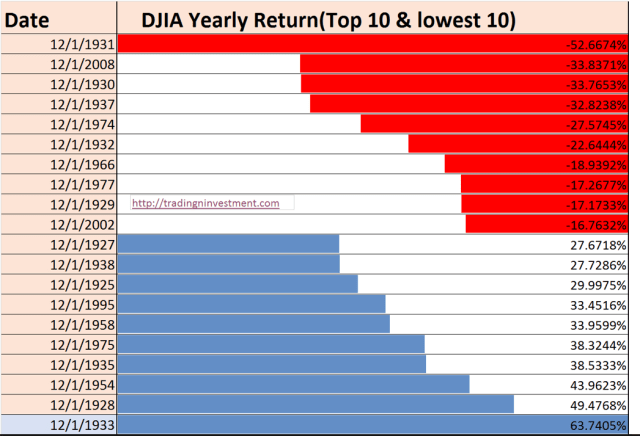
– Dow up 25 percent, almost putting in Top 10 annual return;
– Energy ETF down 4 percent even though commodity up over 10 percent;
Commodities
– Lumber futures up over 40 percent on protectionist measures and natural disasters;
– Industrial metals performed well. Copper futures up over 30 percent;
– Iron ore made a nice second-half
– Crude up 12 percent;
– Grains traded horribly;
– Natural gas regressed to mean after the big gains of 2016.