COTD: The United States of Unicorns

Key insights about the companies in this map:

  • Collectively, US unicorns are worth approximately $360B.
  • Combined, these companies have raised just over $73B.
  • After California, New York, Massachusetts, and Illinois, the next-highest unicorn populations are found in Utah (with four) and Florida (with three).
  • The top five most well-funded US unicorns are: Uber ($15.1B raised), Airbnb ($4.4B), WeWork ($2.76), Infor ($2.63B), and Lyft ($2.46B).
  • The oldest unicorn in the US is the greentech company Bloom Energy, which reached a valuation above $1B in 2009.
  • The newest unicorn in the US is 3D printing startup Desktop Metal, which became a unicorn in July 2017 after raising a $115M Series D.
  • The three most active investors in US-based unicorns, by total number of deals to these companies, are the VC firms Sequoia Capital, Andreessen Horowitz, and Tiger Global Management.   – CBINSIGHTS

Unicorns

Hat Tip:   Craig Blessing

Posted in Banking, Uncategorized | Tagged , | Leave a comment

U.S. Job Creation & Wages Over Past 7 1/2 Years

On the eve of nonfarm payrolls here is a nice data dump that gives a good roadmap of what and how many jobs have been created since 2010.   We’ll layout just the data with some bullet points and let you make your own conclusions.

  • Over 16 million nonfarm jobs have been created since the beginning of 2010, averaging 184K per month.
  • Total nonfarm payrolls will have to average 193K per month for the rest of 2017 to equal the 2.24 million jobs created in 2016.
  • 25 percent of the jobs created since in 2010 were in the Professional & Business sector, which ranks 5 on a scale of 13 in terms of average hourly earnings.
  • Almost half of the jobs – 47 percent – created over the past 7 1/2 years were at the lower end of the pay scale – Education & Healthcare (9); Leisure & Hospitality (13); and Retail Trade (12).
  • The Government, Information, and Utilities sectors lost jobs over the period.
  • The weighted average wage rank of all jobs created since 2010 is a 9 out 13 in terms of average hourly earnings.
  • Education & Healthcare top nonfarm payrolls at almost 16 percent of total employment.
  • The Ultilities and Information sector ranked the highest in average hourly earnings in June 2017 with Retail Trade and Leisure and Hospitality at the bottom.   See here for more detailed breakdown of wages by sector.
  • Information and Financial Activities experienced the strongest real wage growth over the period with the Transport and Warehouse and Manufacturing sector the weakest, with zero real wage growth.

.

Employment_Annual Change

.

Employment_Sector Percentage

.

Employment_Avg Hourly Earnings_1

.

Employment_Change in Avg Hourly Earnings

Posted in Employment, Uncategorized | Tagged , | Leave a comment

The “Dusenberry Effect” In The U.S. Economy

Just saw this chart on Zero Hedge yesterday, which takes me back to the days of graduate school and an unfinished Ph.D. dissertation.

One part of the “Dusenberry Effect” basically states that consumers do not give up their consumption patterns very easy even if their incomes decline.   They, in effect, “ratchet” down their living standard very slowly by first having a second wage earner enter the workforce as we saw in the 1970’s when women began to enter the workforce en masse and then by taking on debt to finance their previous standard of living.

…[a] significant part of Duesenberry’s relative income hypothesis is that it suggests that when income of individuals or households falls, their consumption expenditure does not fall much. This is often called a ratchet effect. This is because, according to Duesenberry, the people try to maintain their consumption at the highest level attained earlier. This is partly due to the demon­stration effect explained above. People do not want to show to their neighbours that they no longer afford to maintain their high standard of living.

Further, this is also partly due to the fact that they become accustomed to their previous higher level of consumption and it is quite hard and difficult to reduce their consumption expenditure when their income has fallen. They maintain their earlier con­sumption level by reducing their savings. Therefore, the fall in their income, as during the period of recession or depression, does not result in decrease in consumption expenditure very much as one would conclude from family budget studies.  – YourArticleLibrary

We suspect the cumulative policy decisions of bailing out debt holders and punishing savers over the past 30 years has changed attitudes on debt accumulaton.   We know several people that didn’t pay their mortgages for more than three years and were not foreclosed on.   That is just un-freaking-fair, folks!

The Rise of Tea Party

The duplicity of the policy makers and the banks gave rise too much anger thoughout the country from those who basically, “did the right thing”,  paying their bills and mortgages on time.    And was one reason for Rick Santelli’s rant in February 2009, which many atrribute to the birth of the Tea Party.

.

Dusenberry Effect

Upshot?  No wonder the country is so divided.


Posted in Economics, Uncategorized | Tagged , , | 17 Comments

Earnings Beat “Fist Pumps” Very Muted This Quarter

Stephen Gandel of Bloomberg out with a good piece this morning on:

…shares of companies that have reported both better-than-expected profits and sales for the second quarter have barely budged this earnings season. It’s the least fist-bumping investors have done for great quarters in 17 years. – Bloomberg

Is the the beginning of a catch up trade?

Stocks rose during the recent earnings recesssion through P/E multiple expansion and this just may be the market allowing fundamentals to catch up with prices.   Nah, that’s too rational.

Too much catching up to do as noted by Howard Marks comments below.

  • The S&P 500 is selling at 25 times trailing-twelve-month earnings, compared to a long-term median of 15.
  • The Shiller Cyclically Adjusted PE Ratio stands at almost 30 versus a historic median of 16.  This multiple was exceeded only in 1929 and 2000 – both clearly bubbles.
  • While the “p” in p/e ratios is high today, the “e” has probably been inflated by cost cutting, stock buybacks, and merger and acquisition activity.  Thus today’s reported valuations, while high, may actually be understated relative to underlying profits.
  • The “Buffett Yardstick” – total U.S. stock market capitalization as a percentage of GDP – is immune to company-level accounting issues (although it isn’t perfect either).  It hit a new all-time high last month of around 145, as opposed to a 1970-95 norm of about 60 and a 1995-2017 median of about 100.
  • Finally, it can be argued that even the normal historic valuations aren’t merited, since economic growth may be slower in the coming years than it was in the post-World War II period when those norms were established.
    Howard Marks

The market seems to running out of room to the upside as valuations are extremely extended and growth seems to running up against supply constraints, especally labor in the U.S..   Need some quick producitivity gains to nudge  non-inflationary economic growth higher and for equity markets to continue their impressive run.

Fits the last factor of the event risk check list of eight reasons why we expect an October sell off,  though, we are not expecting a bear market.

Bloomberg_beats

More money quotes from the Bloomberg piece:

  • To be sure, Wall Street earnings beats are always a bit manufactured. Analysts often lower their estimates toward the end of the quarter, or soon after it, only for companies to hurdle over that lower bar. On average, over the past five years, 68 percent of the companies in the S&P 500 have reported better-than expected earnings. This year the number is slightly higher at 73 percent. Despite the kabukiness of it all, investors have generally seen those positive earnings surprises as good news.
  • Through Tuesday morning, 314 of the companies in the S&P 500 have reported their earnings for the three months ended June 30. Of those, 174 had profits and sales that were better than analysts’ expectations. Yet shares of those companies were flat compared with the rest of the market in the 24 hours after they reported, according to research from strategists at Bank of America Merrill Lynch. Five days later, the same stocks performed slightly worse than the rest of the market.
  • Since 2000, shares of companies reporting better-than-expected earnings have generally risen about 1.6 percentage points more than the market on the day after they announce earnings. The last time that stocks on average failed to jump on good earnings was the second quarter of 2000, 17 years ago.
  • It’s not clear exactly why the cheers for good earnings have been muffled. Savita Subramanian, Bank of America Merrill Lynch’s top U.S. equity strategist, says it’s potentially a bad sign. Investors are overly optimistic, anticipating good news. That can be a sign of a market top. The S&P 500, for example, had not yet peaked in July 2000, even though tech stocks had already started to drop, when companies started reporting their profits for the second quarter that year. The market’s massive slide began the next month. The Dow Jones industrial average closed at a record on Tuesday.  – Bloomberg

And, finally,

Consider the big banks. Bank of America Corp., Citigroup Inc. and JPMorgan Chase & Co. reported better-than-expected earnings per share by 11 percent, 6 percent and 8 percent, respectively. Yet their shares fell on the day they announced their earnings. JPMorgan’s shares are still down slightly. One exception appears to be Apple Inc., whose shares jumped after better-than-expected earnings on Tuesday evening. –  Bloomberg

.

Bloomberg_beats_2

.

Not a compelling case to make a directional bet,  but a great piece to add to your information set.    We expect to grind higher through mid-September, which sets up for a decent October correction.   This said,  realizing market timing has been pretty much a mug’s game.


Posted in Uncategorized | 10 Comments

Watch This Space – Industrials v Transports

Not as relevant as it used to be,  but something to keep on your radar.  Transports approaching 200-day moving average at 9,117.59 (corrected on Aug. 19) and diverging from Industrials.

Dow Theory, baby!

The [Dow} theory was created by Charles Dow in the early 20th century (after whom the two indexes above are named after) and it examines the relationship between the transports and industrial averages. Simply put, it states that major trends must be confirmed by both the transports and industrials indexes. Confirmation of a trend higher sends a “buy” signal in the market; one of a trend lower sends a “sell” signal in the market. – CNBC

.

Dow Transports_Aug1

Posted in Equity, Uncategorized | Tagged , , | 1 Comment

Apple’s Revenue Growth

Interesting revenue makeup from Apple’s earnings release.

Overall revenue up 7 percent y/y;  iPhone revenue up 3 percent y/y;  and the only negative is a 10 percent y/y decline in China – sixth straight quarter down in the country.   Tim Cooke a little more upbeat on China, however.

The iPhone made up 55 percent of the company’s revenue for the quarter with services now gernerating 16 percent.

Market likes it.  Stock up over 5 percent in after hours.


Apple_Aug1

Posted in Apple, Uncategorized | Tagged | Leave a comment

QOTD: Risk

You want to take risk when others are fleeing from it, not when they’re competing with you to do so.

…But it’s precisely when people can’t see what it is that could make things turn down that risk is highest, since they tend not to price in risks they can’t see.  With the negative catalyst so elusive and the return on cash at punitive levels, people worry more about being underinvested or bearing too little risk (and thus earning too low a return in good markets) than they do about losing money.  Howard Marks

Posted in Economics, Quote of the Day, Uncategorized | Tagged | Leave a comment

July Key Takeaways

Stock Indices

  1. Emerging markets dominated stock returns in July with Turkey leading the way.
  2. India, which we stated was one our favorites at the beginning of the month continues to rip,  up over 22 percent, YTD.   This is going to be a spectacular bull market.   Everything lined up – demographics,  lots of inefficiencies to be improved,  much room for policy improvement.
  3. The S&P500 continues to defy seasonality and move higher.   We expect a correction in October as many stock negative forces will be converging by then.
  4. The German DAX hit by stronger euro currency.


Month_Stocks

Local Currency Fixed-Income

  1. Brazil 10-year rates continue to move lower,  now down about 140 bps on the year.
  2. U.S. 10-year flat.
  3. Indonesia and Canada rates moving higher with oil prices.
  4. Little change in U.S. yield curve.


Month_Fixed Income

Currencies

  1.  Dollar weak on the month, with index approaching key and critical support at 92.  It is very over sold and non-commercial longest euro position since 2011, just months before the Eurozone almost melted down.   We think it bounces here but keep it on a tight leash.   Dollar slumping with Trump and with the Genaral taking charge of White House,  confidence may be somewhat restored.   Nevertheless, plan on gettting short on a close below 92.
  2. Aussie, commodity currencies,  and Euro ripping higher.
  3. Global capital flows like 10 plus 10-year interest rate in Brazil, moving currency higher.
  4. Super Mario may be getting concerned about higher Euro.  Look for some talk down.


Month_FX

Other Risk Indicators

  1. Reflation trades picking up with weaker dollar
  2. Iron ore up big on the month.  We posted it looked like it bottomed last month.  A sign “old China” is reaccelerating.
  3. Ags, mainly wheat, giving some gains back.
  4. Energy stocks lagging the commodity higher
  5. We may be talking about higher cyclical inflation in the fall as markets and analysts continue to obsess over deflation.  Blah, blah, blah!


Month_Other

Posted in Uncategorized | Leave a comment

No Worries: Vol Not Priced For Budget Ceiling

Do the markets price risk anymore?   That it is always inevitable when the world is awash with central bank based liquidity is not a surprise.

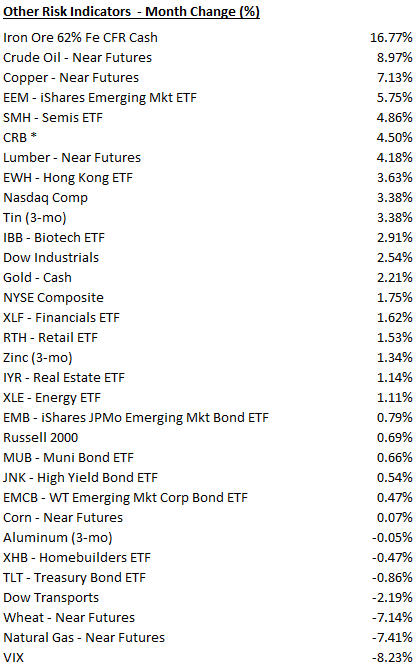
We do see the VIX creeping back over 10 after trading with 8 handle for its only second time in history last Wednesday.

Just as with about everything else, with the exception of crude, which now seems to be pricing in some geopolitical risk,  very few markets are pricing for potential political or geopolitical shocks.

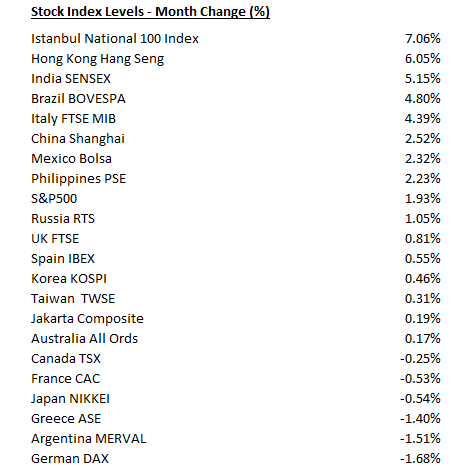
See our post,  No Worries In South Korean Markets,  with their currency and stock market ripping higher this year all while missilies fly up north.   The KOSPI did fall almost 2 percent on Friday,  however.

Non-worries over a budget debacle are quite understandable, however,  since the conflict always seems to work itself out, especially now we have one party rule.

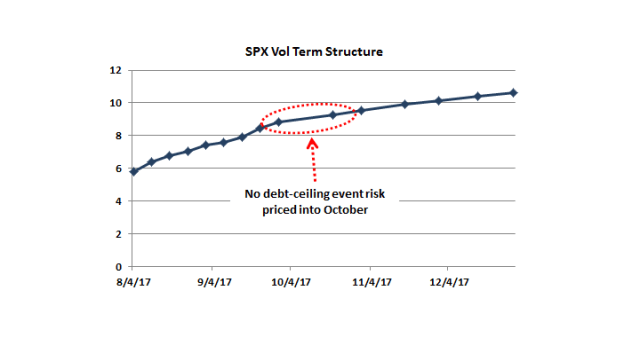
Here is Credit Suisse,

There is “no event risk” currently priced in options that allow investors to hedge against or speculate over potential volatility on the S&P 500, the main US equities barometer, according to Mandy Xu, derivatives strategist at Credit Suisse. 

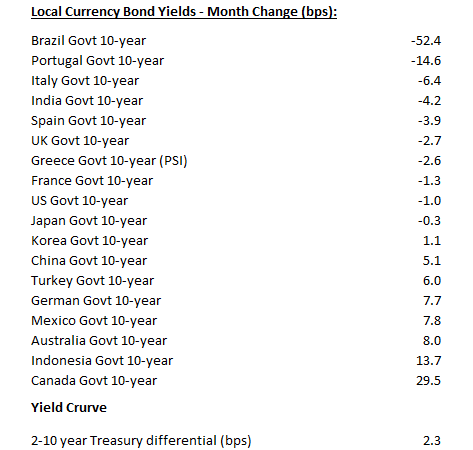
…The tranquility in equities presents something of a juxtaposition to fixed income, where jitters have risen in a portion of the US Treasuries market. – FT

SPX Vol_July31

We are expecting several stock negative forces to converge in October, which, we believe, will generate a market sell-off as stocks continue to march higher the rest of the summer adding to their already overextended valuations.

1) seasonality; 2) the Fed balance sheet should, or could be shrinking ; 3) China’s Party Congress may have concluded, removing the country’s implicit policy put, and thus increasing the risk of a China policy or economic shock; 4) the new U.S. Federal government fiscal year begins October 1 and if the Trump administration has not passed any significant economic legislation, the markets may begin to throw in the towel; 5) there will be more clarity on ECB tapering; 6) even more elevated asset prices as the risk markets grind higher through the rest of summer as we suspect, setting up for a potential blow-off by the end of September; 7) nervousness over the debt ceiling; and, finally, 8) by then, the souffle now being baked and puffed up by the markets should barely be able to withstand the slamming of the oven door.  – GMM

Stay tuned.

Posted in Equities, Fiscal Policy, Uncategorized | Tagged , , | 6 Comments

The “Firming” Global Recovery

The IMF upgraded their view of the global economy, while slightly downgrading U.S. economic growth due to lack of fiscal progress.

The Global Economy Maintains Momentum

The cyclical recovery continues. Growth outturns in the first quarter of 2017 were higher than the April WEO forecasts in large emerging and developing economies such as Brazil, China, and Mexico, and in several advanced economies including Canada, France, Germany, Italy, and Spain. High-frequency indicators for the second quarter provide signs of continued strengthening of global activity. Specifically, growth in global trade and industrial production remained well above 2015–16 rates despite retreating from the very strong pace registered in late 2016 and early 2017. Purchasing managers’ indices (PMIs) signal sustained strength ahead in manufacturing and services.

  • The pickup in global growth anticipated in the April World Economic Outlook remains on track, with global output projected to grow by 3.5 percent in 2017 and 3.6 percent in 2018. The unchanged global growth projections mask somewhat different contributions at the country level. U.S. growth projections are lower than in April, primarily reflecting the assumption that fiscal policy will be less expansionary going forward than previously anticipated. Growth has been revised up for Japan and especially the euro area, where positive surprises to activity in late 2016 and early 2017 point to solid momentum. China’s growth projections have also been revised up, reflecting a strong first quarter of 2017 and expectations of continued fiscal support. Inflation in advanced economies remains subdued and generally below targets; it has also been declining in several emerging economies, such as Brazil, India, and Russia.
  • While risks around the global growth forecast appear broadly balanced in the near term, they remain skewed to the downside over the medium term. On the upside, the cyclical rebound could be stronger and more sustained in Europe, where political risk has diminished. On the downside, rich market valuations and very low volatility in an environment of high policy uncertainty raise the likelihood of a market correction, which could dampen growth and confidence. The more supportive policy tilt in China, especially strong credit growth, comes with rising downside risks to medium-term growth. Monetary policy normalization in some advanced economies, notably the United States, could trigger a faster-than-anticipated tightening in global financial conditions. And other risks discussed in the April 2017 WEO, including a turn toward inward-looking policies and geopolitical risks, remain salient.
  • Projected global growth rates for 2017–18, though higher than the 3.2 percent estimated for 2016, are below pre-crisis averages, especially for most advanced economies and for commodity-exporting emerging and developing economies. Among the former, many face excess capacity as well as headwinds to potential growth from aging populations, weak investment, and slowly advancing productivity. In view of weak core inflation and muted wage pressures, policy settings should remain consistent with lifting inflation expectations in line with targets, closing output gaps, and—where appropriate—external rebalancing. Reforms to boost potential output are of the essence, and slow aggregate output growth makes it even more important that gains are shared widely across the income distribution. Financial stability risks need close monitoring in many emerging economies. Commodity exporters should continue adjusting to lower revenues, while diversifying their sources of growth over time.

.

IMF_Firming Global Recovery

Posted in Economics, Uncategorized | Tagged , , | Leave a comment