Week In Review

Global Stocks

Flat week for the S&P500 after making new all-time earlier in the week although the Dow continues to make record highs.  Nasdaq also new record early in week then  succumbed to profit taking on Thursday and Friday.   India, one of our favorite EM’s continues to perform well.  Greece weak, closing down over 3 percent after profit taking.  Greece up almost 30 percent YTD.


Week_Stocks

Fixed Income

Fairly quiet week for local currency bonds.   Interest rates up slighly on week with biggest move in Canada – + 14.3 bps.   U.S. yield curve steeper by 4 1/2 bps.


Week_Bonds

Currencies

Dollar index continues to slide toward the key 92 critical level,  after what was percieved as a dovish FOMC statement.   Pound, Aussie, Euro, and Canada pairs versus dollar all strong.  China strengthening.   Mexico gave a little back after its YTD rip.


Week_Currencies

Other Risk Indicators

After trading with 8 handle for only its second time in history,  the volatility index increased to close over 10 for the week.   The Dow Transports sold off hard, down over  2 1/2 percent.   Inflation commodities picked up strength with CRB up over 3 percent.  Crude up almost 10 percent and Copper up 5 percent.   Iron Ore looks like it has turned and was up almost 3 pecent.


Week_Others


Posted in Uncategorized, Week in Review | Tagged , , , , | Leave a comment

US Sector ETF Performance – July 28

ETF_DETF_WeekETF_MonthETF_YTD

Posted in Sector ETF Peformance, Uncategorized | Tagged , | Leave a comment

Global Risk Monitor – July 28

Posted in Daily Risk Monitor, Uncategorized | Tagged , , , , , | Leave a comment

COTD: “Easy Financial Conditions”

You heard it here first, folks, in our July 16th post,  Market Liquidity Conditions Still Loose As A Goose.

Here is Bloomberg on the easy money,

Easier financial conditions affect the Fed in three ways. First, officials will associate them with faster economic growth. But they don’t want so much growth that the unemployment rate falls too far below the natural rate. At the current pace of job growth, that seems likely.

Second, some members will associate easier financial conditions with financial instability. The dynamics of the last two cycles leave them wary of recreating the same conditions a third time. They will worry that halting the current path of monetary policy only sets the stage for more froth in financial markets down the road — markets that Yellen has already called “somewhat rich.”

Third, a falling dollar is contributing to easier financial conditions. The Fed will see that as another reason to expect their inflation forecasts to become reality after the impact of the recent “special factors” restraining consumer prices fade.  –  Bloomberg

.

Financial Condidtions_July27

(COTD = Chart of the Day)

Posted in Monetary Policy, Uncategorized | Tagged , | Leave a comment

QOTD: AI And China

China recognizes that AI will be critical to its future “comprehensive national power”The Diplomat

Posted in China, Technology, Uncategorized | Tagged , | Leave a comment

Dollar Index Spanked After FOMC – Nears Key Support

The Dollar Index was spanked today after what the market percieved as a dovish FOMC statement.    Kind of odd as early inflation indicators starting to pick up.

We were expecting a short-term rally as everyone is long the euro/dollar pair, i.e., short the dollar (see chart below), and as the weights listed below illustrate the Dollar Index is essentially a euro trade.   If 92 holds,  the Dollar Index may still be set for a short-term rally.

In fact, the non-commercials haven’t been this long the euro/dollar since 2011, just a few months before the Eurozone almost melted down.

Watch 91.919, the May 2016 low, which is about 1.6 percent lower.  If that breaks, the weekly and monthly chart show little support until the 80 level.   Ouch!  That will get Super Mario’s attention and we doubt he will allow it to get there.   We think a 1.18 euro/dollar is pretty close to his threshold of pain and it’s currently just about there.

Also, note,  at the beginning of the year the dollar was overvalued, to the extreme,  on a purchasing power parity basis across almost every currency in the world.

We know how President Trump feels about weak currencies that contribute to bilateral U.S. trade deficits .

U.S. Dollar Index

It is a weighted geometric mean of the dollar’s value relative to other select currencies:

  • Euro (EUR), 57.6% weight
  • Japanese yen (JPY) 13.6% weight
  • Pound sterling (GBP), 11.9% weight
  • Canadian dollar (CAD), 9.1% weight
  • Swedish krona (SEK), 4.2% weight
  • Swiss franc (CHF) 3.6% weight

Wikipedia

Dollar_July26Dollar_2_July26

.

CFTC_EuroFX

Posted in Dollar, Uncategorized | Tagged , , | Leave a comment

This Rhyme Is Different: Base Money > M1

“History doesn’t repeat itself but it often rhymes.” –  Mark Twain (maybe)

We have been speaking a lot about how the liquidity in the market today is different than in the past.   The chart below reflects this better than anything we have seen.

M1_Monetary Base

The monetary base in the U.S. has exceeded M1,  the most narrow definiton of money,  since the financial crisis.   The monetary base consists of money in circulation and reserves held at the Fed (see definition below).

The M1 money multiplier is still less than one, which reflects that for every dollar created by the Fed – an increase in the monetary base – results in a less than one dollar increase in the money supply (M1).   Credit and deposit creation of commercial banks  is thus still impaired, though improving and its repairment may be one reason why the Fed is a bit nervous and in tightening mode.

Watch This Space

A rapid turnaround and improvement in the money multiplier, which may be also be reflected in improving bank net interest margins and growing balance sheets,  could act as an early indicator of potential inflationary pressures and a flag that the massive amount of high powered money in the financial system is being converted to credit based money.

The Fed is therefore walking a tightrope of an unstable equilibrium with inflation on one side and deflation on the other, especially if your main policy tool is to pay interest on a large portion of that high powered money.   This, as the markets become increasingly convinced the global economy is now in a “Goldilocks” scenario,  justifying extreme asset valuations and the record low volatility.

Note, the secular decline in the money multiplier, which reflects many factors,  including the almost irrelevance of M1,  foreign capital flows, financial innovation, technology and the rise of non-bank banks.   For example,  private direct lending is all the rage now with hedge funds and other non-bank banks.

Different Kind of Liquidity

The above  illustrates why we are in a period of mainly central bank based liquidity rather than credit based liquidity — which can evaporate almost over night with, say,  a financial or economic  shock — as it did in 2008.

Upshot?  It’s all up to the central banks, mainly the Fed and ECB, and when markets perceive it matters that they are removing money/liquidity from the system.  And there is a lot of it out there, folks.   Flooding the reservoirs with nowhere to go but to overflow into the asset and financial markets.

The stock of reserves in the financial system are what matter now (the Fed’s position), but flows will dominate when the market perceives they are approaching drought level conditions.

There is also a tipping point policy interest rate that will bite the economy and destabilize the markets, but we believe that is at least 100-200 basis points higher.  After all,

“John Bull can stand many things, but he cannot stand 2.0 , [-1.5 or 1.25] percent”Bagehot

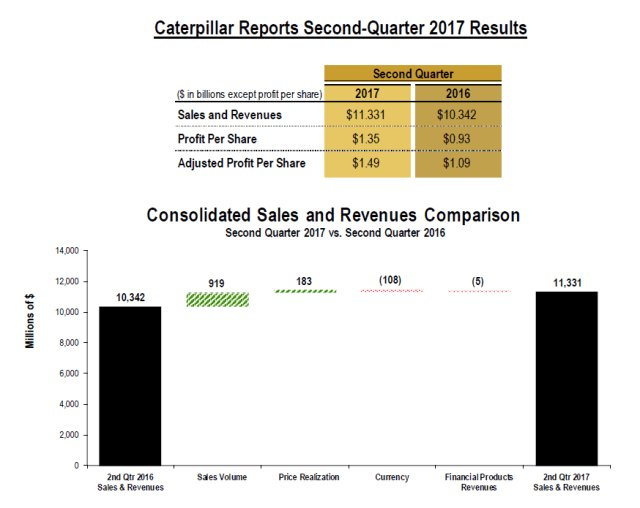
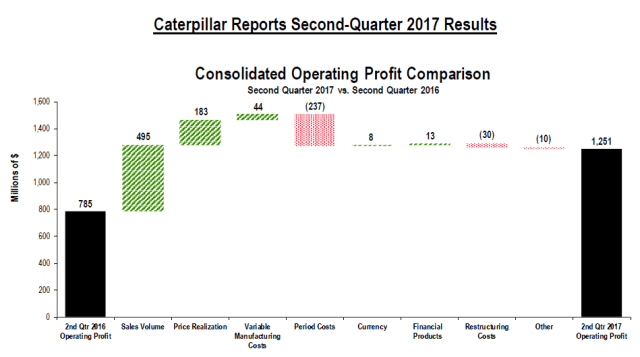
Maybe Caterpillar’s earnings release this morning reflects that the excess liquidity is starting to kick into the global economy.   Take a look at Dr. Copper breaking out to a two-year high  today,  though is doesn’t take much copper to write an AI program, does it?

In additon, the future trajectory of the economy and risk markets are also dependent on how and how much credit, liquidity, and “money” —  economists can’t even agree on what is money — are now being created.   Good luck measuring that.

Markets are acting as if  “money” is far from “tight” or nowhere close to getting there.  And central banks are too nervous to tighten up monetary conditions to any significant level.

That, in our opinion, is another reason why volatility is breaking to record lows and risk markets are so elevated experiencing only just very shallow pullbacks.   And it can, and is, lasting longer than many have expected.

October Correction Is Our Best Guess

We are are waiting for Mr. October to step up and knock the risk markets for a loop, however, resulting in a nice fall correction (pun intended).  We believe many factors will be converging  by then, including:

1) seasonality;  2) the Fed balance sheet should, or could be shrinking ;  3) China’s Party Congress may have concluded, removing the country’s  implicit policy put, and thus increasing the risk of a China policy or economic shock;  4) the new U.S. Federal government fiscal year begins October 1 and if the Trump administration has not passed any significant economic legislation, the markets may begin to throw in the towel;  5) there will be more clarity on ECB tapering; 6) even more elevated asset prices as the risk markets grind higher through the rest of summer as we suspect, setting up for a potential blow-off by the end of September;  7) nervousness over the debt ceiling;  and, finally,  8) by then, the souffle now being baked and puffed up by the markets should barely be able to withstand the slamming of the oven door.

Will it kill the bull?   Not until monetary conditions tighten up significantly in our opinion, and the Fed believes the economy can survive a prolonged bear or sideways market,  which probably won’t happen unless John Taylor replaces Janet Yellen.

Central banks now, not even with the undercover of, say, a plunge protection team,  buy equities outright  if they think it will help stimulate aggregate demand.   The Bank of Japan is now set to become the number one shareholder in 55 of the Nikkei 225 companies  How did we ever get to this place?

A Caveat:  Difficulty of Fully Understanding The Global Monetary System

Trying to understand the global monetary system,  a black box, in our opinion,  is similar to watching shadow puppets dancing on the side of the wall of a cave or seeing through a glass darkly.

The monetary system is too complex and too dynamic for you to understand it all. So it’s better to understand enough that you can be competent, but not so much that you become a danger to yourself.  – Cullen Roche

A good friend of mine and great economist,  David Herstle Jones,  describes the execution of monetary policy as,

“…driving on a narrow mountain road in the fog.”  – DHJ

Good luck.

Appendix:

M1 Money Supply

M1 includes funds that are readily accessible for spending. M1 consists of: (1) currency outside the U.S. Treasury, Federal Reserve Banks, and the vaults of depository institutions; (2) traveler’s checks of non bank issuers; (3) demand deposits; and (4) other checkable deposits (OCDs), which consist primarily of negotiable order of withdrawal (NOW) accounts at depository institutions and credit union share draft accounts. Seasonally adjusted M1 is calculated by summing currency, traveler’s checks, demand deposits, and OCDs, each seasonally adjusted separately.  – St. Louis Fed,  FRED

Monetary Base

The Adjusted Monetary Base is the sum of currency (including coin) in circulation outside Federal Reserve Banks and the U.S. Treasury, plus deposits held by depository institutions at Federal Reserve Banks. These data are adjusted for the effects of changes in statutory reserve requirements on the quantity of base money held by depositories.
– St. Louis Fed,  FRED

Money Multiplier

The M1 multiplier is the ratio of M1 to the St. Louis Adjusted Monetary Base. For further information on monetary aggregates, please refer to the Definitions, Notes, and Sources at http://research.stlouisfed.org/publications/mt/.  – St. Louis Fed,  FRED


Posted in Economics | Tagged , , , | 23 Comments

Caterpillar Beats For All The Right Reasons

Caterpillar, a bellwether for the global economy,   beat on both the top and bottom line for all the right reasons (increase in sales and revenues) with their earnings release this morning.  The stock is up over 5 percent at 11 AM eastern.   Revenues were up 9.6 percent y/y with decent growth in all geographical regions — x/ Middle East (flat) — especially China.

Money excerpts from the release:

CAT_IntroCAT_1CAT_2CAT_RegionsCAT_Outlook

Posted in Earnings, Uncategorized | Tagged , , | 3 Comments

No Worries In The South Korean Markets

We have been writing a lot these days about how crude oil is not pricing any geopolitical risk of a very messy Middle East.  See here and here.

That’s nothing, however,  compared to the performance of the South Korean stock market and currency, year-to-date,  given the geopolitical risk of the many North Korean missile tests fired off in the first seven months of 2017 (see timeline below).    The KOSPI stock index is up 21 percent and the currency has strengthened a little over 7 1/2 percent against the dollar.

Oh, by the way,  Korea also impeached and removed their president earlier this year,  had a presidential election, and has also been put on a currency manipulation monitoring list by the US Treasury.

Although Korea has not been designated as a currency manipulator, the country continues to be on the US Treasury’s watch list. The Treasury Department’s semiannual report released in April said the country hits two of the three criteria to be considered an official currency manipulator. The Treasury said it was urging Korea to increase its exchange rate flexibility and that it will be closely monitoring its currency intervention practices. – The Korea Herald

Is this the definition of  “climbing a wall of worries”,  complacency,  or just a bullet proof bull market?   We vote for capital flows seeking emerging markets.

Korea_Kospi

.

Korea_Won

2017 Timeline of North Korean Missile Tests

  • 2017 – North Korea test-fired a Pukguksong-2 missile over the Sea of Japan. This was the first launch of the new medium-range ballistic missile (Feb 11, 2017).
  • 2017 – North Korea launches four ballistic missiles from the Tongchang-ri launch site in the northwest.  Some flew 620 mi (1,000 km) before falling into the Sea of Japan. (March 6, 2017)
  • 2017 – North Korea test-fired a medium-range ballistic missile from its eastern port of Sinpo into the Sea of Japan (April 4, 2017)
  • 2017 – North Korea test-fired an unidentified land-based missile from the naval base in Sinpo but it exploded almost immediately after the takeoff (April 15, 2017).
  • 2017 – North Korea test-fired an unidentified missile from Pukchang airfield (April 28, 2017).  Missile, believed to be a medium-range KN-17 ballistic missile, falters and breaks apart minutes after liftoff.
  • 2017 – North Korea test-fired a Hwasong-12 missile from a test site in the area of Kusong (May 13, 2017).  The missile,  later revealed to be an intermediate range ballistic missile, traveled 30 minutes, reached an altitude of more than 2,111.5 km, and flew a horizontal distance of 789 km (489 miles), before falling into the Sea of Japan.  Such a missile would have a range of at least 4,000, reaching Guam, to 6,000 km.
  • 2017- North Korea test-fired another Pukguksong-2 medium-range ballistic missile from Pukchang airfield (May 21, 2017), which traveled approximately 300 miles before falling into the Sea of Japan.  The missile landed about 217 miles from North Korea’s east coast. 
  • 2017 – North Korea Fired a Short Range Ballistic Missile into the Sea of Japan (May 29, 2017). It traveled 450 km.
  • 2017 – North Korea fired several missiles into the Sea of Japan (June 8, 2017). They are believed to be anti-ship missiles. The South Korean military said the launches show the reclusive regime’s “precise targeting capability.”
  • 2017 – North Korea tested a new rocket engine that could possibly be fitted to an intercontinental ballistic missile (June 23, 2017).
  • 2017 – North Korea tested its first intercontinental ballistic missile named Hwasong-14 on July 4.  It launched from the Panghyon Aircraft Factory 8 km southeast of Panghyon Airport.  It was aimed straight up at a lofted trajectory and reached more than 2,500 km into space. It landed 37 minutes later, more than 930 km from its launch site,  into Japan’s exclusive economic zone.  Aiming long, the missile would have traveled 7,000-8,000 km or more, reaching Alaska, Hawaii, and maybe Seattle.  Its operational range would be farther, bringing a 500 kg payload to targets in most of the contiguous United States 9,700 km away.  – Wikipedia
Posted in Geopolitical, Uncategorized | Tagged , , , | 5 Comments