Dollar Index & Mexican Peso Dancing To The Same Tune

What tune is that?   The Trump slump.

Even though the Euro makes up almost 58 percent of the dollar index,  the dollar is going down  for the very same reasons the Mexican peso is going up.   The poor start or pretty much non-existence of President Trump’s economic agenda and his weakening poll numbers.

Recall that the Mexican peso, at one point, became a real time gauge of the political chances of then candidate Trump.   Hardline NAFTA  and “The Wall” rhetoric is no longer as the U.S. political class now obsesses and is pretty much paralyzed by Russiagate.

We didn’t expect such a weak start for the Trump administration and thought the dollar would break out and challenge the 120 level in the first few years of the administration as expansionary fiscal policy, higher relative policy rates coupled with corporate tax reform would increase the U.S. growth and interest rate differentials with the rest of the world.   It still might.

It’s moving in the wrong direction, and fast, however,  and talk of a potential constitutional crisis in the U.S. is not helping dollar sentiment.

Any political turn around or passage of a major piece of President Trump’s economic agenda we expect will result in massive short covering  in the dollar.  Let’s see  if “the Mooch” can work some political magic and turn things a bit for the White House.

Will that happen sometime soon?  Your guess is as good as ours, but, we note here, currencies tend to trend.  Until they don’t.

Dollar Index_Peso

Both the dollar index and dollar/peso started the year with very overbought conditions.  The dollar index hit its high of 103.82 on January 3rd and has since fallen 9.60 percent and the dollar/peso made its top at 22.033 on January 19th and is now down 19.91 percent.

The 92 level is a very important and critical long-term support area for the dollar index.  If that doesn’t hold, look out below.   Nevertheless, we are expecting a nice short-term bounce right around here.   Could be wrong.

Cyclical Versus Secular

It is also worth mentioning that in terms of  purchasing power parity (PPP), which is a longer term currency valuation measure, almost all the world’s currencies ended last year undervalued against the dollar.   It is important to distinguish between the cyclical versus secular forces driving the dollar.

.

PPP

Posted in Currency, Dollar, Uncategorized | Tagged , | Leave a comment

COTD: Guess Who Is Growing And Who Is Not?

We will give you a hint:

…credit is the mother’s milk of growth; without credit the economy cannot flourish. And credit cannot flow freely without a well-functioning financial system. – Mark Zandi

But as Japan and the others illustrate, there’s always a hangover and hell to pay after a private sector debt binge.

How and when will it end for the Middle Opaque Kingdom?

COTD_Total Credit


Posted in Debt, Uncategorized | Tagged , , , , | Leave a comment

US Sector ETF Performance – July 21

ETF_DETF_WeekETF_MonthETF_YTD

Posted in Sector ETF Peformance, Uncategorized | Tagged | Leave a comment

Global Risk Monitor – July 21

RiskMon_1RiskMon_2RiskMon_3
Posted in Daily Risk Monitor, Uncategorized | Tagged , , , , , | Leave a comment

COTD: Amazon Eating Retail

COTD_Amazon

(COTD = Chart of the Day)

It’s important to note that Amazon still only boasts a 5 percent share of total retail sales, excluding food, across the country, according to data from the U.S. Census Bureau, Sanderson said. – CNBC


Posted in Economics, Equity, Uncategorized | Tagged , , | 3 Comments

Did Janet Yellen Hear Us?

In our piece, Reflexivity And Why The Fed Must Sell The Long End, posted on June 13th,  we warned of the dangers of a flattening yield curve based on distorted interest rates due to QE.

..some still look to the badly distorted bond market as a signal of the health of the economy and act accordingly.   Such as delaying capital spending;  becoming more risk averse;  and cutting back on consumption, for example.

A flatter yeld curve also makes bank lending less profitable.

This could thus lead to what George Soros calls “reflexivity“,  a feedback loop where the negative, but false, signal from the bond market actually causes an economic slowdown or leads to a recession.   So much for efficient markets.

Recall the famous line of one prominent market strategist during the dark days of the great recession,

“ We’re in a depression. That is what the bond market is telling us.”

Or the ubiquitous,  “what is the bond market telling us?”    Come on, man! – GMM

FED Will Mind The Yield Curve

In her Congressional testimoney last week,  Janet Yellen stated the FOMC will “mind the yield curve” as they begin their quantitative tightening (QT).

Federal Reserve Chairwoman Janet Yellen on Thursday said the central bank would consider the bond market yield curve as it slowly reduces its $4.5 trillion balance sheet, which it had used to help stimulate the economy.

…“Now, we think that our purchases of assets did have some positive effect in depressing longer-term interest rates relative to short-term interest rates. But of course we will take that into effect, namely a steepening of the yield curve, in how we set the federal funds rate, which I hope will remain our primary tool for adjusting the stance of monetary policy.” – MarketWatch

No, we really don’t think we influenced her testimony.

JY_July21

Posted in Interest Rate Monitor, Monetary Policy, Uncategorized | Tagged , , , | Leave a comment

Private Equity Coming To A Neighborhood Near You

Interesting piece in Wall Street Journal, which corroborates our last post,  The New “Supply-Side Economics” Fueling Asset Bubbles.   We argued institutional investors have been on a buying spree of residential housing for rental properties taking a massive amount of supply off the market, almost permanently,  and feeding the housing bubble in many areas.

A new breed of homeowners has arrived in this middle-class suburb of Nashville and in many other communities around the country: big investment firms in the business of offering single-family homes for rent. Their appearance has shaken up sales and rental markets and, in some neighborhoods, sparked rent increases.

On Jo Ann Drive alone, American Homes 4 Rent owns seven homes, property records indicate. In all of Spring Hill, four firms—American Homes, Colony Starwood Homes , SFR 0.06% Progress Residential and Streetlane Homes—own nearly 700 houses, according to tax rolls. That amounts to about 5% of all the houses in town, a 2016 census indicates, and roughly three-quarters of those available for rent, according to Lisa Wurth, president of the local Realtors’ association.

Those four companies and others like them have become big landlords in other Nashville suburbs, and in neighborhoods outside Atlanta, Phoenix and a couple dozen other metropolitan areas. All told, big investors have spent some $40 billion buying about 200,000 houses, renovating them and building rental-management businesses, estimates real-estate research firm Green Street Advisors LLC. Still, they own less than 2% of all U.S. rental homes, according to Green Street. 

...“The rent is crazy,” says Bruce Hull, Spring Hill’s vice mayor and owner of a local home-inspection business. “It hasn’t been that long since you could get a three bedroom, two bath for $1,000 a month.”

…“We had to make a big offer,” he said. “I just hope the bubble doesn’t burst and our loan goes upside down.” – WSJ

COTD_3COTD_2011.pngCOTD_2017

Posted in Housing, Uncategorized | Tagged , | Leave a comment

The New “Supply-Side Economics” Fueling Asset Bubbles

No, we are not talking about President Reagan’s supply-side economics — policies to increase productivity with the goal of increasing long-term aggregate supply or output while simultaneously reducing inflation.

Supply Side Economics_1

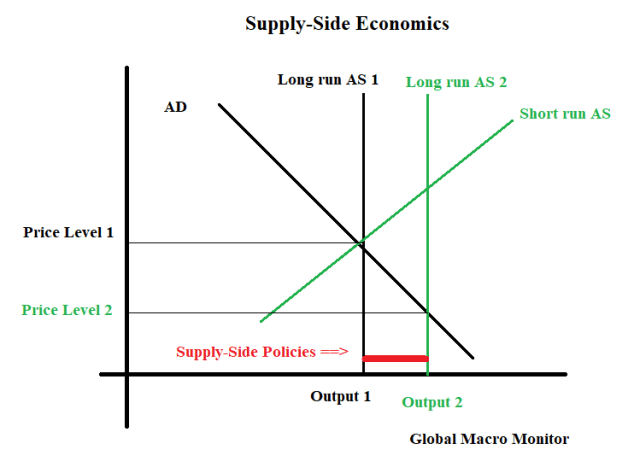
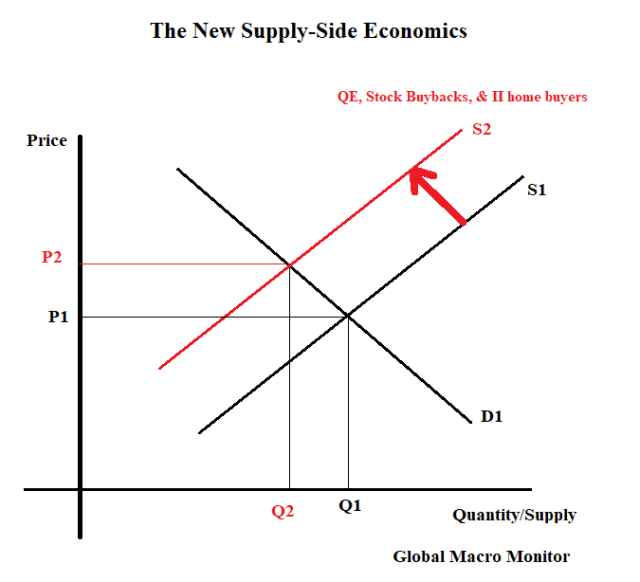
We now have a new kind of supply-side economics, just the opposite of Reagan’s, which effectively restricts, removes and shifts the supply curve to the left, increasing prices and fueling asset bubbles in risk-free bonds, stocks, and housing.

Supply-Side Stocks_Economics

Risk-free bonds

We have written extensively on how the global central banks have created artificial shortages of risk-free bonds through quantitative easing (QE).   See here and here.

The last data we analyzed has the Federal Reserve owning over 20 percent of marketable long-term Treasuries (> 1 year) and about 35 percent of the longer-term bonds (2027-2047 maturities).  The U.S central bank has thus removed or restricted the supply of over $2 trillion of risk-free bonds in the market.

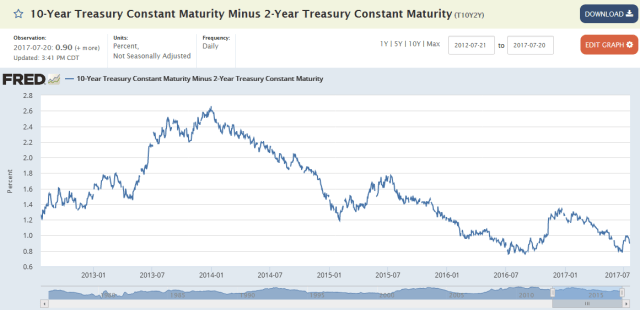
This has distorted the most important price in the world, the 10-year T-Note interest rate, of which, all other risk assets are priced.

Using data from the beginning of last year, the new supply-side economics, in totality,  have had global central banks:

  • removing  $12.3 trillion of supply of fixed-income securities and some equities (BoJ) through asset purchases in global QE programs;
  • creating  $8.3 trillion of global debt yielding zero percent or less;
  • and now rendering a population of 489 million living in countries with official policy rates less than zero.

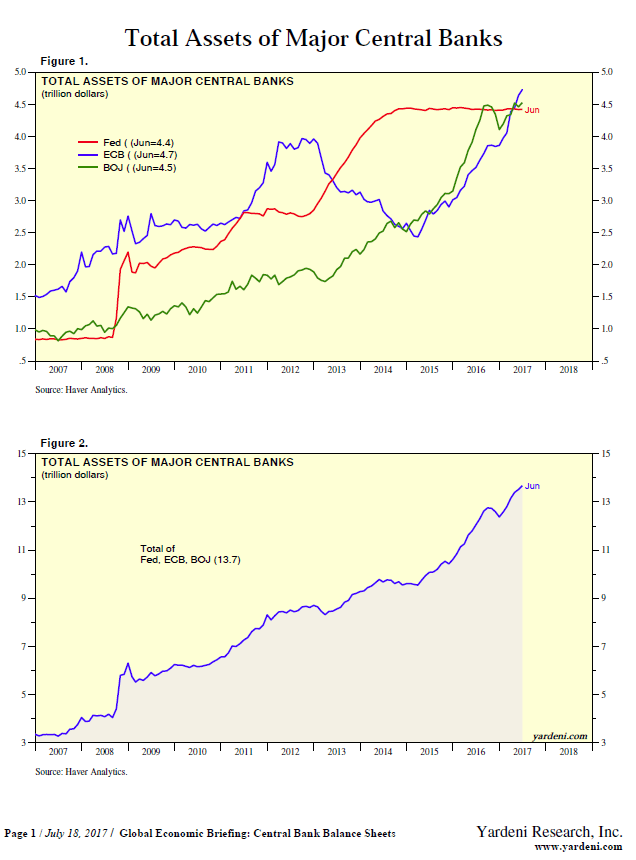
Here are more recent data from Ed Yardeni’s, Global Economic Briefing,  on the size of the big three central bank balance sheets,

Supply-Side_CenBan Assets

We don’t have an estimate, or any idea, of where the 10-year yield should be trading without QE, but we are certain it would be much higher.  An artificial and repressed risk-free rate distorts the markets and economy in several ways:

  1. Distorts the market signal of interest rate movements;
  2. Punishes savers and forces them to seek higher yields in riskier assets;
  3. Reduces the interest income of seniors dependent on savings who are at the mercy of CD interest rates, forcing a reduction in consumption and economic growth;
  4. Effectively defunds pensions funds, increasing their unfunded liabilities;
  5. Forces consumers to save more as interest rates and returns are repressed,  reducing economic growth;
  6. Distorts valuations and misprices all assets as it artificially lowers the discount rate;
  7. Encourages government largesse by financing government deficits;
  8. Incentivizes corporations to engage in debt financed buybacks rather than CAPX;
  9. Results in a gross and inefficient misallocation of capital;
  10. Creates almost “free money” the main culprit of almost all asset bubbles;
  11. Many others.

“...money seemed ‘free’  (money always seems free in manias).  – Charles Kindleberger,  Manias, Panics, and Crashes,  p.10

More Runway For Risk Assets?

Oddly, it doesn’t feel like we are in the mania stage quite yet.  This, coupled with the restricted supply and the buy the dipper algos, makes prices sticky to the downside and has contributed to record low volatility.  All this makes us think there may be  some runway left for risk markets, paving the way for a potential blow-off top in the fall or some time later.

Let us reiterate what we have said in earlier posts.  No judgement on the policy makers. They saved the system with their bold actions and kept many of us — from janitors to investment bankers — from living under the local freeway.  They are now painted in a corner, however, and have a very narrow window or path to a soft landing.
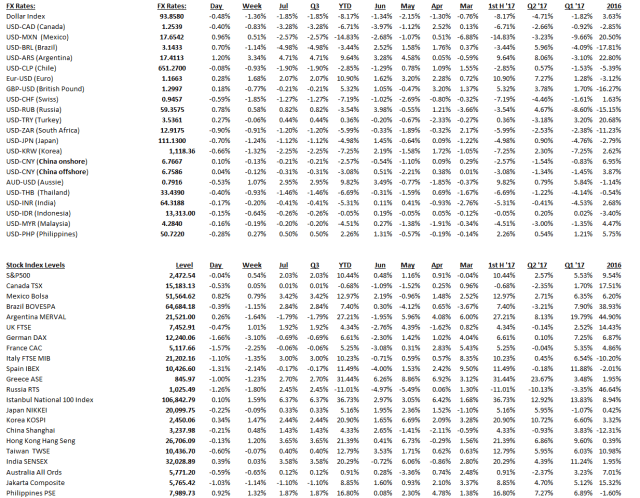
Stocks

Massive supply has been taken out of the market

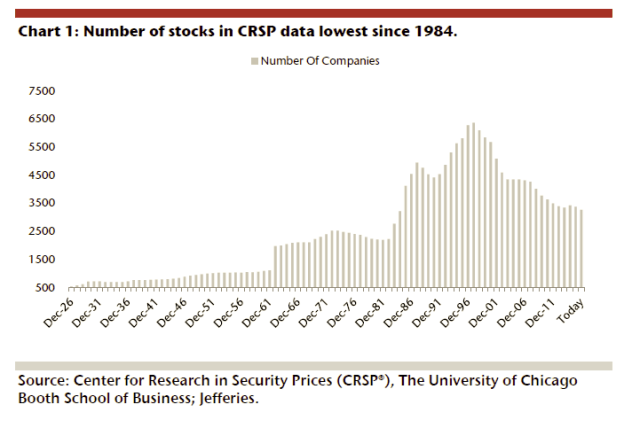
“Between the lack of IPO activity, the pickup of M&A, and buybacks, the U.S. equity world is becoming smaller and smaller, and this could be one of many reasons why active managers are lagging behind their indexes. Companies may not want to come public due to the additional cost of Sarbanes-Oxley or the fact that the private market has become a bigger source of financing than it has been in the past.” 

…For the curious, DeSanctis shows the number of common stocks is half as many as 1997’s peak of 6,364.  – CNBC

Supply-Side Stocks_Buybacks_3

A few days ago, Zero Hedge cited a piece by Credit Suisse,

Andrew Garthwaite writes, “one of the major features of the US equity market since the low in 2009 is that the US corporate sector has bought 18% of market cap, while institutions have sold 7% of market cap.”  – ZH

Supply-Side Stocks_Buybacks

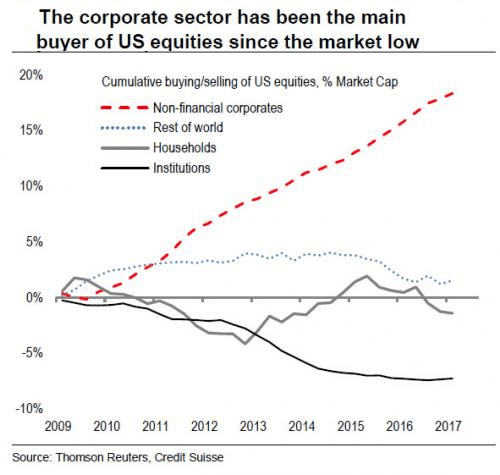
Zero Hedge concluded,   “companies…have engaged in the greatest debt-funded buyback spree in history.”
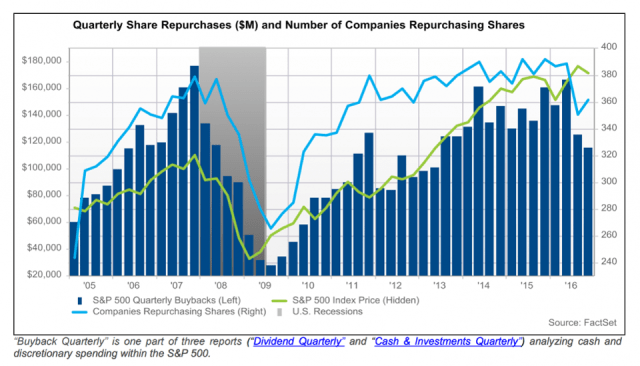
Finally,

“…Goldman Sachs’ chief equity strategist David Kostin estimated that, in 2017, S&P 500 companies will spend $780 billion on buybacks — a new record.”
–  Forbes

Supply-Side Stocks_Buybacks_2.png

Housing 

Consolidation in the residential rental industry has led to just a handful of companies and real estate trusts holding a huge percentage of the market. For example, last year, American Homes 4 Rent, the second-largest holder of single-family home inventory (47,000 homes in 2015) next to the Blackstone Group (50,000), merged with American Residential Properties in a $1.5 billion deal, giving them a combined valuation of more than $5 billion. According to The Journal, the six biggest holders of for-rent, single-family homes have spent more than $28 billion on property acquisitions since the market’s peak.
–  ConstructionDive

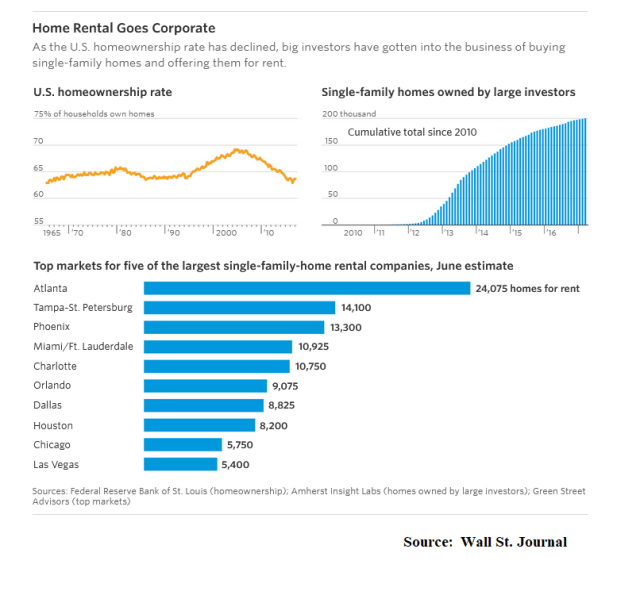
Since the end of the great recession, institutional investors have been buying up single family homes in droves with the purpose of renting them out.  This disrupts the traditional flow of buying and selling in the housing market as it takes a substantial amount of supply off the market almost permanently.


“We own about 100,000 either multifamily homes or single-family homes for rent.”Jonathan Gray, global head of real estate, Blackstone Group

This also increases the pricing power of homeowners to raise rents as supply becomes more concentrated.   In many parts of the country rents have been skyrocketing.

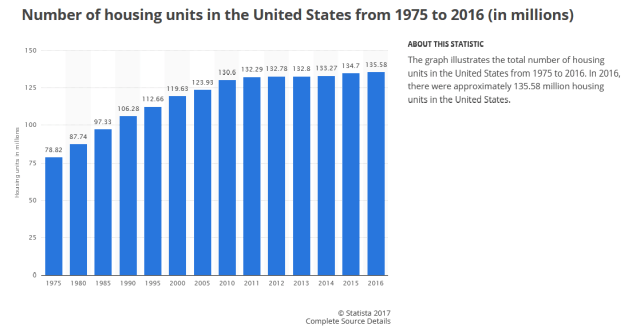
Furthermore,  new building has been relatively flat.  Take a look at the graph below.

Supply-Side Housing

Foreign Buying of Housing Market

Then there are the foreign buyers of U.S. homes, whom are hardly flippers and tend to hold their real estate assets long-term removing more supply from the market.

WASHINGTON (July 18, 2017) – Fueled by a substantial increase in sales dollar volume from Canadian buyers, foreign investment in U.S. residential real estate skyrocketed to a new high, as transactions grew in each of the top five countries where buyers originated.

..https://www.nar.realtor/topics/profile-of-international-home-buying-activity, found that between April 2016 and March 2017, foreign buyers and recent immigrants purchased $153.0 billion of residential property, which is a 49 percent jump from 2016 ($102.6 billion) and surpasses 2015 ($103.9 billion) as the new survey high1. Overall, 284,455 U.S. properties were bought by foreign buyers (up 32 percent from 2016), and purchases accounted for 10 percent of the dollar volume of existing-home sales (8 percent in 2016). – NAR

Supply-Side Housing_Foreign Buyers

Conclusion

The new supply-side economics as we have briefly outlined above,  allows us to say, “this rhyme is different.”   The assets bubbles we see today,  maybe with the exception of credit, are largely driven by supply restrictions rather than credit fueled demand as was the case in the 2007 bubbles,  though a case can be made that stock buybacks are driven by “free money.”   It is important to distinguish between  central bank base money, which is driving today’s global economy and markets, and credit based money, which was behind the 2007 bubble economy and evaporated almost overnight with the “Lehman Moment.”

What worries us most is the political blowback if rents and housing prices continue to  rise.   The younger generation is effectively locked out of the housing market, which will only increase the populist backlash and the “Clash of Generations“.

Many young adults are sitting on the sidelines of the housing market…new data shows that one huge factor is the competition — some might say unfair competition — young adults face from investors who can just swoop in, drop a pile of cash and buy the houses they want. These investors then turn around and rent these properties to those same young adults for increasing amounts every year, making it even tougher for young would-be homeowners to ever save up enough money for a down payment.  —  Money

Posted in Uncategorized | 69 Comments

QOTD: Bad Politics And Immorality Of “Watch It Fail”

Even conservatives are coming around to my ideas in the last post on health care.

A “watch it fail” approach to Obamacare, when the crisis is real and the consequences for poor children are so enormous, is not just bad politics; it is also immoral. –  Hugh Hewitt

(QOTD = Quote of the Day)

Posted in Policy, Politics, Uncategorized | Tagged , | Leave a comment

Economist Personality Traits

Studies of personality traits common to various disciplines have discovered that economics, like engineering, tends to attract people with an unusually strong preference for order, and a distaste for ambiguity. – The Guardian

Posted in Economics, Economist, Uncategorized | Tagged , | 3 Comments