The New “Supply-Side Economics” Fueling Asset Bubbles

No, we are not talking about President Reagan’s supply-side economics — policies to increase productivity with the goal of increasing long-term aggregate supply or output while simultaneously reducing inflation.
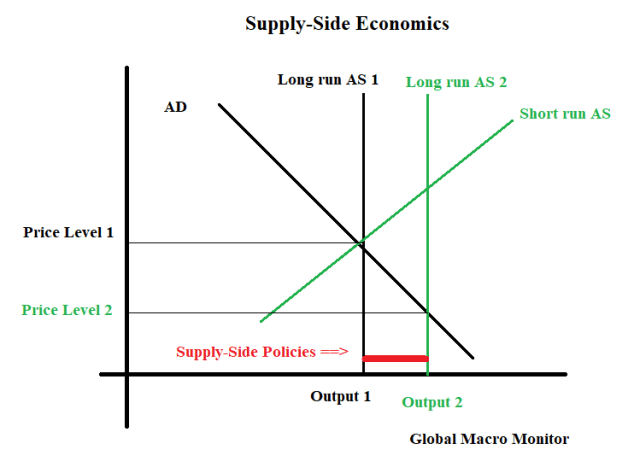
Supply Side Economics_1

We now have a new kind of supply-side economics, just the opposite of Reagan’s, which effectively restricts, removes and shifts the supply curve to the left, increasing prices and fueling asset bubbles in risk-free bonds, stocks, and housing.
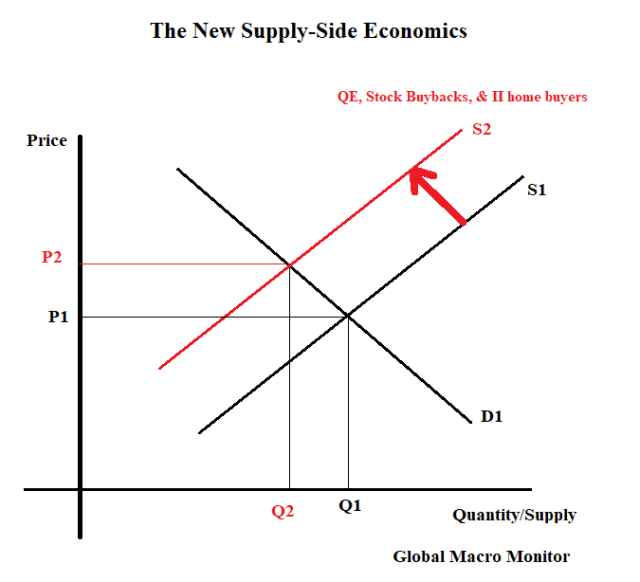
Supply-Side Stocks_Economics

Risk-free bonds

We have written extensively on how the global central banks have created artificial shortages of risk-free bonds through quantitative easing (QE).   See here and here.

The last data we analyzed has the Federal Reserve owning over 20 percent of marketable long-term Treasuries (> 1 year) and about 35 percent of the longer-term bonds (2027-2047 maturities).  The U.S central bank has thus removed or restricted the supply of over $2 trillion of risk-free bonds in the market.

This has distorted the most important price in the world, the 10-year T-Note interest rate, of which, all other risk assets are priced.

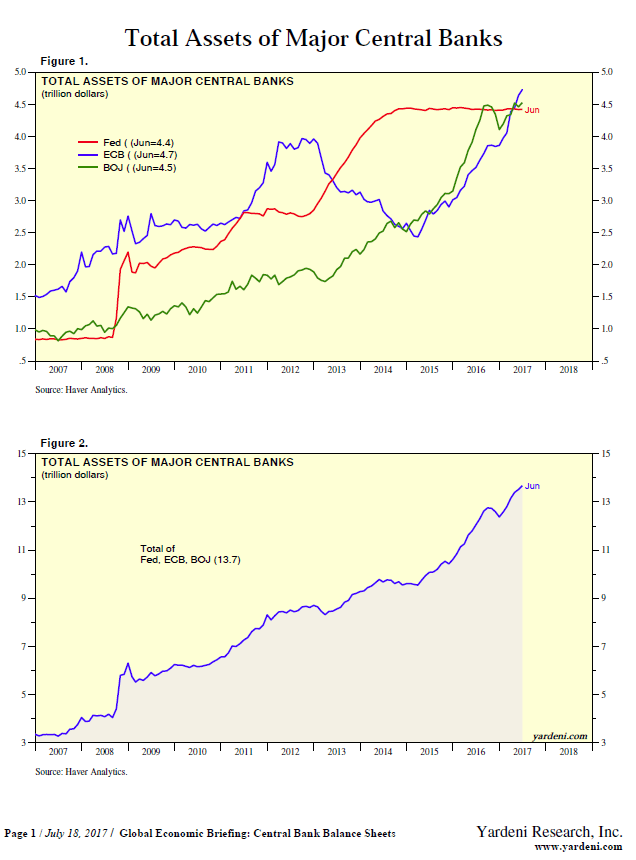
Using data from the beginning of last year, the new supply-side economics, in totality,  have had global central banks:

  • removing  $12.3 trillion of supply of fixed-income securities and some equities (BoJ) through asset purchases in global QE programs;
  • creating  $8.3 trillion of global debt yielding zero percent or less;
  • and now rendering a population of 489 million living in countries with official policy rates less than zero.

Here are more recent data from Ed Yardeni’s, Global Economic Briefing,  on the size of the big three central bank balance sheets,
Supply-Side_CenBan Assets

We don’t have an estimate, or any idea, of where the 10-year yield should be trading without QE, but we are certain it would be much higher.  An artificial and repressed risk-free rate distorts the markets and economy in several ways:

  1. Distorts the market signal of interest rate movements;
  2. Punishes savers and forces them to seek higher yields in riskier assets;
  3. Reduces the interest income of seniors dependent on savings who are at the mercy of CD interest rates, forcing a reduction in consumption and economic growth;
  4. Effectively defunds pensions funds, increasing their unfunded liabilities;
  5. Forces consumers to save more as interest rates and returns are repressed,  reducing economic growth;
  6. Distorts valuations and misprices all assets as it artificially lowers the discount rate;
  7. Encourages government largesse by financing government deficits;
  8. Incentivizes corporations to engage in debt financed buybacks rather than CAPX;
  9. Results in a gross and inefficient misallocation of capital;
  10. Creates almost “free money” the main culprit of almost all asset bubbles;
  11. Many others.

“...money seemed ‘free’  (money always seems free in manias).“  – Charles Kindleberger,  Manias, Panics, and Crashes,  p.10

More Runway For Risk Assets?

Oddly, it doesn’t feel like we are in the mania stage quite yet.  This, coupled with the restricted supply and the buy the dipper algos, makes prices sticky to the downside and has contributed to record low volatility.  All this makes us think there may be  some runway left for risk markets, paving the way for a potential blow-off top in the fall or some time later.

Let us reiterate what we have said in earlier posts.  No judgement on the policy makers. They saved the system with their bold actions and kept many of us — from janitors to investment bankers — from living under the local freeway.  They are now painted in a corner, however, and have a very narrow window or path to a soft landing.

Stocks

Massive supply has been taken out of the market

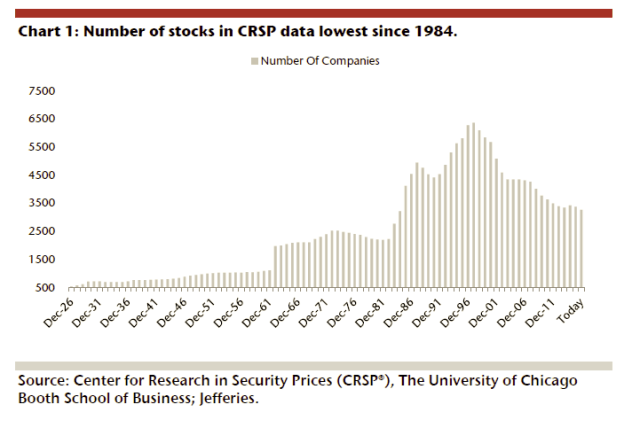
“Between the lack of IPO activity, the pickup of M&A, and buybacks, the U.S. equity world is becoming smaller and smaller, and this could be one of many reasons why active managers are lagging behind their indexes. Companies may not want to come public due to the additional cost of Sarbanes-Oxley or the fact that the private market has become a bigger source of financing than it has been in the past.” 

…For the curious, DeSanctis shows the number of common stocks is half as many as 1997’s peak of 6,364.  – CNBC
Supply-Side Stocks_Buybacks_3

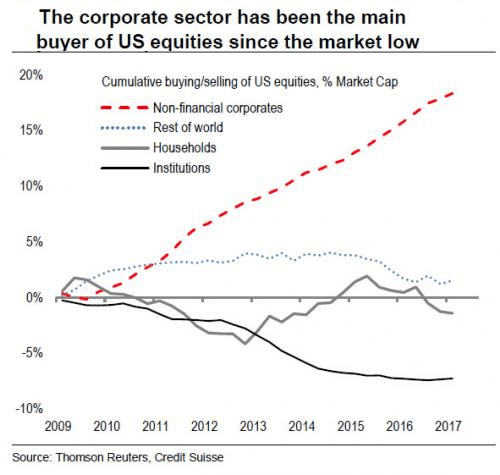
A few days ago, Zero Hedge cited a piece by Credit Suisse,

Andrew Garthwaite writes, “one of the major features of the US equity market since the low in 2009 is that the US corporate sector has bought 18% of market cap, while institutions have sold 7% of market cap.”  – ZH
Supply-Side Stocks_Buybacks

Zero Hedge concluded,   “companies…have engaged in the greatest debt-funded buyback spree in history.”

Finally,

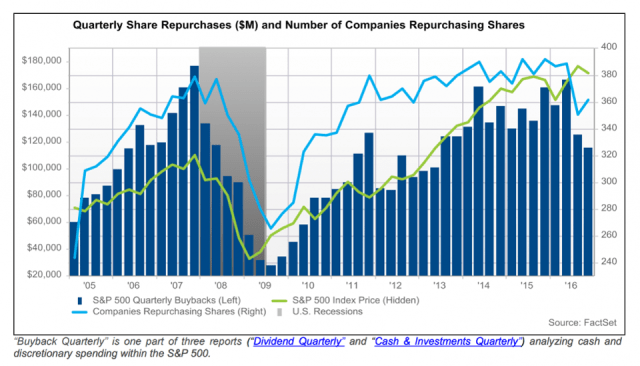
“…Goldman Sachs’ chief equity strategist David Kostin estimated that, in 2017, S&P 500 companies will spend $780 billion on buybacks — a new record.”
–  Forbes
Supply-Side Stocks_Buybacks_2.png

Housing 

Consolidation in the residential rental industry has led to just a handful of companies and real estate trusts holding a huge percentage of the market. For example, last year, American Homes 4 Rent, the second-largest holder of single-family home inventory (47,000 homes in 2015) next to the Blackstone Group (50,000), merged with American Residential Properties in a $1.5 billion deal, giving them a combined valuation of more than $5 billion. According to The Journal, the six biggest holders of for-rent, single-family homes have spent more than $28 billion on property acquisitions since the market’s peak.
–  ConstructionDive

Since the end of the great recession, institutional investors have been buying up single family homes in droves with the purpose of renting them out.  This disrupts the traditional flow of buying and selling in the housing market as it takes a substantial amount of supply off the market almost permanently.


“We own about 100,000 either multifamily homes or single-family homes for rent.” – Jonathan Gray, global head of real estate, Blackstone Group

This also increases the pricing power of homeowners to raise rents as supply becomes more concentrated.   In many parts of the country rents have been skyrocketing.

Furthermore,  new building has been relatively flat.  Take a look at the graph below.
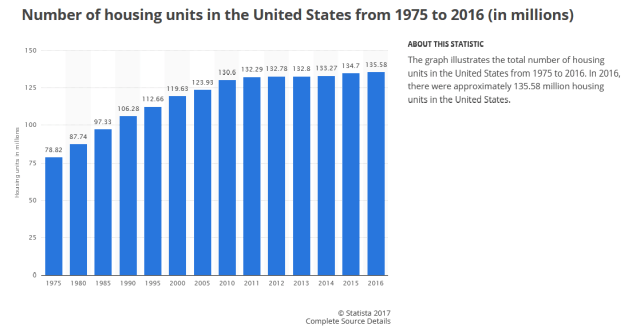
Supply-Side Housing

Foreign Buying of Housing Market

Then there are the foreign buyers of U.S. homes, whom are hardly flippers and tend to hold their real estate assets long-term removing more supply from the market.

WASHINGTON (July 18, 2017) – Fueled by a substantial increase in sales dollar volume from Canadian buyers, foreign investment in U.S. residential real estate skyrocketed to a new high, as transactions grew in each of the top five countries where buyers originated.

..https://www.nar.realtor/topics/profile-of-international-home-buying-activity, found that between April 2016 and March 2017, foreign buyers and recent immigrants purchased $153.0 billion of residential property, which is a 49 percent jump from 2016 ($102.6 billion) and surpasses 2015 ($103.9 billion) as the new survey high1. Overall, 284,455 U.S. properties were bought by foreign buyers (up 32 percent from 2016), and purchases accounted for 10 percent of the dollar volume of existing-home sales (8 percent in 2016). – NAR

Supply-Side Housing_Foreign Buyers

Conclusion

The new supply-side economics as we have briefly outlined above,  allows us to say, “this rhyme is different.”   The assets bubbles we see today,  maybe with the exception of credit, are largely driven by supply restrictions rather than credit fueled demand as was the case in the 2007 bubbles,  though a case can be made that stock buybacks are driven by “free money.”   It is important to distinguish between  central bank base money, which is driving today’s global economy and markets, and credit based money, which was behind the 2007 bubble economy and evaporated almost overnight with the “Lehman Moment.”

What worries us most is the political blowback if rents and housing prices continue to  rise.   The younger generation is effectively locked out of the housing market, which will only increase the populist backlash and the “Clash of Generations“.

Many young adults are sitting on the sidelines of the housing market…new data shows that one huge factor is the competition — some might say unfair competition — young adults face from investors who can just swoop in, drop a pile of cash and buy the houses they want. These investors then turn around and rent these properties to those same young adults for increasing amounts every year, making it even tougher for young would-be homeowners to ever save up enough money for a down payment.  —  Money

Posted in Uncategorized | 69 Comments

QOTD: Bad Politics And Immorality Of “Watch It Fail”

Even conservatives are coming around to my ideas in the last post on health care.

A “watch it fail” approach to Obamacare, when the crisis is real and the consequences for poor children are so enormous, is not just bad politics; it is also immoral. –  Hugh Hewitt

(QOTD = Quote of the Day)

Posted in Policy, Politics, Uncategorized | Tagged , | Leave a comment

Economist Personality Traits

Studies of personality traits common to various disciplines have discovered that economics, like engineering, tends to attract people with an unusually strong preference for order, and a distaste for ambiguity. – The Guardian

Posted in Economics, Economist, Uncategorized | Tagged , | 3 Comments

The Health Care Bill And The Fallacy Of 18% Of GDP

The American political system may just be about to wake up and inching torward bipartisanship. The failure of the Republicans to “repeal and replace” Obamacare after seven years of pounding the table is a “big fail.”

After controlling both houses of Congress and the White House the Republicans, at the end of the day, couldn’t get it done.

Why?

We stand by our major conclusion in our post,   A Few Thoughts On Why Health Care Went Down,   when the first House healthcare bill went down.  Most noteablely,

… the large majority of the country wants universal affordable health care and the next bill will be one to repair Obamacare.  – Global Macro Monitor

This is not a political statement — so hold off on the hate mail — but it is a fact supported by the polling data.

Health Care_Gallup

New Approach

“…the Congress must now return to regular order, hold hearings, receive input from members of both parties, and heed the recommendations of our nation’s governors.” – Sen. John McCain

Imagnine what would happen if President Trump now picks up the phone to Chuck Shumer to negotiate a fix to the health care system?   Probably worth 2,000 Dow points and it could reigvorate the Trump agenda.  After all, wasn’t President Trump elected to transcend politics and get things done?

Or,  how about Chuck Schumer reaching out to President Trump – we know the President likes that – and get the ball rolling?    Look how President Trump changed his tone on the Paris Climate Accord after President Emmanual Macron reached out to him.

…at a joint press conference before French and American journalists at the Élysée Palace, Trump indicated he may reconsider his decision.

“Something could happen with respect to the Paris accord,” he told reporters with typical Trump-like vagueness. “We’ll see what happens.” –  Daily Beast

Come on, get it together, politicos!  Let’s get some things done!  Do it for Jamie!

The Fallacy That Health Care is 18 percent of GDP

While we are  in this space,  let’s set the record straight.

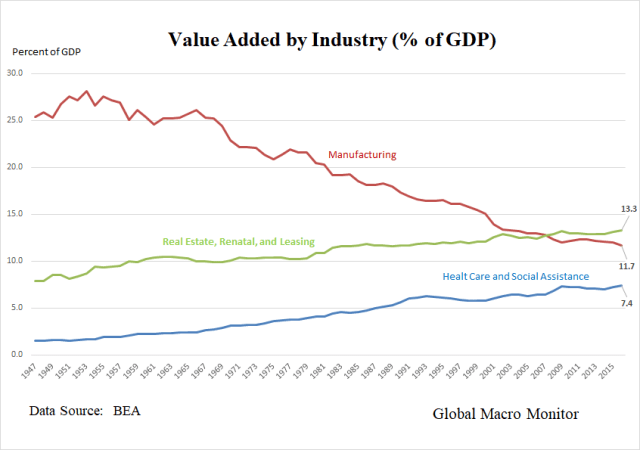
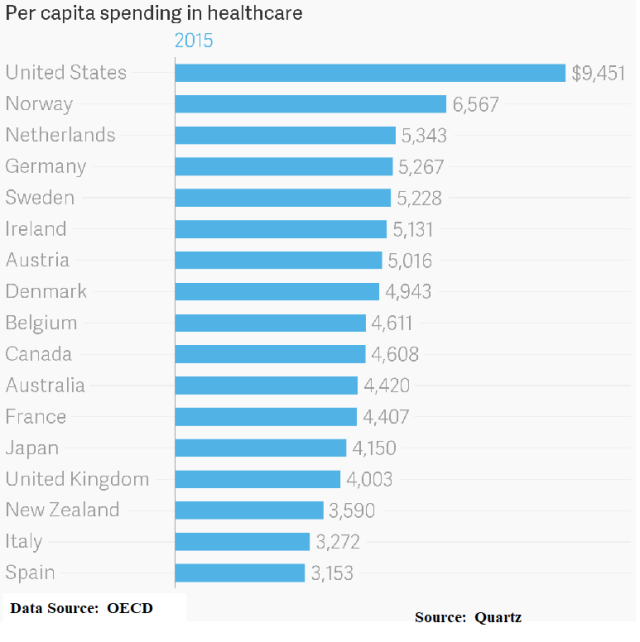
There is the notion out there that healthcare is 18 percent of GDP.   This is technically incorrect as that anlaysis wrongly conflates apples with oranges, for example.    Gross domestic product is calculated on a value-added basis.   Whereas spending, in most cases, does not, as it often includes costs of intermediate goods.

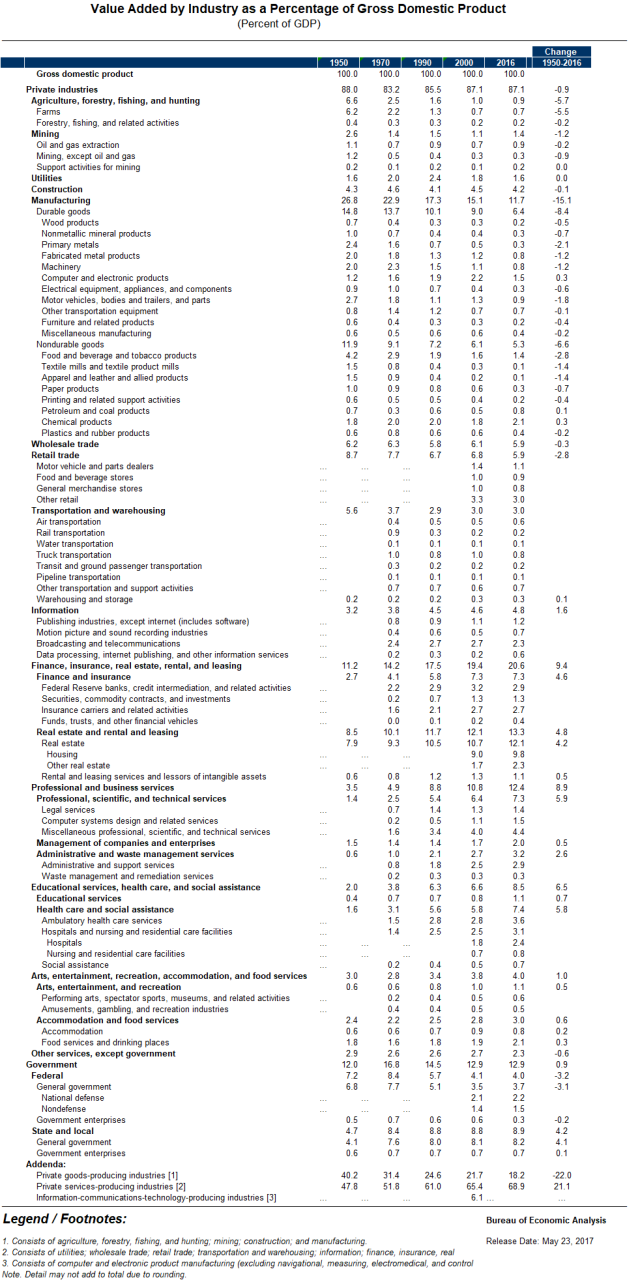
It is probably true to say that the U.S. spends 18 percent of GDP on health care, but it is not true to say health care is 18 percent of the U.S. economy.  In fact, on a BEA defined value-added basis health care is only 7.4 percent of U.S. GDP,  smaller than the real estate sector, for example,  which is now the largest subcomponent of GDP.

Value Added by Industry_BEA

The Bureau of Economic Analysis explains the differences,

Since the circular flow of macroeconomic expenditures (demand) or income (supply) are consistent, these dif­ferent measures should produce the same result for the U.S. economy as a whole. Industry-level value added (income) data are published in the GDP by industry accounts by BEA. One challenge for applying this rela­tionship to the health sector is that of the 65 unique in­dustries identified in these accounts, only two of them clearly are health care industries: ambulatory health care services and hospitals and nursing and residential care. The combined value added (supply) of these two sectors was 6.6 percent of GDP in 2012, well short of health expenditures’ (demand) share of 17.2 percent of GDP.  One reason for this gap is that some important health care activities are subsumed in other industries. Among these are pharmaceutical manufacturing, which is part of the chemicals industry; electro-medi­cal and therapeutic apparatus manufacturing, which is part of the computer and electronic products industry; and medical equipment and supplies manufacturing, which is included in the miscellaneous manufacturing industry.  – BEA

New Measures of GDP

Our good friend, Jose Cerritelli, and legendary M.I.T. eonomist is doing some good research on the shortfalls of measuring GDP.   In many developing countries the data are no better than educated guesses.   In fact, some are now using satellite-recorded luminosity as a proxy for economic activity.

Data Appendix

HealthCare_July18

Value Added by Industry Table_BEA


Posted in Economics, Uncategorized | Tagged , , , | 1 Comment

QOTD: Jamie’s Rant

“It’s almost an embarrassment being an American citizen travelling around the world and listening to the stupid shit we have to deal with in this country. And you know at one point we all have to get our act together or we will do what we’re supposed to do to the average Americans. And unfortunately people write about the things like it’s for corporations. It’s not for corporations, competitive taxes are important for business and business growth, which is important for jobs and wage growth. And honestly, we should be winging that along, but every single one of you every time you talk to clients.”  – Jamie Dimon

(QOTD = Quote of the Day)

Posted in Quote of the Day, Uncategorized | Tagged , , , | Leave a comment

COTD: U.S. Shale Breakeven Oil Prices

Shale_Breakevens

(COTD = Chart of the Day)                   Source:  World Bank-Global Monthly

Posted in Crude Oil, Uncategorized | Tagged , , | Leave a comment

Market Liquidity Conditions Still Loose As A Goose

Since the Fed began raising interest rates in December 2015,  financial market liquidity conditions have loosened considerably.   Recall our post,  Orwellian Monetary Policy,  which we wrote in May.

“Tightening is Easing”

Since U.S. monetary policy began tightening in December 2015, the Fed has added liquidity to the financial system through interest payments to banks on excess reserves and has reduced its surplus to the Treasury adding to the fiscal deficit.  Thus the financial system has had an effective injection of central bank liquidity and a fiscal expansion during a period of monetary tighenting. – Global Macro Monitor

The current Fed policy effectively injects liquidity into the financial system through raising the IOER rate — printing money to make interest payments on reserves banks hold on deposit at the Fed.   This compares to the traditional monetary policy where the Fed drains reserves from the financial system to drive the Fed Funds rate higher.   We are years off to getting back to traditional monetary policy.  Maybe not in our lifetime.

Performance of Stocks, Bonds, and Emerging Markets 

No wonder then markets are going bonkers.   Take a look at the performance of a select list of indicators since the Fed began raising interest rates.

Liquidity Conditions_July15

The S&P500 is at an all-time high, up over 20 percent since the Fed shifted to a tightening regime;  the 10-year Treasury yield is only up 5 bps;  the 10 minus 2’s yield curve is 32 bps flatter;  the dollar index is down -3.12 percent (we expect a big rally if any healthcare bill passes) ; the VIX is down over 50 percent and closing in on its December 22, 1993, all-time closing low of 9.31 and will probably take out its intraday all-time low of 8.89, set on December 27, 1993, sometime very soon.   The VIX has only traded below 9 one time.  See here for how the two VIX indices were concatenated or spliced together in 2003, merging the OEX VIX (VXO) with the SP500 VIX.

Emerging Markets Hot, Hot, Hot!

More impressive is the performance of the emerging markets.  Wasn’t Fed tightenings supposed to, and have historically,  wreaked  havoc on EM capital flows?   The JP Morgan EM Bond ETF (EMB) is up over 16 percent and the emerging market stock ETF (EEM) is up almost 40 percent!   The Mexican peso has rallied 20 percent since January 19, which is mainly due to the Trump slump in the polls.   Stunning, nonetheless.

 “John Bull can stand many things, but he cannot stand  2.0 , [-1.5 or 1.25]  percent”  – Bagehot

No great flop in commodities either with the CRB essentially flat since the Fed began raising interest rates.

Fed Has Lost Control

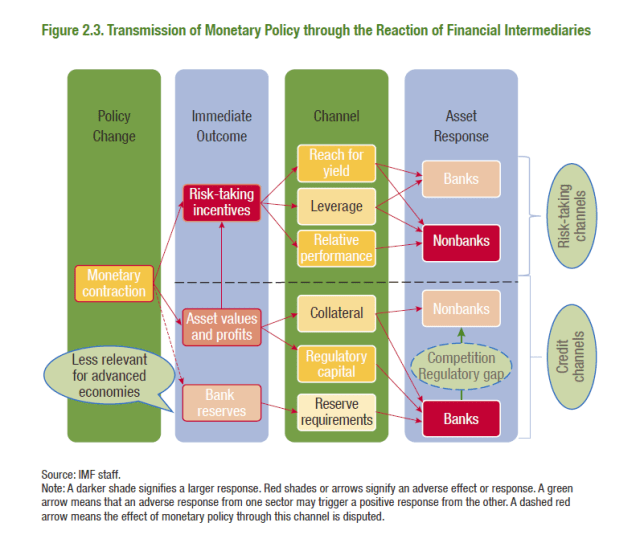
The Fed has once again lost control of a big part of monetary policy.   Its ability to influence the risk taking incentives of the markets (see chart below).  This is not the first time,  but it has been exacerbated by the structure of the new monetary policy,  of which we spoke about earlier.

No judgement, whatsoever,  on the policy makers.   They saved the system and kept many of us from living under freeways and have a very difficult job.   They now find themselves in a real dilemma, however,  with another major global asset bubble on their hands.


IMF_Monetary Transmission

We believe this is why the Fed has quickened its pace to start shrinking their balance sheet.   Rather than being  forced to overshoot interest rates, which could adversely affect the economy,  the Fed will start draining reserves through balance sheet reduction hoping to introduce some risk aversion and sense back into the giddy global markets.

Real Interest Rates

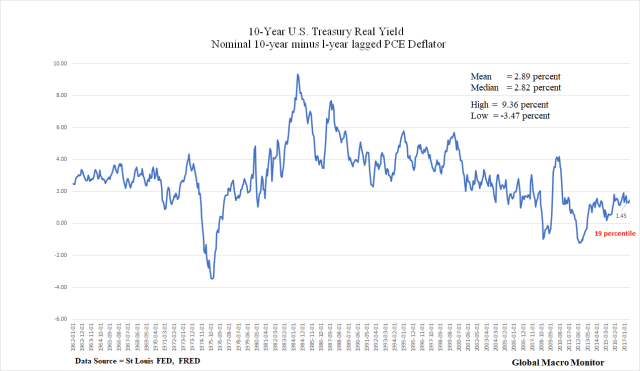
Finally take a look at real interest rates.   The current level of the 10-year real Treasury yield,  calculated as the nominal yield less the 1-year lagged PCE deflator, is only at the 19th percentile on a monthly basis going back to the early 1960’s.   Our sense is rates are going to have to move much higher (200-300 bps)  and quantitative tightening is going to take some time to really break these markets and burst the global asset bubbles.

Asset bubbles don’t pop very easy,  until they do.

In economics, things take longer to happen than you think they will, and then they happen faster than you thought they could.”   – Rudiger Dornbusch


Real 10-year yield_July 15

The first derivative trade, that is selling when the direction of policy changes,  is not going to cut it this time around.   Global interest rates are just too low and the flood of central bank liquidity is too high.

The bears are much too loud and adamant and the buy the dipper Algos are in control.   Until they aren’t.

Conclusion

Nevertheless,  assets are exteremly expensive,  monetary policy is moving in the wrong direction and the market is very vulnerable to a sharp sell off given a Black Swan event,  which we increasingly think may be some sort of geopolitical shock or a  humumgous populist backlash, for example,  as the wealth gap continues to widen.

Billionaire preppers.  Did you ever think you see the day?

…survivalism has expanded to more affluent quarters, taking root in Silicon Valley and New York City, among technology executives, hedge-fund managers, and others in their economic cohort. – New Yorker,  Jan 30, 2017

We are thinking October for a sigfinicant correction as the Fed should be on their way to getting smaller and China’s Party Congess should have concluded raising the risk of a market or policy shock in the Middle Kingdom.   But everyone is looking for the same.

It is tough and sometimes a career killer to watch a runaway market waiting for Godot  a market correction that doesn’t show up.   That keeps a “night sweat bid” in the market.   You know,  when your under allocated and the market keeps ramping and you awake in the middle of  the night in a cold sweat.    Night sweats and migraines.   We don’t miss those days.

Finally,  the path of least of resisitance seems to be  higher for risk assets, but as Ray Dalio says,

  … keep dancing but closer to the exit and with a sharp eye on the tea leaves. – Ray Dalio

Posted in Algos, Monetary Policy, Uncategorized | Tagged , , | 17 Comments

Mexican Peso Recovers All Of Its Trump Losses, Then Some

The Mexican peso,  after falling 18 percent against the dollar from the U.S. presidential election day to the day before the inauguration on January 19,  it has rallied almost 20 percent from its low, and is now up 15 percent on the year.   The peso is now even 4 percent stronger than before Trump’s surprise victory on November 8th.

The peso has been widely viewed as a finanical proxy and measure of President Trump’s political capital and popularity,

The election of Donald Trump turned the Mexican peso into a symbolic—and hypersensitive—indicator of the threat the new US president posed to the interconnected global economy.

The value of the Mexican currency plummeted to a record low the day after the vote and in the following months continued to tumble with every Trump tweet about his plans for a border wall and import taxes.

But the peso’s current level now suggests Trump is much less dangerous than foreign exchange markets had anticipated; it has recovered to pre-Trumpian levels, and then some…(Another Trump-induced fear is that his antagonistic rhetoric towards Mexico will fuel support for a populist politician who wants to run for president in 2018, Andrés Manuel López Obrador.)

…As the peso strengthens, Trump’s popularity has moved in the opposite direction. Polls put the president’s disapproval ratings at roughly 56%, up from around 41% on inauguration day. In some ways, Trump’s woes could be good news for Mexico, because they might signal that his administration won’t be effective enough to make good on his threats—for example, building a border wall. Trump has also learned that some of his positions, such as tearing up the North American Trade Agreement, ultimately weren’t that popular with members of his own party, forcing him to backtrack.  – Quartz

Mexico is also very fortunate to have one, if not the, world’s best central bankers in  Agustín Carstens, a Ph.D. economist from the University of Chicago.

Mexico Peso

Posted in Currency, Monetary Policy, Uncategorized | Tagged , , | 3 Comments

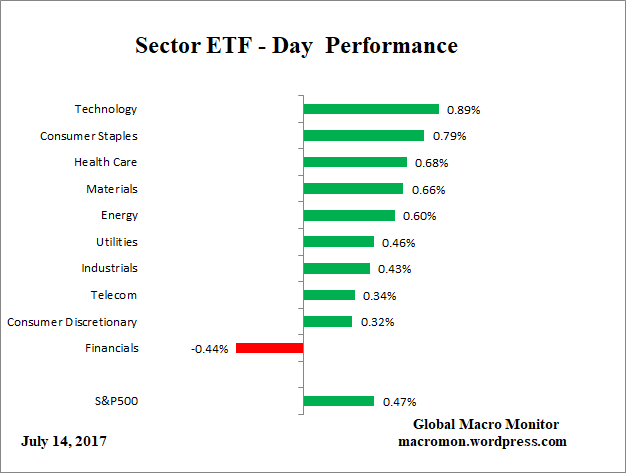
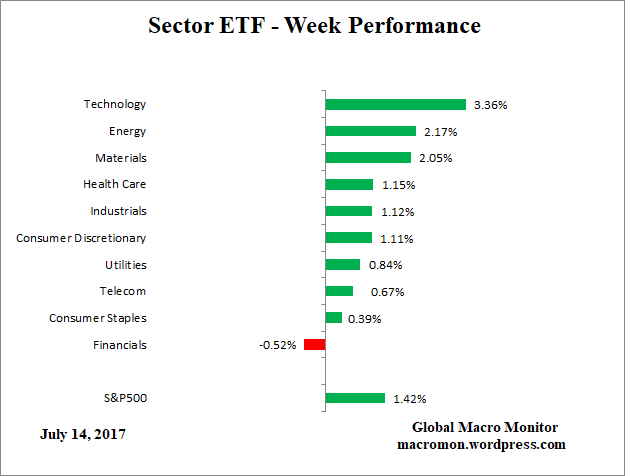
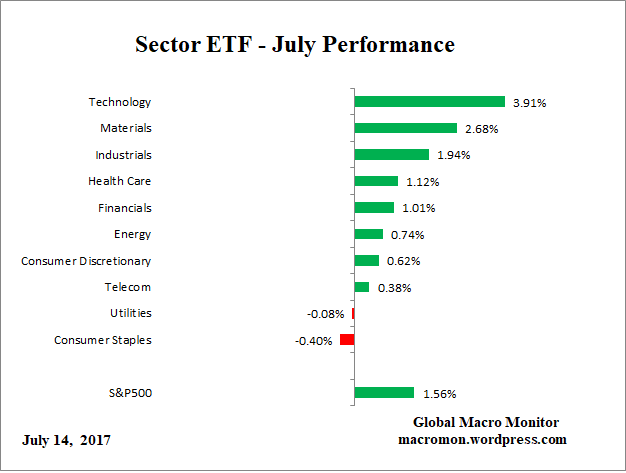
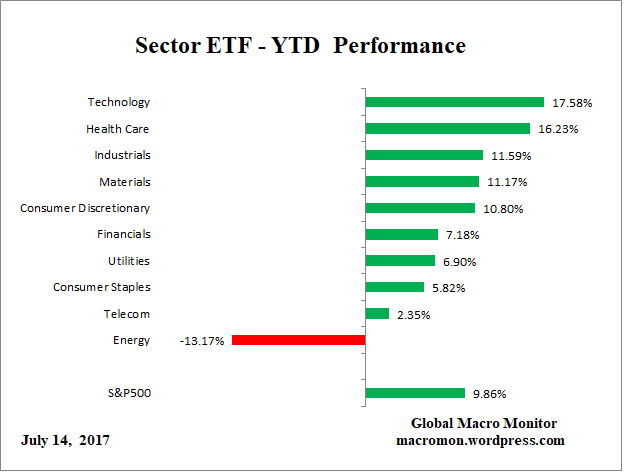
US Sector ETF Performance – July 14

ETF_DETF_WeekETF_MonthETF_YTD

Posted in Sector ETF Peformance, Uncategorized | Tagged , | Leave a comment

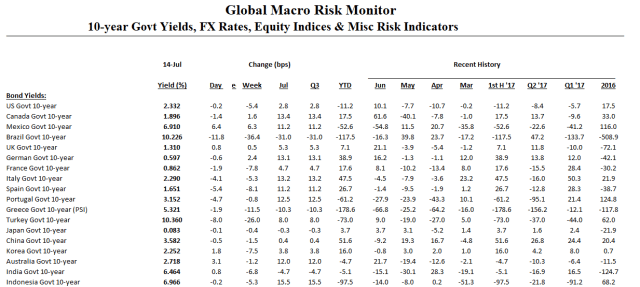
Global Risk Monitor – July 14

Click on table to enlarge and for better resolution

RiskMon_1RiskMon_2RiskMon_3

Posted in Daily Risk Monitor, Uncategorized | Tagged , , , , , | Leave a comment