S&P500/VIX Divergence

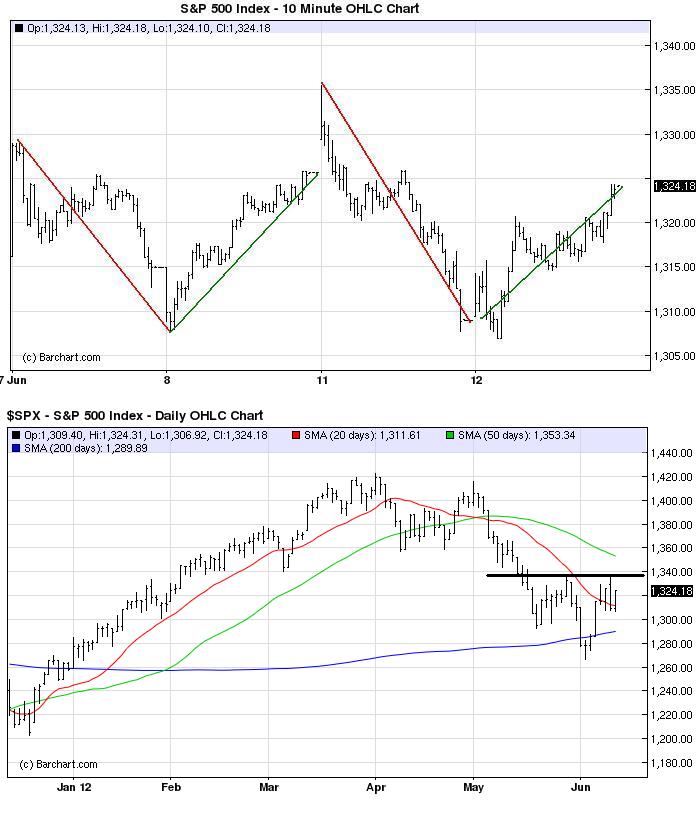
Interesting pattern has developed over the past few days.  The S&P500 spikes higher and yet the VIX remains elevated.   The S&P then rolls over later in the day.

Could be the triple witch, but we’ll play it as non-confirmation of the rally and use it as a short-term sell signal.    Also note that Apple is trading poorly, which has become our proxy for hedge firm risk appetite.

Could be wrong and always with a stop.  Let’s see how things close.

(click here if chart is not observable)

Posted in Apple, Equities | Tagged , , , | Leave a comment

Greek Withdrawl – 800 M euros per day

(click here if video is not observable)

Posted in Black Swan Watch, Euro, PIIGS | Tagged , , | Leave a comment

Sniffing The Romney Rally?

It’s very difficult for us to explain, on the fundamental basis,  why the market has been so bid over the past few days after Monday’s ugly reversal.

Could this be it?

The Rasmussen Reports daily Presidential Tracking Poll for Wednesday shows Mitt Romney attracting 48% of the vote, while President Obama earns 44%. Four percent (4%) prefer some other candidate, and four percent (4%) are undecided…

New numbers from the swing state of Iowa show a toss-up with Romney picking up 47% of the vote to Obama’s 46%. In that state, Romney has a 10-point advantage on the question of who is trusted more to deal with the economy.

The race is also a toss-up in Ohio, Virginia, Florida and Colorado. Romney leads in North Carolina and Missouri. Obama leads in Pennsylvania. New numbers from Wisconsin will be released at noon Eastern today.

Four years ago, after wrapping up the Democratic nomination, Obama led John McCain every single day during the month of June. His average lead was five percentage points.  Obama eventually won by seven points. In the first 13 days of June for Election 2012, Romney has held the lead 10 times, the candidates have been tied twice, and Obama has been on top once. See tracking history.

The tracking data is almost as volatile as stock prices and Intrade still has the President’s chances of winning in November at 52.7 percent,  but down almost 10 points in the last month.

Not a political statement, just as an observation and an opinion that risk markets rally on a Romney victory.

Stay tuned!

(click here if chart is not observable)

Posted in Equities, Politics | Tagged , , | 2 Comments

Italy Fears Pain From Spain

(click here if video is not observable)

Posted in Black Swan Watch, Euro, PIIGS, Sovereign Debt | Tagged , , , | Leave a comment

U.S. Economic Data Releases – June 13

Econoday reports,

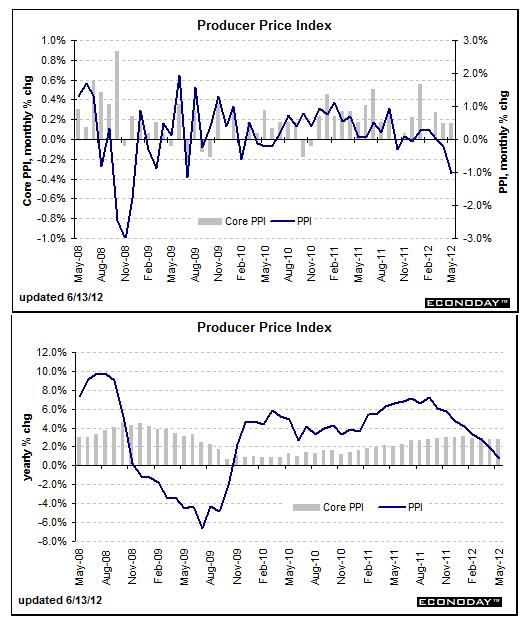
Producer Price Index – Down 1%, Core Up 0.2%

Lower crude oil prices are working their way into softer inflation again in May. And food prices have weakened. The PPI in May dropped a sharp 1.0 percent, following a fall of 0.2 percent in April. Analysts forecast a 0.6 percent decrease for the headline number. The core PPI, however, advanced 0.2 percent after rising 0.2 percent in April. The market consensus was for a 0.2 percent increase.

By major components, energy fell 4.3 percent, following a decrease of 1.4 percent in April. Gasoline prices plunged a monthly 8.9 percent after falling 1.7 percent the prior month. Food cost inflation dropped to minus 0.6 percent, following a 0.2 percent rise in April.

Within the core, over a quarter of the May rise can be attributed to the pharmaceutical preparations index, which climbed 0.7 percent. For other notable components, passenger cars rose 0.2 percent while light trucks declined 0.4 percent.

For the overall PPI, the year-ago rate in May was 0.8 percent, compared to 1.9 in April (seasonally adjusted). The core rate in May held steady at 2.8 percent. On a not seasonally adjusted basis for May, the year-ago headline PPI was up 0.7 percent, compared to up 1.9 percent for April while the core was up 2.7 percent, matching the pace in April on an NSA year-ago basis.

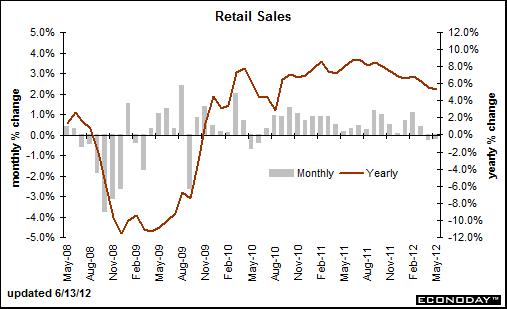
Retail Sales- Drop in Gas Prices Drive Retail Sales Down 0.2%

Retail sales in May were pulled down by a decrease in gasoline prices. Retail sales in May declined 0.2 percent, following a 0.2 percent dip in April (originally up 0.1 percent). The consensus projection was for a 0.2 percent decrease.

Motor vehicle sales actually added to sales, gaining 0.8 percent, following a 0.1 percent rise in April.

Excluding motor vehicles, retail sales fell 0.4 percent, following a 0.3 percent decline in April (originally up 0.1 percent). The market consensus was for down 0.1 percent. Gasoline sales dropped a sharp 2.2 percent after declining 1.4 percent in April.

Sales excluding autos and gasoline in May posted a modest 0.1 percent dip, matching the decline in April (originally up 0.1 percent). Core components were mixed but mostly down.

Weakness was led by gasoline stations (down 2.2 percent) and building materials & garden equipment (down 1.7 percent). Also declining were food & beverages, health & personal care, sporting goods & hobby, general merchandise, miscellaneous store retailers, and food services & drinking places.

On the plus side, nonstore retailers gained 1.3 percent, clothing & accessories rose 0.9 percent, electronics & appliances advanced 0.8 percent, and furniture & furnishings increased 0.4 percent.

Overall, consumer spending turned sluggish in May and April was softer than earlier believed. However, a key question that remains is whether atypically warm weather in the winter shifted sales forward at the expense of later months.

(click here if charts are not observable)

Posted in Economics, US Releases | Tagged , , | Leave a comment

What Congress Should Really Be Investigating

Tough to see Jamie be raked over the coals by Congress, who create trillion dollar deficits on annual basis and oversee the largest entity in the world by borrowing over $.40 of every dollar they spend.  No street cred, bro!

We also believe much of the reason why the private sector is hesitant to hire and is hording cash and not investing is the policy uncertainty emanating from the Congress and Administration.

Nevertheless,  the taxpayer has much at stake in a stable JP Morgan and banking system.   Jamie D. was adamant in his testimony about getting rid of too big to fail (TBTF).  Unfortunately,  the Chicago boys in the White House emasculated Paul Volcker (and our hero), the TBTF crusader,  early in the term.   Ergo TBTF gets bigger.

We go to a post from last year to give the Congress some guidance on what they really should investigating.  This type of nonsense, if true,  has kept retail investors on the sidelines and is, and will continue to have, deleterious macro consequences.

Does Anne Hathaway Drive Berkshire Stock?

Originally Posted on March 19, 2011

We posted last October our suspicions that algo/robo traders were driving the almost tick-for-tick correlation between the Australian dollar and the S&P500.  Remember those days of great fun?

Now, the Atlantic suspects that algorithms may, and we stress may,  have been written and programmed to buy Berkshire Hathaway (BRK-A) stock when Anne Hathaway is mentioned in the news!   Alexis Madrigal of The Atlantic writes,

A couple weeks ago, Huffington Post blogger Dan Mervish noted a funny trend: when Anne Hathaway was in the news, Warren Buffett’s Berkshire Hathaway’s shares went up. He pointed to six dates going back to 2008 to show the correlation. Mervish then suggested a mechanism to explain the trend: “automated, robotic trading programming are picking up the same chatter on the Internet about ‘Hathaway’ as the IMDb’s StarMeter, and they’re applying it to the stock market.”

The idea seems ridiculous. But the more I thought about the strange behavior of algorithmic trading systems and the news that Twitter sentiment analysis could be used by stock market analysts and the fact that many computer programs are simply looking for tradeable correlations, I really started to wonder if Mervish’s theory was plausible.

Madrigal checked in with John Bates, former Cambridge computer whiz whose company Progress Software writes algo strategies for hedge funds to ask, “Is this at all possible?  Bates, to his surprise, answered “Maybe.”

We come across all sorts of strange things in our line of business, strange correlations,” Bates told me. “And I’ve had a lot of interest in this for a long time because it’s really often the secret source for certain hedge funds.”

Companies are trying to “correlate everything against everything,” he explained, and if they find something that they think will work time and again, they’ll try it out. The interesting, thing, though, is that it’s all statistics, removed from the real world. It’s not as if a hedge fund’s computers would spit the trading strategy as a sentence: “When Hathway news increases, buy Berkshire Hathaway.” In fact, traders won’t always know why their algorithms are doing what they’re doing. They just see that it’s found some correlation and it’s betting on Buffett’s company.

Algo/robo trading appears to becoming not only more bizarre, desperate and reaching the level of the absurd.   Imagine a program, for example,  written to sell 10K S&P500 futures contracts in illiquid market on the news of a report of a butterfly flapping its wings at home plate at Wrigley Field momentarily interrupting  a Cubs game.  The selling drives the index down 2 percent.  Another program written to sell several thousand  contracts when the index moves down 2 percent in, say,  a 45 second time period then kicks in, driving the index down another 3 percent.  Several thousand other programs are written to sell  several thousand more contracts when the market is down 5 percent.   A tornado on Wall Street set off by the flapping of a butterfly’s wings in Chicago?  Hey, don’t entirely discount such a scenario.  This is probably not far from what happened during last year’s “Robots Gone Wild” flash crash which was kicked off by the bank burning Greek riots.

At least we have some theories behind our correlations, such as the Hang Seng as an indicator species for global risk appetite.   And we did make some money once buying Callaway (ELY), the proud sponsor of Phil Mickelson, the Friday before he won his first Masters.

But  good luck trying to trade against this type of nonsense.   We also wonder if the robot has been reprogrammed to sell rather than buy Nike (NKE) after Tiger’s downfall when he is now mentioned in the news.   As they say on the newly paved Street, just go with the algo!

(click here if table is not observable)

Posted in Economics, Policy, Politics | Tagged , , , | Leave a comment

EU officials discuss options should Greece exit euro

(click here if video is not observable)

Posted in Black Swan Watch, Euro, Eurozone Sovereign Spreads, PIIGS | Tagged , , | 1 Comment

Chop Shop Market

Choppy markets.

After yesterday’s huge reversal and the blowout in Italian and Spanish sovereign spreads this morning, this was the day they could have broke the market.

No so.  After some early weakness, the S&P500 traded straight up to close on its high.  Whispers of QE3 and other nonsense were given as the reason the market moved higher.

What do we think?  Too many traders getting short on the back of yesterday’s ugly reversal and caught offside.   Not enough sellers, too many shorts.  That simple.

(click here if charts are not observable)

Posted in Equities | Tagged , , | Leave a comment

Hollande Supports EU Banking Union

But is he willing to cede some of France’s sovereignty?  This is the political issue haunting the European street and holding back the Germans.

(click here if video is not observable)

Posted in Black Swan Watch, Euro, PIIGS | Tagged , , , | Leave a comment

Quote of the Day: EU Policymakers on Hopium

The primary strategy being pursued to prevent a further worsening of the situation is that of hope. And it is a strategy also being applied to the danger of further contagion. Greece, Ireland, Portugal, Spain: So far, European leaders have been unable to stop the chain of falling dominoes. Cyprus could come next. More ominously, though, are increasing fears that Italy might soon need help. It is unclear whether the euro bailout fund would be big enough to prop up Rome in addition to Madrid.
–   Stefan Kaiser in Der Spiegel

(click here if chart is not observable)
Posted in Black Swan Watch, Budget Deficit, Euro, PIIGS, Sovereign Debt | Tagged , , , | Leave a comment