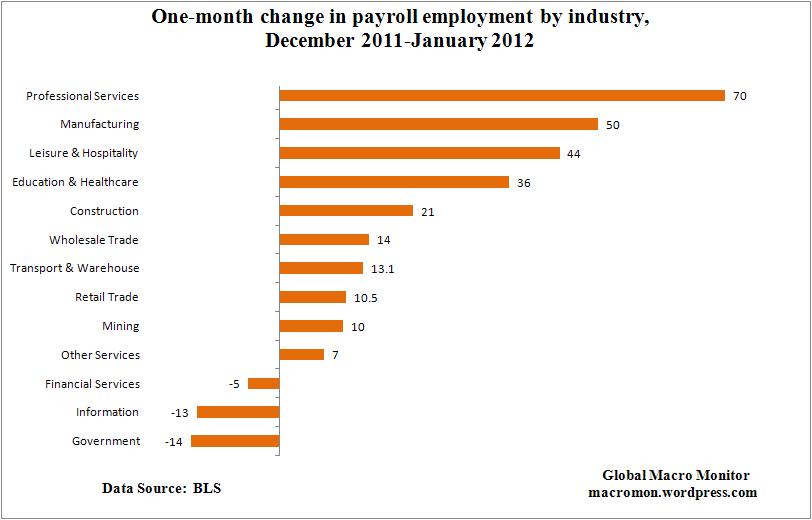
Total nonfarm payroll employment rose by 243,000 in January, and the unemployment rate decreased to 8.3 percent, the U.S. Bureau of Labor Statistics reported today. Job growth was widespread in the private sector, with large employment gains in professional and business services, leisure and hospitality, and manufacturing. Government employment changed little over the month.
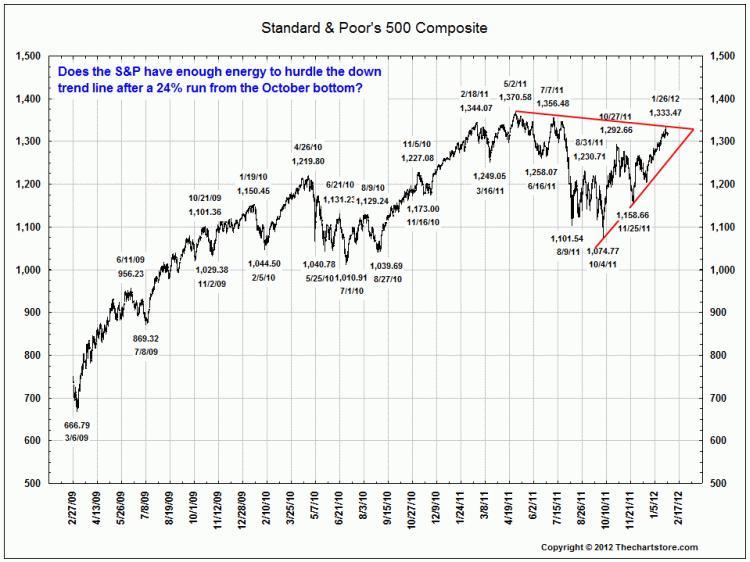
Our friends over at The Chart Store, who do excellent work as exemplified in the following chart, ask it:
Does the S&P have enough energy to hurdle the down trend line after a 24% run from the October bottom?
We we’re looking for a correction down to 1277, but after a couple times of trying to crack the glass ceiling at 1333, it looks like the index is back in 1300-1333 short-term trading range.
January data showed an improvement in Brazilian manufacturing sector business conditions, with both output and new orders rising since December. Although only modest, the improvement in operating conditions was in contrast to the deteriorations reported in each of the past seven months. On the job front, Brazilian manufacturers hired additional staff in January, with growth the strongest in nine months. Meanwhile, output charges fell during the latest survey period, albeit only fractionally.
Commenting on the Brazil Manufacturing PMI™ survey, Andre Loes, Chief Economist, Brazil at HSBC said:
“The HSBC Manufacturing PMI index rose to 50.6 in January. The good news is that after seven months in negative terrain, Brazil’s manufacturing sector expanded for the first time since May. However, this is still a soft recovery, and is generally consistent with the view that the economy has essentially been moving sideways since 2H2011. Still, the latest PMI index and its breakdown reinforce the perception that the worse of last year’s slowdown is behind us.”
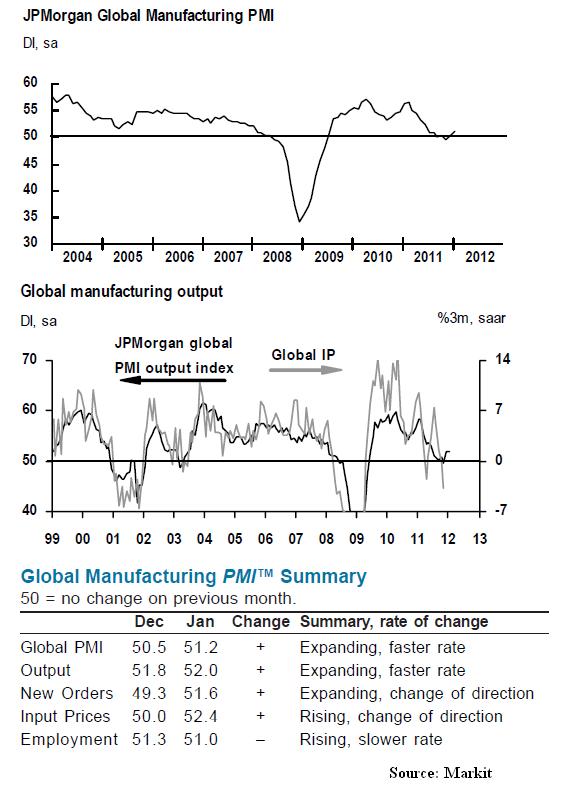
The global manufacturing sector continued to record below trend growth at the start of 2012. At 51.2 in January, the JP Morgan Global Manufacturing PMI™ rose to a seven month high, but remained below its long-run average (51.8).
Manufacturing output expanded for the second successive month in January, as new orders rose for the first time since last August. The cyclically sensitive new orders-to-inventory ratio also moved higher, reaching a ten-month peak. Although rates of expansion for both output and new orders were the fastest since last June, they were still only modest at best..
Global manufacturing employment rose for the twenty-sixth consecutive month in January, with jobs growth mainly driven by the US and Germany. Staffing levels were broadly unchanged in the Eurozone, Japan, the UK, India and Taiwan, whereas marginal job losses were signalled by China, Canada and South Korea.
Commenting on the survey, David Hensley, Director of Global Economics Coordination at JPMorgan, said:
“The global PMI rose to a seven-month high at the start of 2012. The PMI shows that order growth has picked up while inventory growth has slowed—a positive combination. The underlying trend in output growth is still soft, although it will be flattered in the very near-term by the post-flood bounce in Thailand and the resulting restoration of global supply chains.”
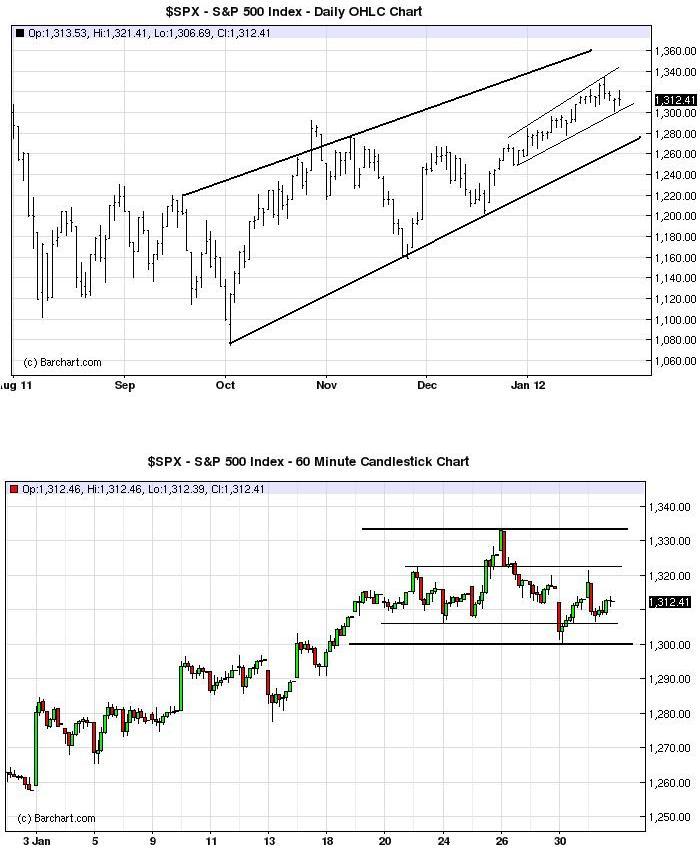
Interesting couple of charts on the S&P500. The top shows the narrowing upward channel in which the index has traded since the beginning of the year relative to the wider medium-term channel. The collapse in volatility was the direct result of the massive liquidity injections of the ECB’s LTRO program, in our opinion.
The second, a 60 minute chart, shows the S&P peaked at 1333 and has been trading poorly since. Also looks like a head and shoulders pattern is forming. We suspect a little pullback is due and is coming.
A move out of the narrow “snake in the tunnel” back to the lower bound of upward channel at 1277 would be extremely healthy for the market going forward. We’re also still watching the Shanghai to confirm the move in other equity markets. It’s been a real a dog since returning from holiday. Stay tuned.
The average cost for a 30-second ad during Sunday’s Super Bowl will be $3.5 million, with some slots costing as much as $4 million. That’s a rate of $7 M per minute; $420 M per hour; $10.1 B per day; and $3.7 T per year! Now if only we could find the stimulus money to create that kind of demand!
Cars and beer have dominated ad spends over the past five years. The investments pays huge divies according to Nielsen,
While Super Bowl ads require a substantial investment, they tend to get a measurable marketing bump from their prominent placement. According to Nielsen, ads that aired during 2011’s Super Bowl XLV were, on average, 58 percent more memorable than commercials airing during regular programming in the first quarter of 2011. In addition, brand awareness for commercials airing during the Super Bowl was up to 275 percent higher than awareness for the same creative during regular programming.
Click here for a review of some that are expected to run on Sunday. Here’s one from Suzuki that will air during the game as Eli Air lands several of his jumbo jets in the Patriot’s end zone!
(click here if charts and video are not observable)


 (click here if charts are not observable)