Week in Review: Euro Contagion and Greek Rollovers

Short and sweet commentary tonight as last week really didn’t resolve much.  The S&P500 met tough resistance and was rejected twice at the 1298-99 level.  Though the index made a higher low and higher high, it closed Friday just a few points above its 200-day moving average at 1263, which also coincides with the week low.  This, along the prior week’s low of 1258 and the March low of 1249 are key support. We wouldn’t be surprised to see them tested before the austerity measures are voted on in the Greece parliament.

The Asian markets bounced after a multiple week losing streak with the Japan now looking in the best shape making a higher low, higher high, and is the only major index above its 50-day moving average.   There was a lot of negative press over the weekend about China’s economy and this will continue to weigh on the global markets, in our opinion.

Almost every commodity got hammered last week with the intervention from the IEA in the crude oil market.  We think the correction has a way to go and are steering clear of most commodities for now.   It’s hard to believe, but crude oil is now pretty much flat for year and cash wheat is down almost 15 percent.

Next week will be dominated by the European Debt Crisis with all eyes focused on the Greek government’s ability to get its austerity program approved.  Contagion fears could really roil the markets so monitoring the major bank stocks of Spain and Italy, for example, is an exercise worthy of your attention.   We’re expecting some pretty decent volatility next week.  Buckle up!

(click here if charts are not observable)

Posted in Week in Review | Tagged , , , , , , | 3 Comments

Have Policymakers Discovered the “Splendid Arbitrage”?

How ’bout a little summer Sunday humor (albeit a little nerdy) before getting back to the daily grind.   Last week saw a global coordinated response to shaft specs in crude oil as many, including us, think the rise in energy prices has contributed to the slowing of the global economy.   If you didn’t notice grains also got hammered.  The chart below shows the CRB Foodstuffs Sub-index looks like it’s rolling over.   This is good for the world, in our opinion.  Cheaper food prices equates to less hunger.

Now we’re wondering if policymakers understood the “splendid arbitrage” we wrote about in January as they got a twofer last week – lower oil and lower food prices.    To understand the “splendid arb” here is the original post.   Have fun…    P.S., before totally dismissing think algo trading!

Greatest Arb Ever: Cracking Gas into Big Macs

Posted on January 12, 2011

OK, time for a little fun.  You can try this and let us know if it works.

Almost everything today comes down to energy, right?

The rise in food prices is really nothing more than an energy problem.   After all, food consumption is about the digestion of calories — one metric of energy measurement – to fuel the human machine.

Scientists have learned to “crack” the energy of foodstuffs,  mainly corn and sugar, and convert these into transportation fuel.   It gives new meaning to “cracking corn.”

If we could do the reverse and crack highly efficient refined fuels into foodstuffs,  for example, we believe we have found the greatest arbitrage of all time.

The Energy Conversion Table below shows that one British Thermal Unit (BTU) is equivalent to 252 calories and one gallon of gasoline is equivalent to 125K BTUs.   Therefore, one gallon of gasoline is the energy equivalent of 31.5M calories.

The energy component of a Big Mac without cheese, for example, is 576 calories, so one gallon of gasoline is the energy equivalent of 54,688 Big Macs.  Still with us?

We’ve included the following table/matrix to show that if you drove 50 miles today in a car that gets 20 miles per gallon, you consumed the energy equivalent of 137K Big Macs.  Yuck!

The last table, The Greatest Arbitrage Ever, shows the dollar price of a Big Mac in various countries (no wonder the Brazilians are now aligning with U.S. against China ‘s FX policy)  and the Big Mac energy equivalent price of a gallon of gas.  That is, one gallon of gas is the energy equivalent to 54,688 Big Macs and with the price of a Big Mac in Brazil at $5.26, the Big Mac energy equivalent price of a gallon of gas in, say Sao Paulo, is $287,656.25.

What an arb, no?  Buying a gallon of wholesale gasoline in Rio for $2.45, “cracking” it into 54,688 Big Macs, and selling them at $5.26 for $287,656.25 sounds like a “splendid arbitrage” to us!

Fun exercise and we can’t wait for the e-mails from the economists on this one.  Before you waste your time,  remember, we’re not serious!

(click here if tables are not observable)

Posted in Commodities, Crude Oil, General Interest, Uncategorized | Tagged , , | 1 Comment

Global Trend Indicators


(click here if tables are not observable)

Posted in Global Trend Indicators | Tagged , , , | 2 Comments

Support of the Masses

Just a quick little chart for the weekend to show how the major indices are at or near key support levels.   Here we have the CRB Index breaking short-term support yesterday and just barely closing through its 200-day moving average.   This week’s crude oil sell-off kicked it over the edge as energy makes up a large portion of the index.

The S&P500 is now sitting just a few points above its 200-day moving average after the textbook bounce last week and looks ready to take a stab at the 1250 in the near future.   If it seems all Greek to you, it is.   And it appears to be spreading.

If Greece doesn’t find support from its masses,  good luck finding technical support of the indices.   Stay tuned.

(click here if charts are not observable)

Posted in Charts, Commodities, Equities | Tagged , , | Leave a comment

The Weekend Read: Greek Week

Everything depends on computers these days: the energy supply, airplanes, trains. I’m worried that the Net will soon become a war zone, a platform for professional attacks on critical infrastructure.
– Evgeny Kaspersky,  anti-virus expert

Bonds
Munis Dithering in Wake of Economic News – Bond Buyer
SEC Plans New Office For Munis – Bond Buyer
Treasurys rise, adding to weekly gain – MarketWatch

China
China’s Military Readiness – Stratfor
China: Rising power, anxious state – Economist
Economists discuss future of China’s economic growth – China Daily
How China plans to reinforce the global recovery – Wen Jiabao
John Paulson and China Worries, William Pesek – Bloomberg

Commodities
Food Price Volatility and Insecurity – Council on Foreign Relations
Grain Prices Plunge as Favorable Weather May Revive Crops in U.S., Europe – Bloomberg
IEA Petroleum Release to Inflate U.S. Crude Supply Glut – Bloomberg
IEA release may signal bad news for US – Upstream
Rare earth prices soar as China stocks up – FT
Ron Paul worries Fort Knox gold is gone – CNN

Companies
Analysts Bullish On Oracle Despite Surprise Drop In Hardware Sales – WSJ
Micron Technology Shares Plunge After Chip Prices Drag Down Sales, Profit – Bloomberg

Currencies
Trades reveal China shift from dollar – FT

Economics
The Busts Keep Getting Bigger: Why? – Paul Krugman
The U.S. and E.U.: Have They Ever Been in Such Terrible Shape? – TNR

Emerging Markets
Look to Emerging Markets for Killer Apps: VC – CNBC

Equities
Big Broker Earnings Expectations Fall Sharply – Bespoke

Europe
Against the odds, the euro will scrape through – FT
EMU getting the worst of all worlds, Gavyn Davies – FT
Greek Debt Crisis Tipping Point – Council on Foreign Relations
Italian Banks Lead Increase in Financial Credit Risk in Europe – Bloomberg
Italian Banks Plunge, German Yield Spread Widens on Debt Concern – Bloomberg
Italy will fight last stand in debt crisis war – FT
Scenarios: Possible impact of a Greek ratings default – Reuters
The opportunity for Europe’s leaders to avoid disaster is shrinking fast – Economist

Markets
S&P 500 and Sector Breadth – Bespoke
The mother of all tail risks – Economist
The price of Wall Street’s black box – FT

Monetary/Fiscal Policy
Bernanke Admits He Just Does Not Know – Real Clear Markets
Mervyn King’s Spread Bet – Gold Seek
Obama takes lead in debt talks – Politco

Technology
15 Leading Innovators for the Next Decade – CNBC
Biomedicine: A Spit Test for Age – TR
How My Wi-Fi Scale Adds to America’s Class Divide: Peter Orszag – Bloomberg
Mobile Health Apps That Share – TR
Researchers Turn Twitter Into Real-Time Sports Commentator – TR Blog

Video:  Euro – a ‘collapsing prison’ for Greece and Co.?

(click here if video is not observable)

Posted in The Weekend Read | Tagged , , , , , | Leave a comment

Is the Fed the World’s Largest Fixed-Income Hedge Fund?

The following data is taken from Congressional testimony of the well respected banking analyst, Bert Ely, illustrates how the Federal Reserve has gone from being a taxpayer subsidized monetary authority to one of the world’s largest and most profitable bank/fixed-income hedge funds.   Mr. Ely points out the pre-crisis Fed balance sheet (Table 1) consisted mainly of “Fed-issued currency intermediated into Treasury securities with both of those items compromising 90% of their side of the Fed balance sheet.”     On the income side, Table 2 shows that in 2007, which Ely calls the last “normal” year, the U.S. taxpayer provided a $5.7 BN indirect subsidy to the Fed by paying $40.3 BN (line 1) of interest of the Fed’s holdings of Treasury securities, of which a $34.6 BN surplus (line 17) was returned to the Treasury.

Table 1 also illustrates how, since the crisis began, the Fed has more than tripled the size of its balance sheet, increasing its Treasury holdings by $650 BN and purchasing of over $1 TN of MBS and Agency debt.   As of May, according to Ely, the Fed held 14 percent of the total debt and MBS issued or guaranteed by the three housing-finance GSEs and Ginnie Mae.   The balance sheet growth was financed almost entirely by the creation of bank reserves held as deposits at the Fed (line 10).   These reserves now account for almost 10 percent of total banking-industry assets, which, prior to the crisis was effectively a rounding error.

Table 2 shows the Fed’s net income has grown from $38.7 BN in 2007 to $81.7 BN in 2010 (line14).  Though the sharp decline in interest rates reduced the Fed’s interest income on Treasuries  from $40.3 BN to $26.4 BN, the more than $1 TN purchase of agency debt and MBS helped to generate $53 BN in interest income (line 3) in 2010, up from $.6 BN in 2007.  The Fed returned $79.2 BN to the Treasury in 2010 (line 17) and after accounting for the $26.4 BN of interest on Treasuries generated a $52.9 BN profit for taxpayers.

The risks?   Take a look the leverage ratio in Table 1 (line 13).  John Hussman points out the Fed’s leverage ratio in now higher than that of Bear Sterns and Fannie Mae with similar interest risk though less credit risk.  He writes,

The maturity distribution of these [Fed] assets works out to an average duration of about 6 years, which implies that the Fed would lose roughly 6% in value for every 100 basis points higher in long-term interest rates. Given that the Fed only holds 2% in capital against these assets, a 35-basis point increase in long-term yields would effectively wipe out the Fed’s capital…

To avoid the potentially untidy embarrassment of being insolvent on paper, the Fed quietly made an accounting change several weeks ago that will allow any losses to be reported as a new line item – a “negative liability” to the Treasury – rather than being deducted from its capital. Now, technically, a negative liability to the Treasury would mean that the Treasury owes the Fed money, which would be, well, a fraudulent claim, and certainly not a budget item approved by Congress, but we’ve established in recent quarters that nobody cares about misleading balance sheets, Constitutional prerogative, or the rule of law as long as speculators can get a rally going, so I’ll leave it at that.

We’re not sure of the endgame and when and how all this is going to play out.  But we do agree with Mr. Hussman that “the predictable outcome is instability.”   Toto, I have a feeling we’re not in Kansas anymore.

(click here if tables are not observable)

Posted in Bonds, Economics, Inflation/Deflation, Monetary Policy | Tagged , , , | 6 Comments

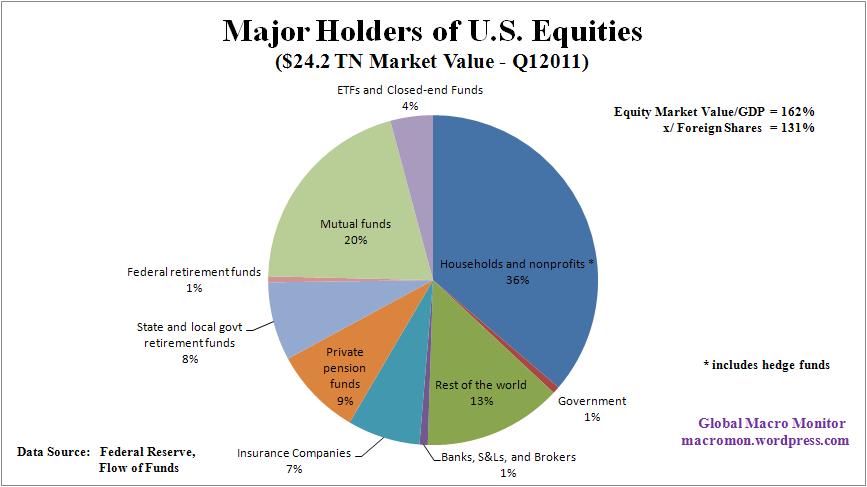
Who Owns the U.S. Equity Market?

The following chart shows who holds U.S. equities, including foreign shares traded in the U.S.. at the end of March 2011.    Notice that 36 percent of the market value of shares were held by the household sector.  Our good friend, Charles Biderman of TrimTabs, does point out that the household sector includes “among other things, hedge funds, endowments, non-profit organizations, and direct purchases of equities by investors.”  Furthermore, according to the Federal Reserve,

financial assets and liabilities of the household sector are largely derived as residuals because reports on the balance sheet activities of households are generally not available, except intermittently. In other words, the FFA starts with known economy wide totals for individual transaction categories and then amounts reported to be held by other sectors are deducted, leaving the household sector with the remainder. For most transaction categories, such as home mortgage debt and time deposits, this method seems reasonable because the household sector is the largest holder. Yet uncertainty about the accuracy of the asset and liability estimates in the FFA household sector remains and at times, the FFA estimates have been in question because of their residual nature.

Nevertheless, the chart does give a decent snapshot of the major holders of U.S. equities.   Stay tuned, we will be back with more analysis on this topic.  Click on chart for better resolution.

(click here if chart is not observable)

Posted in Charts, Equities | Tagged , | 12 Comments

Question of the Day

Market’s are priced for a G-Pap vote of confidence and will most likely celebrate with a relief rally.  But the 12 billion euro question is can G-Pap win over the Greek street?   If you believe it, run, don’t walk to the 29 percent Greece 2-year bond.

Posted in Black Swan Watch, Sovereign Debt, Sovereign Risk, State and Local Government | Tagged , | Leave a comment

Debt and Leverage in Advanced Economies

The following is one of the most comprehensive snapshots of relative debt and leverage in the major advanced economies.   The source of the table is the IMF’s Global Financial Stability Report (page 11).

We find interesting that U.S. debt held abroad is less than that, say France, which is probably due to Europeans financing of the French budget deficit.  Also interesting the line “Households’ net debt”,  which is, with a positive sign,  equivalent to household net worth as % of GDP.

Note also Japan’s economy negative net external liabilities, which is a reflection of cumulative private sector investment held abroad, a result of the county’s structural current account surplus, and why the Yen has remained strong in a weak economy.    The table also illustrates that Japanese banks have been financing the public sector sector and are heavily exposed to JGBs (see line “Bank claims on public sector”)

Click on the table for better resolution and greater clarity.

(click here if table is not observable)

Posted in Bonds, Budget Deficit, Charts, Economics, Sovereign Debt, Sovereign Risk | Tagged , , , , , | 3 Comments

Quote of the Day: Golf’s Fat Tail

“The probability of Northern Ireland producing back-to-back U.S. Open champions is a lottery number, it’s bigger than that.” – Graeme McDowell

Posted in Quote of the Day | Tagged , , | Leave a comment