Dead Wood No Longer

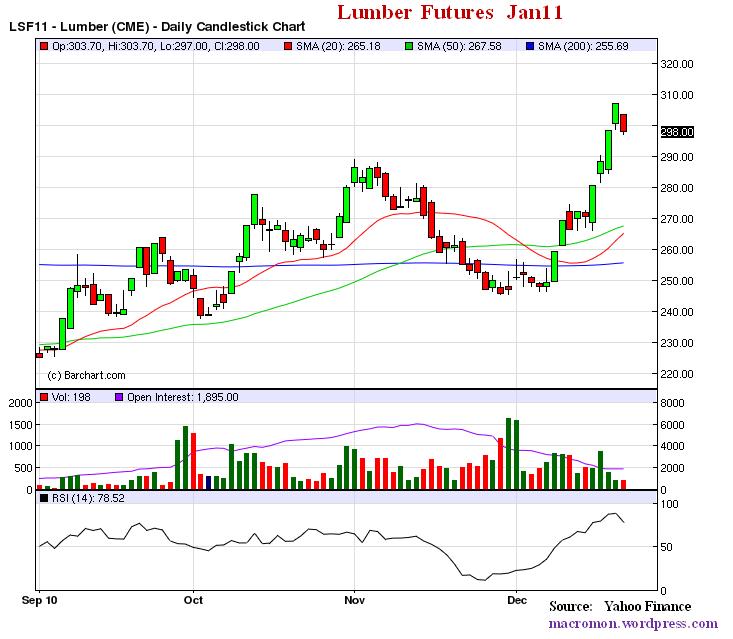
Take a look at lumber prices.  In the days of traditional monetary policy in a normal economy,  the Fed would lower interest rates and the construction sector would lead the economy out of recession.   Lumber prices were  a leading indicator.

Lumber is starting to awake from its slumber as the chart shows and the housing stocks are also perking up. Could be a head fake, but it is another piece of an improving economic puzzle.

Many will attribute the rise in lumber to China buying, but according to the Daily News Online “U.S. lumber exported to China is only 1 percent of the total Western U.S. production.”   There is no doubt, however, China is helping lift the market as exports have more than doubled on a small base, largely because a new Russian tariff has made U.S and Canadian logs more competitive.

Whatever the case,  we believe the lumber rally and rebound in housing stocks, though modest after a long decline,  is a positive leading indicator for the U.S. economy.    We have also included a chart showing the historical correlation between lumber prices and employment.

Posted in Commodities, Economics, Equities | Tagged , , | 1 Comment

Hang Seng Bounces, Sets Up Santa Claus Rally

Nice rebound in the Hang Seng, which was threatening to break the neckline of a head and shoulders pattern.  As one of our indicator species for global risk,  the Hang Seng recovery paves the way for a Santa Claus rally in the U.S. equity market.  Stay tuned!

Posted in Equities, Uncategorized | Tagged , , | 4 Comments

End of December Global Stock Returns

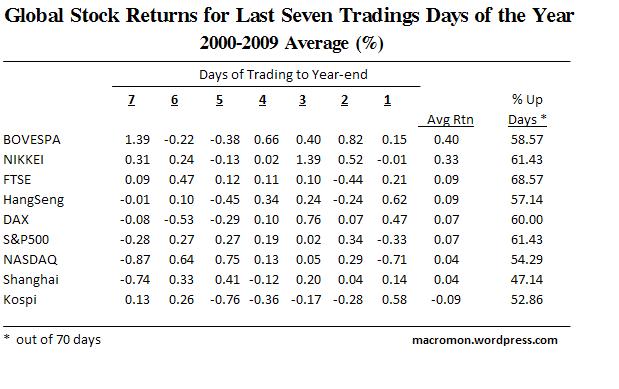
The following table shows the 2000-09 average return for each day of the last seven days of the year for the major global averages.  The number 1, for example,  is the last trading day of the year.

On average, the Bovespa is the best finisher and the FTSE trades up almost 70 percent (68.57) of days in the last 7 days of the year.   Both the NASDAQ and S&P5oo suffered large losses on the last trading day of the year in 2000 and 2001 during the dot.com collapse, which brought down their averages.

Nevertheless,   the S&P500 and NASDAQ are definitely in need of more Christmas Spirit.  Maybe this year?

Posted in Equities | Tagged , , , , , , , , | Leave a comment

Increase in Petroleum Deliveries Signals Stronger Economy

A good friend and one of the best energy hedge fund managers sent this over this morning. It is from Downstream Today.com,

Total U.S. petroleum deliveries (a measure of demand) increased 6.5 percent in November compared with November 2009, evidence the nation’s consumer and industrial sectors are recovering, according to API’s Monthly Statistical Report. The step-up in fuel demand represented the largest year-to-year increase for any month in 2010..

“Fuel demand continues to strengthen, a positive sign for our economy. Gasoline deliveries are up three months in a row and distillate deliveries are up 10 months in a row over the same months in 2009,” said API chief economist John Felmy. “Stronger fuel demand tells us a recovery is underway.


Posted in Crude Oil, Economics, Energy | Tagged , , , | Leave a comment

Day of Reckoning for State and Local Governments

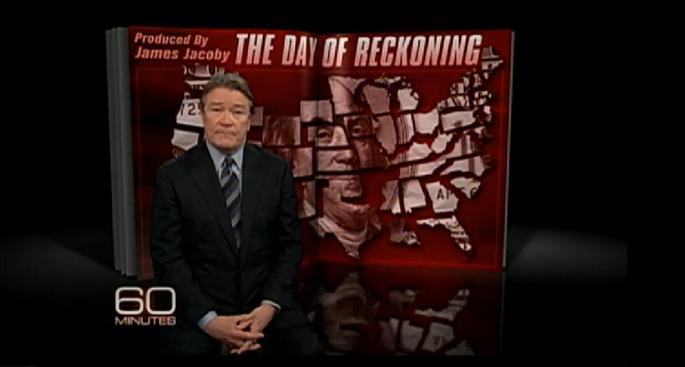
A must view 60 Minutes on the fiscal disasters of state and local governments.  Meredith Whitney and New Jersey Governor Chris Christie weigh in.  Check it out.

Click here for video

Posted in Black Swan Watch, Muni Bonds, Politics, Video | Tagged , , , , , | 3 Comments

Apple’s Seasonal Trading Pattern

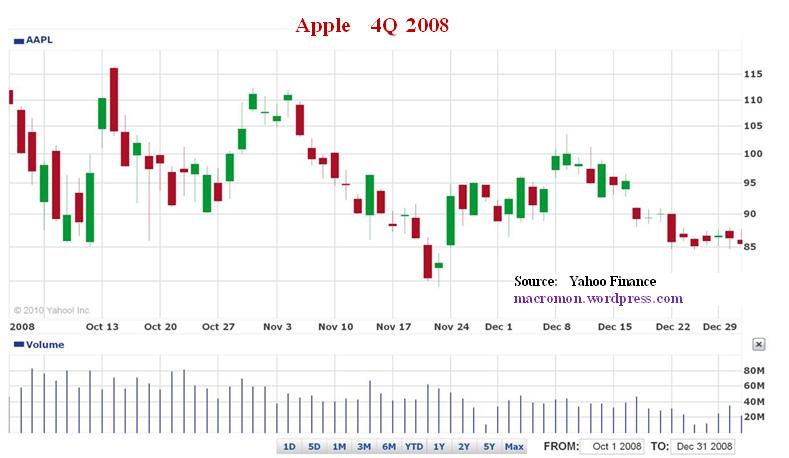
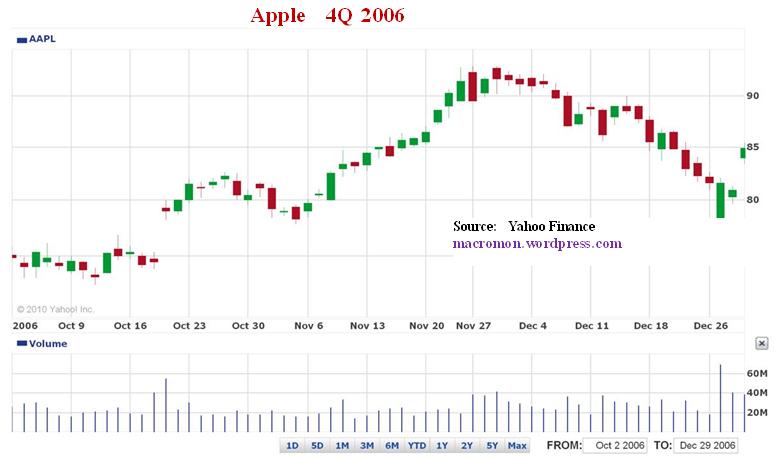
Lot’s of chatter how poorly Apple is trading.  We’ve looked at the past six years of December trading and this year’s action is no different from the ghosts of Christmas past.  After popping on the October earnings announcement, the stock gives some back and trades in a range before finishing strong in the last two weeks of the year, though 2005 was a strong sustained move up.   Even during the 2007-09 bear market, the stock traded in a similar pattern.


Posted in Charts, Equities | Tagged , | Leave a comment

Is Gold Just a Fear Trade?

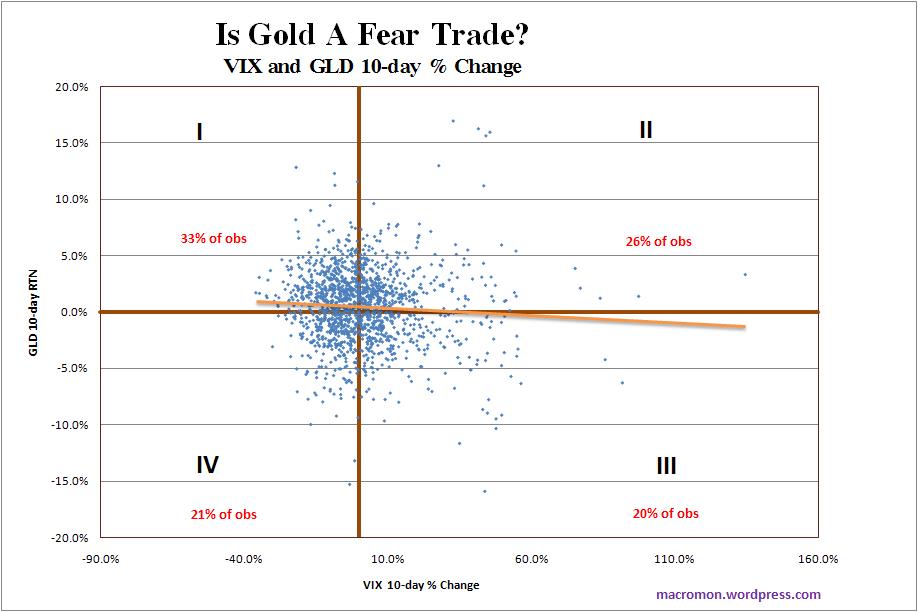
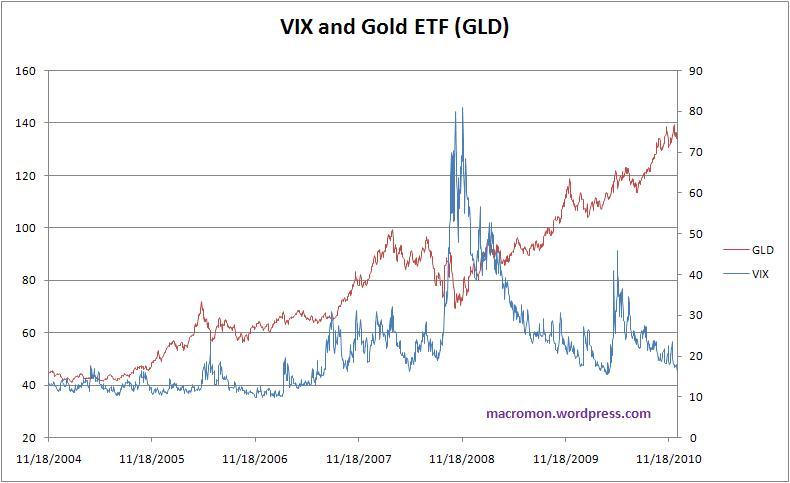
We hear a lot of noise today about how fear is dissipating with the collapse of the VIX and that the gold trade is therefore over.  This motivated us to look at how the GLD trades with big moves in the VIX to confirm if gold is really driven mainly by fear.

We looked at 10-day % changes in both the VIX and GLD and charted the observations on the scatter plot below.   If gold were purely a fear trade, the two should consistently move together and the majority of the observations should be in Quadrant II & IV.  This is not case, even for large moves in the VIX.

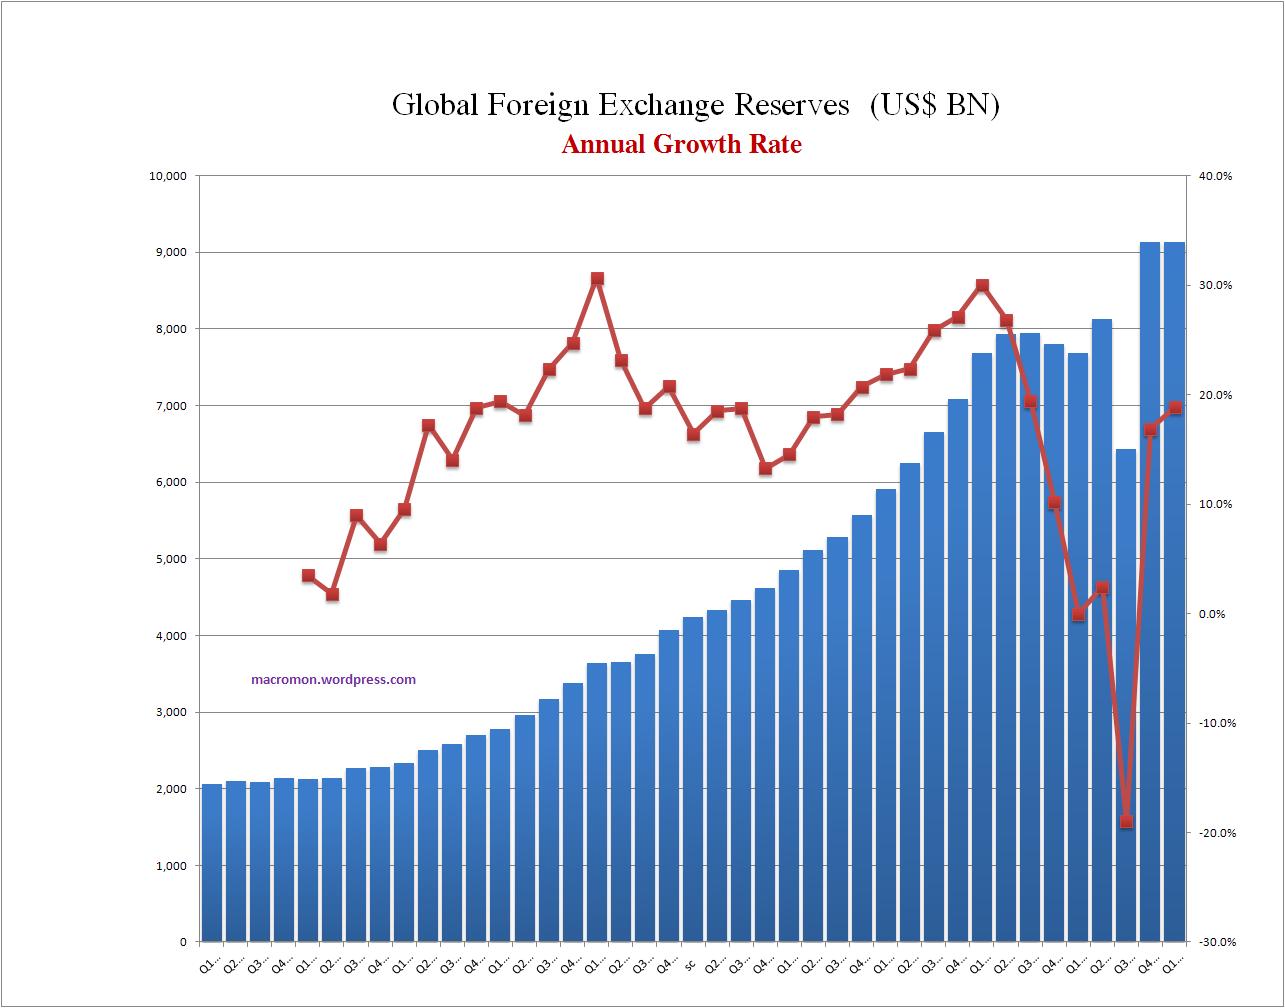
We have written of our belief that the big driver of gold going forward will be central bank buying and their need to diversify massive foreign exchange reserve holdings.  The average central bank portfolio maintains a 90% allocation to the dollar and euro, both, of which, now have serious “store of value” risks.

To illustrate the potential buying power of central banks, we constructed the following table to show how much gold China and Brazil would need to buy in order to reach a similar gold allocation of their fellow BRICs, Russia and India.  That is, to move from “Straw BRICs to Gold BRICs.”    To reach the average of Russia and India’s reserve allocation to gold of  7.4%,  China and Russia would have to buy about 3,600 tonnes of gold, which is more than three times the total gold holdings of GLD!

Because we believe central banks will be the major driver in 2011, it is our opinion gold will outperform silver next year.

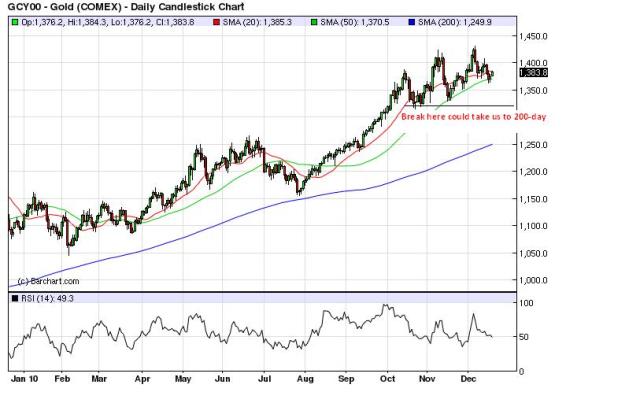
Gold is, again, testing and holding its 50-day moving average, though we wouldn’t be surprised to see a further correction and move toward the 200-day moving average as the global rise in real interest rates puts more pressure on the metal.   We don’t think the rally is over, however,  as central banks will continue to accumulate reserves and buy gold until zero interest rate policies and quantitative easing begins to reverse.

The gold trade is not about the destination, but the journey.   There is no fair or destination price for gold.  And the journey upward will continue as long as zero interest rates remain in place and central banks continue to print money and accumulate foreign exchange reserves.

Posted in Gold, Monetary Policy | Tagged , , | 3 Comments

All About Gold With Charlie Rose, James Grant & Co.

Be sure to catch the must view Charlie Rose’s December 6 show on Gold with James Grant, editor of Grant’s Interest Rate Observer, John Hathaway of Tocqueville Asset Management,  and Peter Munk, chairman and founder of Barrick Gold.

Click here for video


Posted in Commodities, Gold, Video | Tagged , , , , | Leave a comment

POMO Squeeze – Bonds Rally

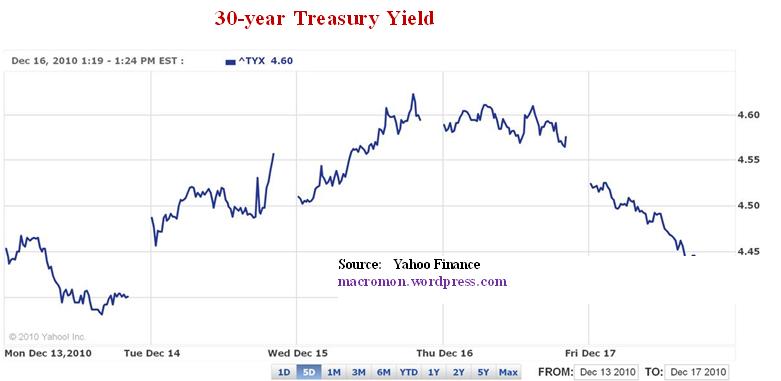
The Fed really got its money worth today, buying $2 BN of bonds with maturities in the range of  08/15/2028 – 11/15/2040.    Long-term interest rates fell 10-20 bps.  Just another example of how bonds behave when the parents are home.  We wrote about the potential for POMO squeezes earlier this week.

Posted in Bonds, Monetary Policy | Tagged , , | Leave a comment

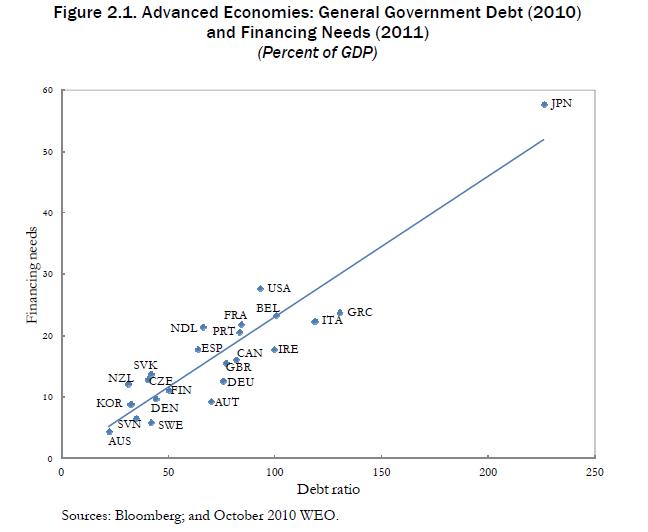
Rollover Risk 2011- Sovereign Financing Needs

Sovereign rollover risk will be one of the major issues to monitor for 2011.   The following are some key data tables and charts produced by the IMF.   The most vulnerable countries to a rollover shock and/or failed bond auctions are those dependent on foreigners.

Posted in Black Swan Watch, Bonds, Budget Deficit, Economics, Fiscal Policy, PIIGS, Sovereign Debt, Sovereign Risk | Tagged , | 1 Comment