iPad2 expects monthly sales of 6M vs current 4M per quarter

Taiwan’s Digitimes writes,

Apple has reportedly added two additional touch panel makers, Chimei Innolux and Cando, to its touch panel supplier list for iPad 2 in addition to current suppliers Wintek, Sintek Photronics and TPK Touch Solutions due to expanding market for the tablet PCs, according to industry sources.

Apple’s orders of iPad 2 are expected to top six million units a month compared to a volume of four million units a quarter for the current version, pushing Apple to expand the number of touch panel suppliers, the sources noted.

Massive growth!  Not sure if this is new news and/or already priced,  but should make for an interesting options expiration.   Apple has been freebasing for the past two months after its massive run-up into the October 17 earnings release.  Giddy up!


Posted in Charts, Equities | Tagged , | Leave a comment

Hang Seng Index – Indicator Species for Global Risk?

We like to look at Hong Kong’s Hang Seng Index as the “indicator species” for global risk appetite.   Over our 25 years of trading, we have noticed that the Hang Seng tends to lead most risk markets and is usually first on and first off.    This is reflected in the chart below where the Hang Seng has led the S&P500 during the past year, though was a more reliable leading indicator of “risk off.”  Note, the Hang Seng led the correction in January and April by several days.  

The Hang Seng and Gold ETF chart is quite stunning to us, not just how closely they have tracked on a directional basis over the past three months, but the fact they trade in different time zones.  Even though the gold market basically trades around the clock, the Hang Seng index closes at 3:00 AM  New York time, more six hours before the GLD opens for trading.

This confirms our suspicion the index is a leading indicator for global risk appetite and why we are watching the current divergence between the Hang Seng and S&P500 very closely.  The Hang Seng is threatening to break the neckline of a head and shoulders pattern it has been carving out since early October.   Meanwhile, the S&P500 is breaking to new highs.

The Hang Seng is reacting to China’s attempt to arrest the massive credit expansion that is now pushing up inflation.  The tightening is causing market tremors and worries of a hard landing in the property market, which we have written about.

Many analysts are making the case that the U.S. will be the best equity market in 2011 as Europe struggles with a debt and existential crisis and Asia and the emerging markets are in the early innings of a tightening cycle.  Improving economic fundamentals in the U.S. will thus outweigh these negative factors,  allowing America’s stock market to decouple from the rest of the world, which could be cause of the current divergence.

The argument makes sense to us and we tend to lean in that direction, though we are not certain and will always remain flexible as not to be broke(n).   But, if the Hang Seng breaks hard here,  as a matter of principle based on history, we will reduce risk and reassess our 2011 outlook.  Keep it on your radar!

Posted in Charts, China, Equities | Tagged , , , , | 21 Comments

U.S. Energy Use Flowchart

Click chart for better resolution.

A quad is a unit of energy equal to 1015 (a short-scale quadrillion) BTU,[1] or 1.055 × 10¹⁸ joules (1.055 exajoules or EJ) in SI units.

The unit is used by the U.S. Department of Energy in discussing world and national energy budgets. The global primary energy production in 2004 was 446 quad, equivalent to 471 EJ. [2]

Some common types of an energy carrier approximately equal 1 quad are:

  • 8,007,000,000 Gallons (US) of gasoline
  • 293,071,000,000 Kilowatt-hours (kWh)
  • 36,000,000 Tonnes of coal
  • 970,434,000,000 Cubic feet of natural gas
  • 5,996,000,000 UK gallons of diesel oil
  • 25,200,000 Tonnes of oil
Posted in Charts, Crude Oil, Energy | Tagged , | Leave a comment

Chart of the Month: In your FACEbook

This has to be one of the coolest charts of the year.  From the Economist,

PAUL BUTLER, an intern at Facebook, has created a striking map that shows the volume of friendships between particular parts of the world. As he explains on the company’s website:

I defined weights for each pair of cities as a function of the Euclidean distance between them and the number of friends between them. Then I plotted lines between the pairs by weight, so that pairs of cities with the most friendships between them were drawn on top of the others. I used a color ramp from black to blue to white, with each line’s color depending on its weight. I also transformed some of the lines to wrap around the image, rather than spanning more than halfway around the world.

After a few minutes of rendering, the new plot appeared, and I was a bit taken aback by what I saw. The blob had turned into a surprisingly detailed map of the world. Not only were continents visible, certain international borders were apparent as well. What really struck me, though, was knowing that the lines didn’t represent coasts or rivers or political borders, but real human relationships. Each line might represent a friendship made while travelling, a family member abroad, or an old college friend pulled away by the various forces of life.

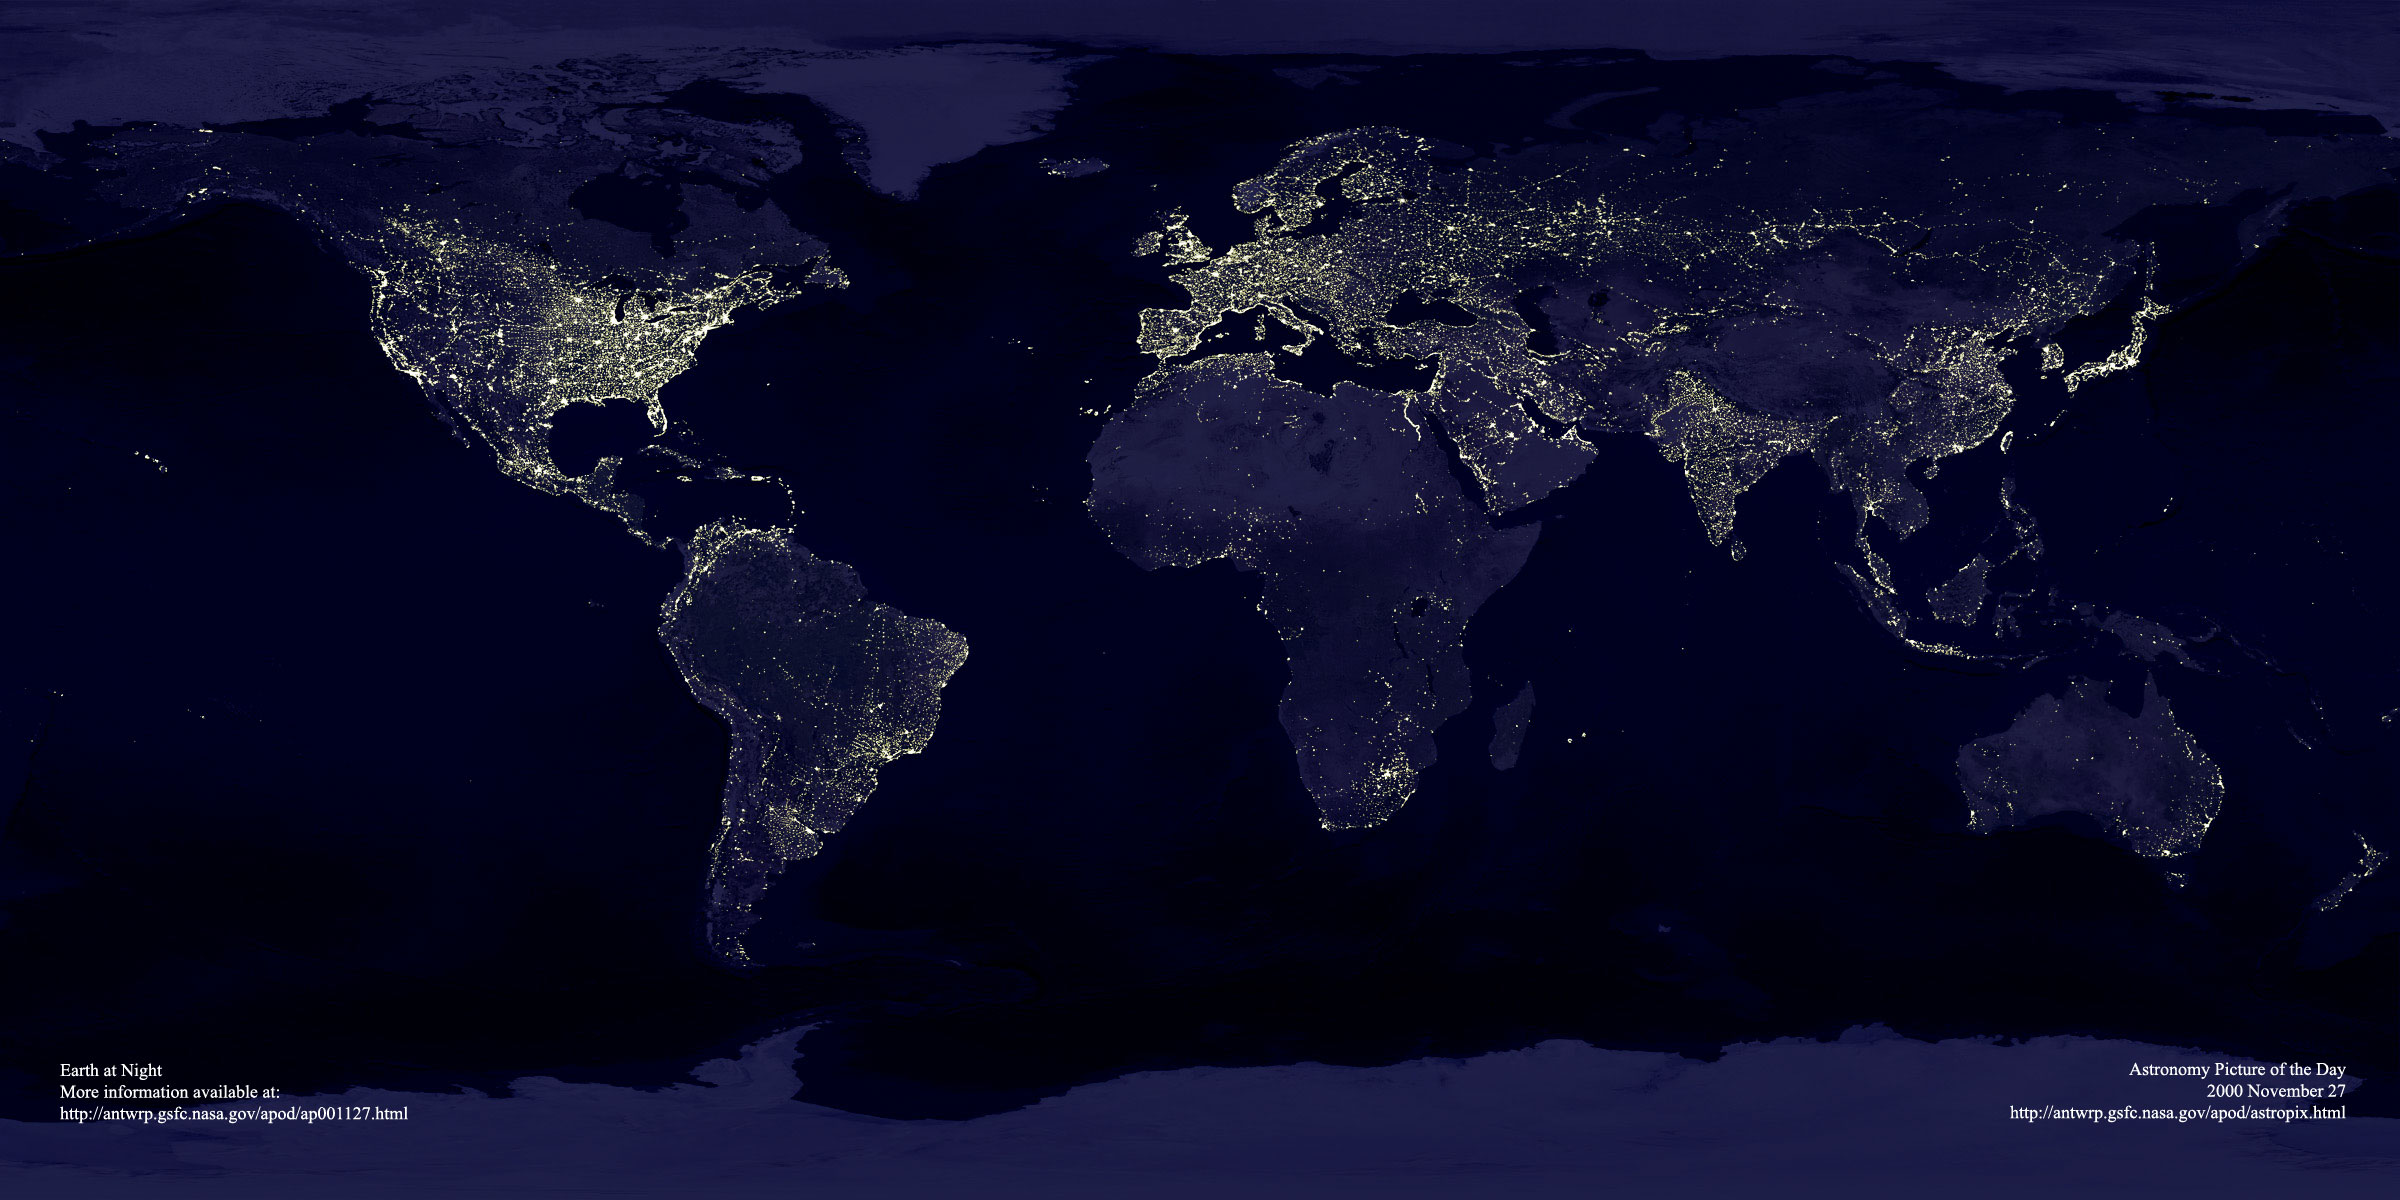
The map is indeed surprisingly detailed, at least in the parts of the world where Facebook is widely used. A detail showing South Asia is shown above; Indonesia, which recently overtook Britain to become Facebook’s second-largest market, is prominently illuminated. The parts of the world where there are few people remain in darkness, as do countries where Facebook is not the dominant social network (Brazil) or is blocked (China). For a full explanation of how the map was created, check out Mr Butler’s note. His map is, of course, reminiscent of the NASA image from 2000 showing the Earth at night, in which populated areas are brightly lit. But it was derived in a completely different way.


Posted in Charts, General Interest | Tagged , | Leave a comment

How is Money Defined?

Be sure to catch Krugman’s post, What is Money? We have issues with his extreme partisanship, but the economics of the piece is excellent.  He raises some very good points on how difficult it is even just to define money, much less measure it.  Krugman writes,

But here’s an even more basic question: what is money, anyway? It’s not a new question, but I think it has become even more pressing in recent years.

Surely we don’t mean to identify money with pieces of green paper bearing portraits of dead presidents. Even Milton Friedman rejected that, more than half a century ago. For one thing, a lot of those pieces of green paper are pretty much inert — sitting outside the United States, in the hoards of drug dealers and such. For another, checking accounts are clearly a close substitute for cash in hand.

Friedman and Schwartz dealt with this by proposing broader aggregates –M1, which adds checking accounts, and M2, which adds a broader range of deposits. And circa 1960 you could argue that those aggregates were good enough.

But now we have a large shadow banking system, in which things like repo serve much the same function as deposits; M3 used to capture some of that, but the Fed discontinued it, in part I think because it wasn’t clear which repo belonged there, and data on repo not involving primary dealers is scattered. Whatever.

The truth is that these days — with credit cards, electronic money, repo, and more all serving the purpose of medium of exchange — it’s not clear that any single number deserves to be called “the” money supply. Intellectually, this isn’t a problem; nor is there necessarily a problem maintaining monetary policy even if there isn’t any single thing you’re willing to call money. Mike Woodford has been writing about this stuff for years.

The classical definition of money — medium of exchange, unit of account, and store of value — is becoming increasingly blurred.

The Fed actually considered including equity mutual funds in the money supply figures at one time.  As the international reserve currency, the dollar is losing its role as a store of value to gold and other commodities.  OPEC, the Chinese, Russians, and others constantly threaten to ditch the dollar as a medium of exchange and unit of account in their international transactions.    Finally,  of the $900 BN of currency circulation, 50-70 percent is held outside the U.S.

This is one of our favorite topics and we will have more in future posts.

Posted in Monetary Policy | Tagged | 4 Comments

Holders of U.S. Public Debt

The best table we’ve seen on the U.S. government’s major creditors.  Nice compliment to our Dec11 post, Who’s Funding the U.S. Budget Deficit.  The U.S. government’s  fiscal year begins October1 and ends September 30.

Posted in Bonds, Budget Deficit, Economics, Fiscal Policy, Sovereign Debt | Tagged , , , | 2 Comments

Euro Fracture: Germany’s House Party Revolt

Go no further than the chart below to understand the resentment and anger among the German taxpayers who are being asked to clean-up the “House Party” of fellow EU members.   The chart shows the housing bubbles of Ireland and Spain against the German market, which experienced no appreciation in the 1999-2010 period.

It also illustrates the root cause of the stress in Ireland and Spain, where the sovereigns are effectively on the hook for a banking system buried in bad mortgages.  The Spanish housing market has only just begun its price adjustment and appears has more to go on the downside.

America’s Tea Party revolt got its start in early 2009 with Rick Santelli’s rant on the floor of the Chicago Merc about taxpayers being forced to “pay for [their] neighbor’s mortgage that has an extra bathroom and can’t pay their bills.” (see video)   The result was the trouncing of President Obama and the Democrats in the November mid-term elections.

Now,  imagine the German taxpayer, after watching what took place in the Irish and Spanish housing markets as their homes essentially flatlined for a decade, being asked to clean-up the party they never attended.  Sure, German exports benefited from their bubbles, but we’re talking “politics of resentment,” where rational debate takes a back seat to emotion.

Karl Heinz Daeke,  president of the German Taxpayers Association in Berlin,  wrote this weekend,

We are on the brink of a transfer union, where huge amounts of money are channeled from richer to poorer countries. And Ireland isn’t even poorer than Germany. According to the International Monetary Fund, Ireland’s gross domestic product per capita is about 35,000 euros ($47,000), higher than Germany’s 31,000 euros. Taking purchasing power into account doesn’t change anything…

The Irish problem is mainly bloated banking and construction industries. Here, a painful downsizing and realignment is necessary. The Irish boom — especially in real estate — was unsustainable. Prices probably need to come down further. The losses inflicted by that must not be put on shoulders of taxpayers.

Ever since the financial crisis began, German taxpayers have urged the government not to let lenders off the hook. During the boom, we saw huge profits in private industry, welcomed and fostered by governments. More and more people thought they could get rich by selling each other real estate. German taxpayers weren’t part of that game, so they shouldn’t have to bear the brunt of bad investments. Private losses shouldn’t be socialized.

Interesting. 

Related Articles
Bailouts Test Limits of Taxpayer Tolerance –Karl Heinz Daek
German MPs clash on future of eurozone – FT

Posted in Black Swan Watch, Bonds, Budget Deficit, Economics, Euro, Fiscal Policy, Sovereign Debt, Sovereign Risk, Video | Tagged , , , , | Leave a comment

Europe’s Big Fail…

One lesson we have learned during the financial crisis is that a country’s banking system is an indirect liability of the sovereign.  That is, unless the government is willing to allow banks to fail and let the domestic financial sector collapse.  We define failure here as depositors, CD holders, etc, losing or having their savings frozen.  This is very different from the bank failures in the U.S., for example, where the government through the FDIC closes banks with no disruption to the deposit base.

Early in the crisis, the ECB put pressure on the Irish government to backstop its banking sector in order to prevent a run and financial collapse.  Irish banks, still on life support and in need of liquidity to fund a deteriorating balance sheet, continued to draw massive amounts of funding from the ECB.   These bank liabilities to the ECB are now effectively the liabilities of the Irish government.

Spain is in a similar situation, where the government’s sovereign liabilities look manageable but is drowning in explicit, implicit, or the  expected backstopping and  a weak financial  system.  Kenneth Rogoff, professor at Harvard University, and was formerly chief economist at the IMF, writes,

Spain is a more difficult case. The central government is arguably solvent, but a significant chunk of municipal and provincial bank debt seems underwater. The big question in Spain is whether, as in Ireland, the central government will allow itself to be gamed into taking on private (and also municipal) debt. Here again, history gives no cause for optimism. It is very difficult for a central government to sit on the sidelines when the economy’s key players are on the brink of collapse.

Backstopping the banking system without access to a printing press or central bank has proven to be a disaster. Imagine if the State of California were to backstop the liabilities of its banks, for example.

The destabilizing feedback loop of deteriorating sovereign fundamentals due to explicit/implicit bank guarantees, coupled with the”lack of a lender of last resort” to the financial system, is extremely difficult to address as the Eurozone is now finding out.

The upshot?   Don’t bank on the sovereign analysis of analysts who cover overbanked countries without a central bank.

Related Articles
Germany Stiffens Opposition to Bigger Bailout in Crisis Face-Off With ECB – Bloomberg Disagreement over EU debt crisis measures deepens – AP
The Euro at Mid-Crisis – Ken Rogoff

Posted in Black Swan Watch, Budget Deficit, Euro, Fiscal Policy, PIIGS, Policy, Sovereign Debt, Sovereign Risk | Tagged , , | 1 Comment

Rollover Risk: Moody’s Warns on Spain

“Rollover risk” will be a major theme in 2011 and Moody’s is getting an early start.  Bloomberg writes,

Spain had its Aa1 local and foreign currency government bond ratings placed on review for possible downgrade by Moody’s Investors Service.

The ratings company cited Spain’s “vulnerability to funding stress given its high refinancing needs in 2011,” according to a statement today.

Moody’s also sees for Spain a “potential further increase in the public debt ratio should the cost of bank recapitalization prove to be higher than expected so far.”

There are “increased concerns over the ability of the Spanish government to achieve the required sustainable and structural improvement in general government finances given the limits of central government control over the regional governments’ finances,” Moody’s said.

A picture is worth a thousand [128] billion words euros.

Posted in Bonds, Budget Deficit, Euro, Fiscal Policy, PIIGS, Sovereign Risk | Tagged , , , | Leave a comment

10-year Spike: 70 Bps, 14 days

The rapidity of the spike in long-term Treasury rates  is starting to raise some eyebrows. The yield on the 10-year bond has increased 70 bps in just 14 days.

We have identified thirteen similar moves, where rates initially spiked 70 bps in 14 days and looked at how rates and the S&P 500 subsequently behaved 10/30/90 days after the move.

In six of the thirteen cases, the S&P 500 was down by 3 percent or more 30 days after the rate spike.  In three of these cases, the 10-year continued to move higher by at least 20 bps over the next 30 days.   The most infamous was the 300 bps spike in 1987, where the 10-year moved from 7.01 percent in mid-January to 10.23 percent just prior to the October stock market crash.

In some cases, the rate spike signaled improved economic and financial conditions such as the case  in the March 1999, shortly after the Russian Debt Default and collapse of Long Term Capital.  This was followed by a massive stock move, which ultimately proved to be the final leg and blow-off top of the dot.com bubble.

The chart below does show interest rates and the stock market can move higher together over relatively long periods, which we believe will be the case if policymakers begin to address the structural imbalances in the economy.    Though rates are currently moving off historical lows, and such a big move is not surprising, there is, however, added uncertainty on the message of move given the current environment of large deficits and heightened sovereign risk.

We strongly urge the politicos not to be complacent and dismiss the rate move as confidence the economy is improving, even if it does partially explain the increase.  Washington should rather take it as a “Sputnik moment” and further motivation to address and develop long-term solutions to the country’s budget deficit and debt overhang.   Failing to do so will make what happened in 1987 look like a walk in Central Park.

Posted in Black Swan Watch, Bonds, Budget Deficit, Charts, Equities, Fiscal Policy, Politics, Sovereign Debt | Tagged , , , | 4 Comments