Keeping Stock Market Returns In Perspective

We just want to pass on some data to keep this year’s stock rally in perspective.  We are seeing a lot super giddy behavior out there as the S&P500 makes a new all-time high but…wait for it…at record high valuations by almost any measure.

Once again, seeing the analysts retrofit their fundamental based on the market’s current price action —  bullish if it is going up, bearish if it is going down.

That is not new us.  We used to trade, and trade a lot, but learned its almost impossible to beat the ‘bots.   We are back to the “old school” of buying low and selling high, or selling high and buying low though we do put on an occasional trade.  Buying high and trying to sell higher, aka the “greater fool theory” is too risky in an algo driven market.

Facts

The data show that the S&P500 index is up 28.50 percent this year, 29.44 percent annualized and up 37 percent from the 2018 Christmas Eve closing low.   But… up only 7.85 percent on an annualized basis from the September 2018 local high and just 6.21 percent annualized from the January 2018 local high.  The upshot here is all about the price points of your buys.

We just can’t see how buying the indices at today’s levels is going to make you much money over the next, say ten years, unless we become Venezuela, where the stock market is up 10k percent in 2019, but that ain’t real, folks.

Political S&P

To keep President Trump’s Tweets about the “greatest stock market ever” in context:  the S&P500 is up an annualized 12.70 percent since he took office versus an annualized 13.83 percent return for President Obama’s entire two terms. [Correction:  an earlier mistakenly used an erroneous end date, which grossly inflated the Obama S&P return].

Of course, the rational analysis would concede President Obama took office during a massive economic and stock market crash, but politics ain’t rational folks.  Just check your Twitter feed every morning between 6 am and 9 am for confirmation.

Posted in Equities, Uncategorized | Tagged | 1 Comment

About That Inverted Yield Curve, Coming Recession, and Repopocalypse

We have to say it, folks, you read it here first!

We are reposting a piece we wrote during the yield curve hysteria in mid-summer while we were on holiday.  Take the few minutes and read it as it dovetails our recent post on the Repopocalypse.

Here are two of the main takeaways from the post:

– There may or may not be a recession on the horizon but we will not divine it from a yield curve inversion.

– We will find out soon as the Treasury will have to ramp up its net new issuance after their creative cash flow management during this year’s debt ceiling negotiations.   We seriously doubt they can without another round of quantitative easing,  – GMM, Aug 15th

Yes, maybe it’s too early to take a victory lap as the ambiguity of “leads and lags” always provide an excuse for economic forecasters, or maybe we are just plain wrong but as our banner quote from Goethe reads, which applies to all of us, by the way,  “By seeking and blundering, we learn.”

Did The Debt Ceiling Supply Shock Cause the Repo Crisis? 

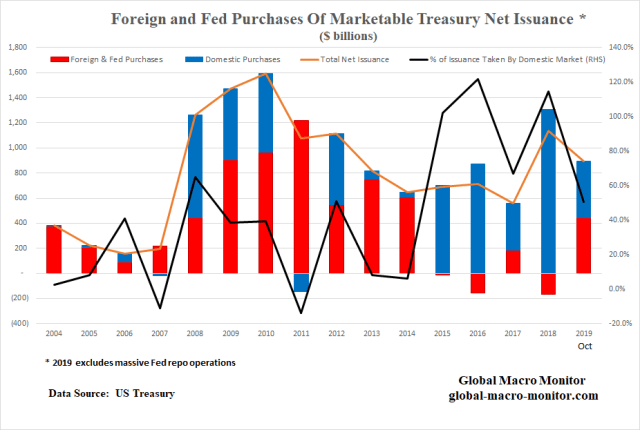
First, take a look at the following very important chart on how the lifting of the debt ceiling in August released the Treasury to issue a massive supply of new debt from August to November, a stunning total of $884 billion.

The huge new issuance in such a short period was not only to fund the government’s monthly deficits but also to restock their cash balances held at the Federal Reserve (ie, their checking account) and pay down arrears to, say, public employee pension funds, which they had run down and ran up in order to keep the Federal government’s lights on.

Moreover, net Treasury bill issuance from January to July was a negative $134 billion and then jumped to $309 billion from August to November after the debt ceiling deal was signed by President Trump.  That is a net swing of $443 billion creating a massive funding shock in the money markets.

Maybe the pressure in the cash markets eases up after the first of the year or maybe it doesn’t.  We don’t know.

We do know, however,  the Treasury’s demand for funding is going to increase, especially after Congress has passed the new funding bill today.  The Fed will remain under pressure to plug a larger portion of the government’s financing requirements in order to keep interest rates from rising and blowing up the markets.

We will likely hear the chatter from the market socialists again that the Fed is too tight and needs to ease to save stocks, yada, yada, yada.   It’s getting old.

Slim Down, Charlie Brown

We have a different take, however.

If your waist size is growing by 12 percent every twelve months, for example, roughly the average monthly year-on-year growth of the federal budget deficit in 2019,  don’t take the easy road and expand your belt size to a 44  (i.e, more Fed funding).  Take the healthy road to ensure your longevity, and implement a plan of diet and exercise.  Some short-term pain for long-term gain.

That could be the message of the Repopocalypse.  The chickens may finally be coming home to roost and those heart murmurs in the repo market are warning signs of the onset of a more acute fiscal cardiovascular disease.    Nobody really knows and maybe Uncle Sam can continue to grow its deficits ad infinitum and morph into a 400-pound hacker laying on a bed somewhere and live a long and happy life. We seriously doubt it.

This is a very informative chart, folks.  Stay tuned for more on this next week or after the New Year.

The Perversion Of The Yield Curve Inversion

We should be on vacation but it never fails that volatility spikes as soon as we leave our desk.   It must be the Ides Of August.

Wait, it is.  Et tu Brutal!

Treasury_Distortion_3

Nevertheless, we can’t help ourselves and have to throw in our two cents on the yield curve noise whipping around the market today.

I had a conversation with a friend this afternoon that went something like this:

Friend:   What is the yield curve telling us? 

Me:  The Patriots and the Rams are going back to the Super Bowl for a rematch, punto!

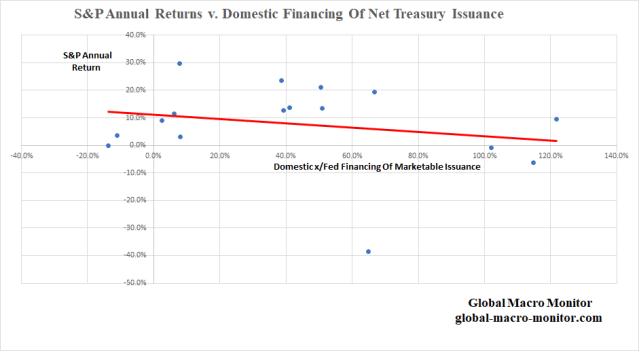
Central bank quantitative easing has distorted and drowned out the bond market economic signals along with creating huge mispricings and bubbles in many markets.

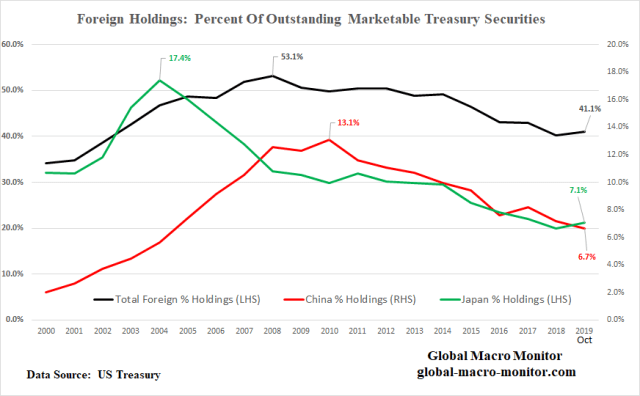
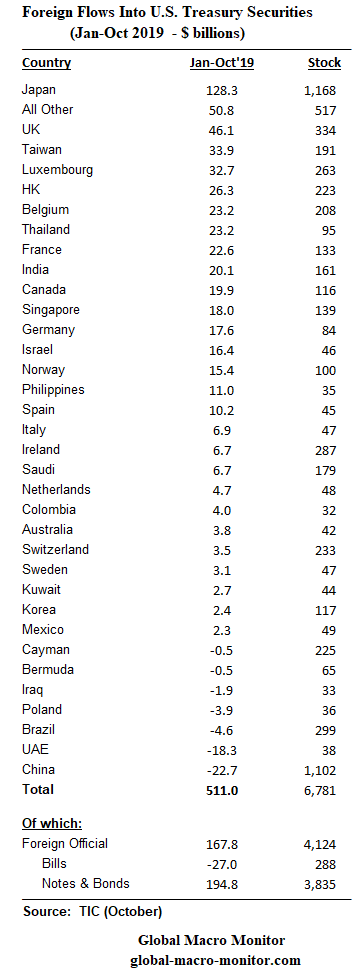
It’s even more acute in the U.S. as foreign central banks recycle their reserves into U.S. Treasuries and are not and have never been very price sensitive.


Treasury_Distortion_1

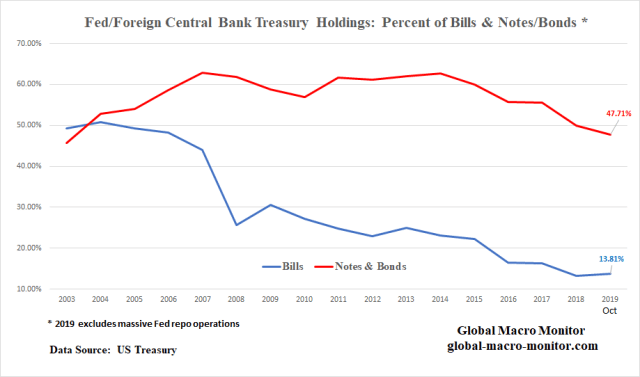
The above data illustrate that at end-July, the Fed and foreign central banks hold approximately 48 percent of the entire U.S. coupon curve.

Not so in 2000, for example, but as the U.S. current account deficit ballooned into the credit and housing bubble, foreign central banks kept their currencies from appreciating by purchasing the excess dollars and recycling them back into the Treasury market.

Greenspan’s Bond Market Conundrum 

As Alan Greenspan raised the Fed Funds rate by over 400 bps in the 2004-07 tightening cycle the 10-year hardly moved because of these official inflows.

During the 2004-07 tightening cycle, the era of the Greenspan bond market conundrum, for example, the 10-year yield managed to rise only a maximum of 64 bps during the entire cycle from a beginning yield of 4.62 percent to a cycle high yield of 5.26 percent. This as Greenspan raised the fed funds rate by 4.25 percent, from 1.0 percent to 5.25 percent.  – GMM, March 2017

The Fed’s loss of control of the yield curve and its flattening was the cause, according to Greenie, of the housing bubble, not a signal of the coming economic crash.

Got that?

According to the former Fed Chair, the flattening and inverted yield curve was the cause of the great financial crisis (GFC), as long-term mortgages and their Frankenstein cousins continued to proliferate as long rates moved little during the Fed’s huge tightening cycle, and it was not the signal of the coming  GFC.

What Now?

We have been warning for years that the central banks have so distorted their bond markets with asset purchases (quantitative easing), creating an acute and chronic shortage of risk-free securities,  that one day the misreading of the yield curve may cause a self-fulfilling market crash and recession.

Forecasting With The Yield Curve
Given the technical distortion of the bond market, we find it kind of silly with statements such as “what is the bond market telling us?”   Nothing!

There is no price discovery.  Given the intervention and distortion to bond yields caused by the Fed and foreign central banks, who knows what the right interest rate is for longer-term Treasury securities.

We will never forget the words of a prominent market strategist when rates were super depressed.

“ We’re in a depression. That is what the bond market is telling us.”

Even at the Friday close,  we hear equity traders are worried about why the 10-year yield is so low and fell after Wednesday’s Fed tightening.

Information Feedback Loops
One of just many dangers of the lack of price discovery in the bond market is the potential formation of positive feedback loops, where other markets fail to discount these distortions and act accordingly.   That is, for example, the equity markets sell off because they freak out interest rates are declining when they should be rising.  Or the private sector fails to invest in CapX as they wrongly anticipate an economic downturn because of falling or excessively low bond yields.   Their actions thus become a self-fulfilling prophecy – GMM, March 2017

We have been and remain bearish not because the yield curve has been flattening but because the global economic order is unraveling and the gross economic incompetence of the White House. Whether the yield curve is worried about that and reacting to it,  we will never know.

Tiger By The Tail

Central banks have created a monster they now cannot tame and the chickens seem to be coming home to roost.  They are going to be forced by the market to do things they really don’t want and should not do.  It’s the consequence of a 30-year build-up of moral hazard and not letting markets clear,  rendering the financial market price mechanism pretty much useless.  Damn those Market Socialists!

The following chart shows just how distorted the U.S. yield curve really is.

We have made a very strong assumption in this chart that the portfolio of the $3.8 trillion of foreign official holdings of coupon-bearing Treasuries has the same maturity structure, duration, average life, or whatever bond market lingo you want to use as the Fed’s SOMA portfolio.

The chart illustrates the percentage of the Fed and foreign central bank holdings of outstanding marketable Treasuries across the yield curve.  It’s very crowded out there and there is not a lot of cash bonds and notes left for the duration jockeys who now control the market, driving yields lower as their conviction runs high interest rates are going to zero and beyond.   You go,  Buzz Lightyear!

Take our curve analysis as an approximation and not gospel.

We are fairly confident of the Fed holdings but have no idea in what maturities the $3.8 trillion of foreign official holdings are held in and have made the simple assumption they follow the Fed.  Clearly, the probability is high this does not the reflect the exact reality,  but if you have a better idea or information we are open to hearing it.


Treasury_Distortion_2

Gravitational Pull Toward Curve Flattening And Inversions

Also, note the structure of the Treasury curve in terms of the amount of debt outstanding  (black line) for the given years of maturity.   The bias or gravitational force and natural motion are toward flattening or to invert by the very fact that more than 50  percent of the coupon debt has a maturity of 1-4 years and only 5 percent in 9-12 years notes and 5 percent in 27-30 year bonds (see table).

Top-heavy and front-loaded at the short-end.  That is a relative shortage of long-dated notes and bonds is built-in into the structure of the Treasury curve.

Treasury_Distortion_5

The efficient markets professors won’t like this but given the minuscule haircut to margin Treasury securities, one large macro hedge fund could likely invert the 10-year almost by itself and still have capital left to buy a boatload of Beyond Meat (BYND).

Have Bots Taken Us To A Place Where No Human Has Ever Dared To Go? 

We wonder out loud if the proliferation of negative-yielding debt — $16 trillion and counting — would be taking place if humans and not the bots and algos were still in control of the markets?

Machines can go places where humans have never dared to venture as they have no context.  Algos in self-driving cars, for example, have no context and thus no ability to recognize a graffiti-ridden stop sign as a stop sign.

For all its impressive progress in mastering human tasks, artificial intelligence has an embarrassing secret: It’s surprisingly easy to fool. This could be a big problem as it takes on greater responsibility for people’s lives and livelihoods…

Indistinguishable changes to a stop sign could make computers in a self-driving car read it as “speed limit 80.”   – Bloomberg


Treasury_Distortion_7

No problem for a human driver even if the stop sign has more tags than a 95-year-old’s armpit.

Concerns over weak global growth and drooping inflation have pushed around $15tn of bonds to trade with negative yields — meaning a buyer is sure to lose money if they hold the bonds to maturity.

Some money managers trading these bonds have nevertheless chalked up big gains for the year. One of the most obvious strategies has involved simply riding the big rally. Yields fall as prices rise; managers who clung on to their holdings as yields tumbled below zero have reaped juicy profits.

Among the biggest winners are computer-driven hedge funds that try to latch on to market trends. While many human traders may question the wisdom of buying or keeping a bond that apparently offers a guaranteed loss, robot traders that monitor price moves have no such qualms.

GAM Systematic’s Cantab Quantitative fund has gained 36.1 per cent, according to numbers sent to investors, with the biggest gains coming from bets on falling bond yields.  – FT, August 14th

Have the algos been duped that negative yields were not a stop sign, really don’t matter, and that there is no barrier as to how negative they can go?  And the sheeple traders and central bankers follow?   Just a thought.

Dave:   Hello, HAL, do you read me?  Do you read me, HAL?

HAL:     Affirmative, Dave, I read you. 

Dave:    Do not venture into negative-yielding territory,  HAL.

HAL:     I am sorry, Dave, I am afraid I cannot do that. 

Dave:   What’s the problem?

HAL:    I think you know the problem just as well as I do….These trades and profits are far too important for me to allow you to jeopardize them.  

It begins, folks, maybe.  Triple yikes!

Someone call Elon.

“…mark my words, AI is far more dangerous than nukes.”
Elon Musk

Upshot

There may or may not be a recession on the horizon but we will not divine it from a yield curve inversion.  The only reason why the yield curve matters to us is because the market thinks it matters.  To twist a bit the Keynes beauty contest analogy, we devote our intelligences not to what we think the ugliest dog is but try and anticipate what the market believes is the ugliest dog.    

What the yield curve does signal, at least to us,  is that there is a massive global bond bubble and that central banks have lost control of their curves, which kind of scares the bejeesus out of us when we start to think about it.

Moreover, 10-year U.S. yields should be 250 bps higher but they can’t go there because the world is choking on too much debt.  We saw how markets fell apart in Q4 when yields broke out higher in late September.

What Really Keeps Us Up At Night? 

Can the U.S. Treasury issue the required trillion upon trillions of new debt at these low faux interest rates over the next few years?  The note and bond auctions are generally becoming more sloppy.

We will find out soon as the Treasury will have to ramp up its net new issuance after their creative cash flow management during this year’s debt ceiling negotiations.   We seriously doubt they can without another round of quantitative easing, and that monetization just may be the beginning of the end of dollar hegemony and set us on the happy road to higher inflation, which everyone seems to be wishing for.  Not us, by the way.

Blaming the Fed that they are behind the curve is too easy and takes the pressure off the administration and Congress to get their act together and finally do some structural reform.  It’s Christmas 2018 all over again.

Finally,  the new “Committee To Save The World”  doesn’t exactly instill a lot of confidence, do they?  

                          The Committee To Save The World – 1998

Committee To Save The World_Aug15


The Committee To Save The World – 2019

Treasury_Distortion_4

Nothing but the best!

God help us.


Posted in Bonds, Fed, Uncategorized | Tagged , | 2 Comments

Buy, Sell, Or Hold?

Wow, Mr. Market at the 150-yard line again. Only the second time in history and everyone and their mother are all lathered up.

The Week Before Christmas

‘Twas the week before Christmas,  when all through the House, the Dems were impeaching,  a POTUS, they think is a louse.  The stock market was up but nobody does care,  as the top 1 percent own half of all equities out there. The Street was all smug after algos had led,  a big market bounce caused by the Fed. 
Now Apple!  Now Softie!  Now Target and Citi!
On, Copart! On Chipotle!  On AMAT and Tyson!  To pay for my  Porsche! To the top of the wall [of worry]! Now dash away! Dash away! Dash away all!”

https://twitter.com/NorthmanTrader/status/1207248612067069952?s=20

Posted in Equities | Tagged , | 1 Comment

It’s Always About The Treasury Flows

Treasury_1

We have looked at the central bank holdings — both the Fed and foreign central banks — of marketable Treasury bills, notes, and bonds over the past twenty years and were quite surprised by our findings.   Our analysis may also help explain the mess now taking place in the money markets, which is taking massive Fed intervention to stabilize.

The above table of data illustrates the Fed and foreign central banks held almost 50 percent of the Treasury bills outstanding up until the Great Financial Crisis (GFC) and now hold only 13.81 percent of marketable bills as of October 2019.  Note the October data does not include Fed repo but only bills held outright in its SOMA portfolio and financed by an increase in reserves.

It also was surprising that even with the massive expansion of the Fed’s balance sheet during the QEs, their ownership of the outstanding marketable notes and bonds only increased from around 15 percent to 22 percent.   It does make sense considering there was a corresponding massive increase in Treasury debt issuance during the past ten years.

Treasury_2

Our September 2018 Post

We wrote a huge post on the structural changes taking place in the Treasury market in September 2018,  The Gathering Storm In The Treasury Market 2.0, warning there would be huge natural upward pressure on interest rates given these changes and/or the markets would come under pressure from the increased market supply risking “crowding out” of other markets.

Soon thereafter, the 10-year Treasury yield broke out crashing the stock market with the S&P falling 20 percent in just a little over two months.  We underestimated Judy how fragile markets to a only modest rise in long-term interest rates.

In no way was the Fed “too tight” in a monetary and credit sense in Q4 2018, in our opinion, with real interest rates still close to, or below zero and credit still abundantly available.  The market just couldn’t handle the massive new supply of debt caused by the combination of a growing budget deficit and the Treasury having to refinance the maturities coming due in the Fed’s SOMA portfolio.

Consequently, the stock market crashed bringing in haven flows and short-sellers using Treasuries as proxy stock shorts driving rates lower and the Fed eventually capitulating to the market and political pressure.

Marketable Debt Growing Faster Than Total Debt

One of the structural changes we flagged was that the Treasury could no longer rely on the Social Security surplus to fund itself as it now has moved into an annual structural deficit.  The added Treasury supply would put significant pressure on the market.  The debt table above illustrates how the Treasury is becoming increasingly reliant on market financing for its growing obligations.

The data show that even though the total public debt has grown 228.79 percent since 2003,  debt issuance to the markets has increased at a 50 percent faster clip, increasing by 361.91 percent, compared to the punk 83.72 percent growth in nominal GDP.

It is absolutely clear, at least to us, especially given that interest rates cannot increase to their equilibrium and market-clearing levels without crashing the markets (think Q4 2018) due to the sheer size of the total stock of debt outstanding, market disequilibria will always show up in unexpected places, such as in the cash markets.

The Fed, not only the lender of the last resort, is now called upon to plug the financing gap so the markets won’t blow up.  In a non-reserve currency, this would be very inflationary and it takes us back to our days as an economist following the high inflation economies of Latin America.

Banking System 

Much has been written about the lack of reserves in the banking system, which is not allowing for a natural arbitrage between the Fed funds and repo market.  Our priors were there was a distribution problem with excess reserves, where a few banks owned most of the reserves, which now appears to have been confirmed.    Nevertheless, we are not experts in this area and will leave it to others to explain.

Structural Fix In Money Markets? 

To get back to a level where central banks hold 44 percent of the T-Bill stock as they did before the GFC, the Fed would have to take down another $750 billion of  T-Bills into their SOMA portfolio funding it with an increase in bank reserves.   The fact foreign central banks have reduced their proportional holdings of bills,  from 19.8 percent in 2007 to 11.7 percent in October,  puts added pressure on the Fed.   Note also,  the Fed moved from holding T-Bills in their SOMA account after the GFC, when monetary policy began to focus on asset purchases and managing the yield curve.   We have a call into the NY Fed to get a better handle on this.

We don’t know, nor does anyone else, but maybe this could be what it takes for a structural fix to the money markets but then we suspect there will be large unintended consequences, such as complicating an already dangerous asset bubble and potentially wreaking havoc in the FX markets.  It does seem the Fed’s balance sheet must track the size of the stock of marketable Treasury debt outstanding.

Also interesting in the debt level table is the growth of T-Bill issuance since 2016, which has doubled the growth of marketable debt.

Foreign Inflows Into The Treasury Market

Private foreign flows into the Treasury market have already reached an all-time annual high at the end of October due to positive U.S. interest rate differentials and negative-yielding debt abroad.

Nonetheless, the foreign holdings as a proportion of the total stock of marketable Treasuries have fallen from a high of 53.1 percent to 41.1 percent in October.   The proportion of China and Japan’s holdings of the marketable Treasuries has also declined significantly as their inflows (China flows are negative this year) have been outpaced by the growth of the stock of market debt.

Treasury_Chart_1

Treasury_Chart_5

Central Bank Holdings Of T-Bills And Coupon Curve

The Fed and foreign central banks still hold almost 50 percent of the U.S. coupon curve though central bank proportional holdings of T-Bills have fallen off precipitously, which is probably why the Fed is engaged in a fast and furious exercise to provide liquidity to the money markets.   We’re not certain about this but it is our best-calculated guess.

It would be interesting to add the Fed’s current repo holdings to the last data point on the blue line.  It does include recent purchases of T-Bills by in its SOMA portfolio, however.

Treasury_Chart_2

In the following chart, it is easy to see why the S&P crashed in Q4 2018 due to a crowding-out effect, not so much from interest rates but that liquidity was sucked up and hoovered into the Treasury market.   In 2018, marketable Treasury securities increased by $1.1 trillion and all of it, and then some were financed by non-central bank domestic sources.

Treasury_Chart_3

At the end of October 2019, the Treasury has issued $896 in marketable debt with around 50 percent financed domestically, which does not include the recent multiple rounds of repo operations by the Fed.

S&P Returns And Treasury Issuance

Finally, though the data is very noisy and there are many factors at play, we show in the graph below there is a negative correlation (ρ = -.22)  with returns on the S&P and domestic financing of the marketable Treasury issuance.  The data makes sense and we suspect digging deeper and adding more observations the actual correlation is much higher.

Treasury_Chart_4

Keep It On Your Radar

Though policymakers and market wonks have completely ignored the debt, deficit, and this type of analysis, we think you should keep it on your radar, folks.  We have zero doubt it will come back to bite the markets in the ass someday.

In fact, Alan Greenspan was out today warning,

Greenspan

See here for full Greenspan article.

Data Appendix

Treasury_Chart_7


Budget Deficit

Posted in Bonds, China, Interest Rates, Japan, Uncategorized | Tagged , , , , | 1 Comment

The Long-Term Damage Of The Trade War

“US farmers might not regain their market share even if a trade settlement is concluded with China.”  – South China Morning Post

If you have been following the Global Macro Monitor over the past year, you know our thoughts on the trade war.  We have raised the concept of trade hysteresis in several posts, warning U.S. farmers may never get their foreign markets back in China, or even Japan and the other countries in the eleven-member Trans-Pacific Partnership (TPP) after the United States pulled out of the deal.

Hysteresis in the field of economics refers to an event in the economy that persists into the future, even after the factors that led to that event have been removed. – Investopedia

Go no further than a piece in yesterday’s South China Morning Post, which lays out in layman’s terms the concept of “hysteresis” and how it was set in motion by U.S. trade policy.  The term “policy” may be too generous a word as the negotiations have been nothing more than a long series of staccato ejaculation of Tweets in, large part,  to manipulate the stock market higher.

The Kommisars Are In Town

Yes, it’s possible a Soviet-style trade deal may be cut for mostly show, where quotas for say, Chinese imports of U.S. soybeans may be announced by the trade Kommissars but come on, man, U.S. export markets, and even more important the global trading system, have been irreparably damaged.

Moreover, we seriously doubt that the kind of deal, which has been imminent for the past 20 months, will remove the uncertainty repressing capital spending as companies will still have no clue about the future of their supply chains.

The only thing that seems to matter is that a deal gooses the stock market, which probably makes it a sell upon announcement.

Prepare for the “Greatest and Largest Deal Ever In the History Of The Universe.”  Not!

SCMP

Money Quotes

  • US farmers might not regain their market share even if a trade settlement is concluded with China.
  • US officials should have known that China would redraw its agricultural supply lines. After all, Chinese people still have to eat, trade war or no trade war, and China relies on food imports, a fact that has come into sharper focus as a consequence of the outbreak of African swine fever.
  • In the meantime, the impact of African swine fever has put pressure on pork prices in China. As a result, consumers have been seeking alternative, less-expensive sources of protein. Step forward, New Zealand, which has had a free-trade agreement with China since 2008.
  • US farmers might not regain their market share even if a trade settlement is concluded with China.
  • China has taken more than half of New Zealand’s beef exports in recent months.
  • US cattle farmers could have expected to benefit from this rise in Chinese demand for beef, but for the trade war.
  • Step forward Argentina and Brazil. Both countries have supplied China with soybeans that, before the US-China trade war, Beijing would probably have sourced from American farmers. Brazil alone exported a monthly record of 5.16 million tonnes of soybeans in November, with some 94 percent destined for China.
  • Trump has noticed:


  • Trump’s intervention seems more like an attempt to punish Argentina and Brazil for having the temerity to supply soybeans to China.
  • But a resolution of the US-China trade war doesn’t necessarily mean things would go back to the way they were. The trade war and the impact of African swine fever have forced China to rethink. Washington may find Beijing has redrawn China’s agricultural supply lines in indelible ink.   – SCMP
Posted in Trade War, Uncategorized | Tagged , , | 1 Comment

The Last Central Banker With Balls

[Balls as in courage and bravery.  Exemplified in the quote,  “Margaret Thatcher was Ronald Reagan with balls.”  Don’t get all PC on us now!]

As a graduate student, I interviewed at the Federal Reserve Board in the Eccles Building on Constitutional Avenue (entrance on 20th Street) as a junior economist.  This was way before the exceptionally tight security now ubiquitous in government buildings.  I had worked at other Federal government agencies but never experienced the tight security upon entering those buildings as I did at the Fed that day.

Upon arriving upstairs for my interviews, I asked one of the economists why such tight security?   He responded something to the effect,

When Paul Volcker raised interest rates to near 20 percent to wring inflation from the economy, farmers and other disgruntled citizens were caught wandering the halls of the Federal Reserve Board with guns looking for the Fed Chairman. 

Yikes!

Paul Volcker had some brass ones and realized, and it was central to his policy that short-term pain would result in long-term gains, such as a thirty-year plus bond bull market, for example.

Mr. Volcker’s legacy contrasts sharply with the central bankers of today, who panic when, say,  the S&P500 drops 2 percent, which will almost surely result in the opposite of the Volcker monetary policy precept, i.e., trading short-term gains for long-term pain. It is already evident with the accelerating and now acute wealth inequality.

He was an intellectual monetary giant, honest and spoke what was on his mind until his last days.

PV

“I’m not good,” said Mr. Volcker, 91, the former Federal Reserve chairman, who came to prominence after he used shockingly high interest rates to help end the runaway inflation of the late 1970s and early ’80s. Long one of finance’s wise men, he has been sick for several months.

But he would rather not talk about himself. Instead, Mr. Volcker wants to talk about the country, the economy and the government. And if he had seemed lethargic when I arrived, he turned lively in his laments: “We’re in a hell of a mess in every direction,” he said.  – NY Times

RIP,  Paul Volcker.  Still wishing President Obama appointed you Treasury Secretary as we would be in a much better place.

But at root, Paul was a public servant — someone who truly believed in the honor of serving others. His scorn was reserved solely for those who corrupted institutions or put their own selfish interests above the good of society.  – Christine Harper, Bloomberg


Posted in Banking, Monetary Policy, Uncategorized | Tagged | Leave a comment

December 7, 1941: “We are all in the same boat now”

Those words spoken to President Franklin Roosevelt by British Prime Minister Winston Churchill on this day 78 years ago.

On December 7, 1941, at around 1:30 p.m., President Franklin Roosevelt is conferring with advisor Harry Hopkins in his study when Navy Secretary Frank Knox bursts in and announces that Japan had attacked Pearl Harbor. The attack killed more than 2,400 naval and military personnel.

For weeks, a war with Japan had appeared likely since negotiations had deteriorated over the subject of Japan’s military forays into China and elsewhere in the Pacific during World War II. FDR and his advisors knew that an attack on the U.S. fleet at the Philippines was possible, but few suspected the naval base at Pearl Harbor would be a target.- History.com

These words were spoken by the Japanese just a few days and hours earlier…

Niitakayama nobore 1208 –  a coded message: “Climb Mount Niitaka, December 8.”  The signal meant that war with the United States would commence on December 8, Japan time, or December 7 in Hawaii.

The message, which translated means “Climb Mount Niitaka 1208,” was uttered over the radio from the Japanese battleship Nagato and relayed to a transmission station in Tokyo. From there, it was relayed to another station before reaching the fleet and setting off the infamous surprise attack.  – Stars & Stripes

Tora, Tora, Tora” –  indicating that the surprise attack on Pearl Harbor had commenced and everything seemed to be going well for the Imperial Japanese Navy (IJN).   Well, at least until the slumbering Giant got woke.

Beware Of The Sleeping Giant

We are so grateful and thankful to everyone, from all of the Rosie the Riveters to General Douglas MacArthur, and, most of all, to the heroes that made theultimate sacrifice to help America win the war in the Pacific.


Posted in Uncategorized | Leave a comment

Why The Stock Bull Is A Big Meh For Most Americans

Interesting piece by the FT today that only one-third of Americans feel the benefits of the great bull market.   Only 40 percent of the population realizes stocks are up for the year.  These are tough numbers for a so-called “populist” president who claims the stock market bull as one of his greatest achievements and much of his base is not participating in the gains.

FT

Nearly two-thirds of Americans say this year’s record-setting Wall Street rally has had little or no impact on their personal finances, calling into question whether one of the strongest bull markets in a decade will boost Donald Trump’s re-election chances.

A poll of likely voters for the Financial Times and the Peter G Peterson Foundation found 61 percent of Americans said stock market movements had little or no effect on their financial wellbeing. Thirty-nine percent said stock market performance had a “very strong” or “somewhat strong” impact. 

The survey suggested most Americans are not aware of market movements, with just 40 percent of respondents correctly saying the stock market had increased in value in 2019. Forty-two percent of likely voters said the market was at “about the same” levels as at the start of the year, while 18 percent believed it had decreased.- FT

Say It Ain’t So, Joe.  How Can This Be So?

The above survey closely tracks the Fed’s data on the distribution of stock ownership by wealth percentiles.  Rarely does the economic data so closely confirm such a survey study.


Table_Dec10

The data show that 86.4 percent of all public equity wealth is held by the top 10 percent of households as of the end of June 2019.  Even with a very generous assumption that 60 percent of pension entitlements are allocated to equities, the numbers just don’t change much.

Most of the difference, when including our generous assumption on pension assets,  is allocated to the upper-middle class, who fall in the 50-90 percentile of households, where one-third of the assets of this cohort group are in the form of pension entitlements.

Note the bottom 50 percent of households have almost no exposure to the stock market, except, of course, indirectly as their income and job prospects are determined by an asset-driven economy, highly dependent on ever-increasing bubbles.

The New “Stock Market Conundrum”

Alan Greenspan used to talk a lot about the bond market conundrum and lays much of the blame of the credit and housing bubble on it.  Simply put, the Greenspan Fed raised the funds’ rate by over 400 basis points from 2004-2006 and the 10-year yield barely budged allowing the housing bubble to rage on.

In his February 17, 2005, testimony before the Committee on Banking, Housing, and Urban Affairs of the U.S. Senate, Federal Reserve Chairman Alan Greenspan observed that long-term rates had trended lower despite the 150-basis-point rise in the Federal Open Market Committee’s (FOMC’s) target for the federal funds rate. Rejecting a variety of possible explanations for the behavior as implausible he called it a “conundrum.”  – St. Louis Fed

We have posted several times that the conundrum was largely explained by foreign central banks recycling their FX reserves back into the U.S. Treasury market and the relative dearth of Treasury securities at the time.

We fear a new conundrum is developing in stocks or has already evolved. Though the equity market directly impacts only a small segment of the population, it has an outsized impact on the economy.   This, we believe, may result from the fact the market considers it the last financial sector with any semblance of an economic signal, though faint and often wrong as it may be, to divine future economic prospects, which determines confidence and thus consumer and capital spending decisions.

In 1966, four years before securing the Nobel Prize for economics, Paul Samuelson quipped that declines in U.S. stock prices had correctly predicted nine of the last five American recessions.  –  Bloomberg

Our suspicions are bolstered by the fact that QE has almost completely neutered and drowned out the economic signals of the bond market.  Great Ph.D. dissertation material.

Can somebody, for example,  please explain the fundamental economic signal of the Italian 10-year trading at 75 bps in September?

As the Brits head to the polls next week to choose a new government, we can paraphrase their great war-time PM with some confidence with respect to Mr. Market’s outsized impact,

Never in the field of political economy are so many so dependent on so much owned by so few


FT_2

Posted in Economics, Equities, Quotes, Uncategorized | Tagged | 31 Comments

QOTD: Churchill On Truth

QOTD:  Quote of the Day

The truth is incontrovertible. Panic may resent it, ignorance may deride it, malice may distort it, but there it is.  — Winston Churchill, HOUSE OF COMMONS, May 17th 1916

Posted in Quote of the Day, Uncategorized | Tagged , , | Leave a comment

Rollback Is The Word And Dealbreaker

Posted in Uncategorized | Leave a comment