The Snowflake Economy & Market

Don’t talk to me about snowflakes.  I have one daughter in college and one about to enter and we have had some very interesting and, let’s just say loud, discussions about free speech,  triggers, snowflakes, and safe spaces.   On one occasion, they became very upset that I took the position that the political shock-jock, Ann Coulter, who, by the way,  is antithetical to my own political views and I find repulsive, should be able to speak on the UC Berkeley campus.  In fact, I was ready to drive down to the campus and protest for her right to speak.

I tried to explain to my daughters if only popular ideas were protected, there would be no need for the First Amendment.  If you do not defend the free speech rights of the unpopular, even if their views are repulsive to you,  our liberty will never be secure.  My experience is that many university students have trouble grasping this concept.  It is not to say they don’t have the right to not invite someone to speak but to block a speaker, which one group has invited?  Come on, man!

Ironically, when I mentioned to the youngest how much we paid in taxes during the bountiful years, she was outraged.  Maybe today’s high schoolers are sensible fiscal conservatives?

Lowest Terminal Real Fed Funds Rate Ever!

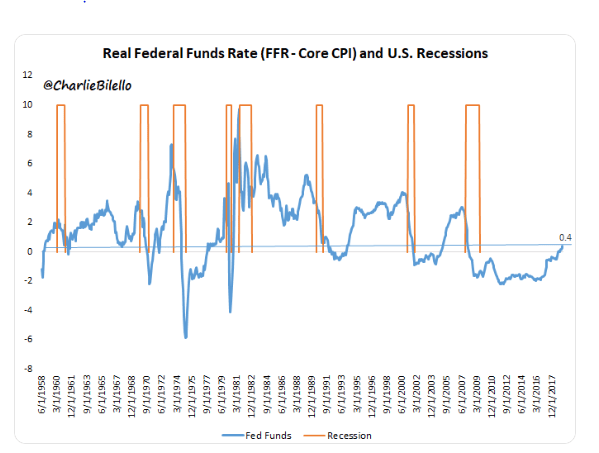
Moving on, Charlie B. throws together a nice chart and also notes,

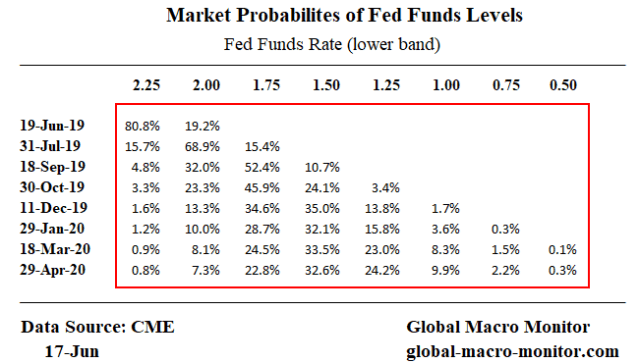
The REAL Fed Funds Rate (Fed Funds minus inflation) stands at 0.4%, which, if the Fed is done hiking (market saying 100% probability of a cut next month),  would be the lowest terminal rate of any expansion ever. Monetary policy remains extraordinarily easy. –  Charlie Bilello

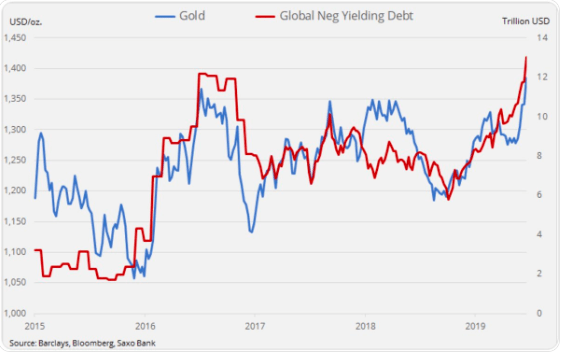
Now, do you still wonder why gold is having a Ralph Kramden moment?  “One of these days, you’re going to the moon, Alice!”

Real Fed Funds

Q: How robust is an economy or stock market that freaks out over a barely positive real Fed Funds rate, is triggered if the word “patient” is not removed from an FOMC statement, and considers a less than super-dovish Fed as a microaggression?

A:  A “snowflake” economy and market.

The market thought it had found its safe space with the dovish Fed and three rate cuts baked in.  We seriously doubt it and are prepared for a macroagression.

Coming Up Next:  The Trump Economy Scorecard

We have been very busy working on data to provide you with a full and comprehensive scorecard of the Trump economy as the presidential campaign gets underway and the B.S. starts to fly in earnest, on both sides.   It should be out in the next few days so watch for it.

Here is a little appetizer.

Because the current POTUS is always comparing his economy with that of his predecessors, we juxtapose several economic indicators during his first 2 1/2 years in office to the same timeframe as President Obama’s last few years in office.   President Trump essentially inherited an economy on autopilot and goosed it with tax cuts and some deregulation.

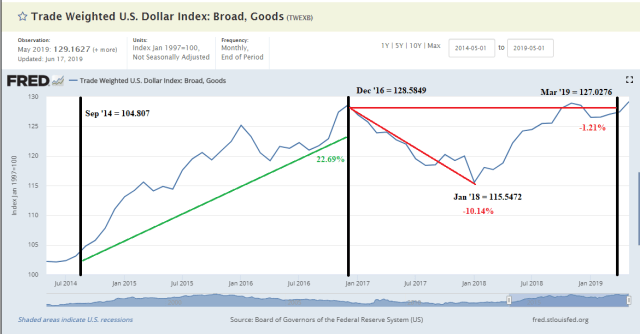
The chart below illustrates that economic growth in the first 9 quarters of President Trump economy was 1.9 percent (0.8 percent annualized) higher than the last 9 quarters under President Obama.  Net exports were the main positive contribution to the differential, which makes sense as the trade-weighted value of the dollar increased by over 20 percent during the Obama timeframe and declined 1.2 percent under President Trump, which also includes a 10 percent decline in his first year in office.    By the way, not one peep from the Obama administration about the Fed as the strong dollar created a more than massive economic headwind during their last few years in office.   

Private fixed investment, mainly in nonresidential structures and equipment, was the second largest contributor to the growth differential, though residential investment has significnatly lagged under Trump. 

Personal consumption, federal nondefense and state and local govenrment consumption and investment were big drags (negative) on the Trump-Obama growth differential. 


Trump_Obama_GDP_Diff.png


Trump_Obama_Trade Weighted Dollar

Though nominal wages have grown faster during the Trump economy, inflation has almost doubled, resulting in lower real wage growth than in Obama’s last several months in office, which is also consistent with lagging real growth of personal consumption expenditures.  The Phillips Curve does liveth.

Much more to come.  Stay tuned, folks.


Posted in Economics, Politics, Uncategorized | Tagged , , , , | 14 Comments

How Tariffs Affect Nontradeables

Posted in Uncategorized | Leave a comment

US and China relationship has forever changed

At times you will still see some volatility, says Catherine Yeung, investment director at Fidelity International.  – CNBC International

Posted in China, Uncategorized | Tagged , , , | Leave a comment

Negative Yields Are Pure Gold

Gold

               Hat Tip:  @mootrades

Begs the question (petitio principii):  Why Are Yields Negative?


Posted in Gold, Uncategorized | Tagged , | 2 Comments

If Mexico doesn’t stem migrant flow? – BBC News

Our main market mover focus used to be capital flows.

Now, migrant flows?  Come on, man!

The US has proposed a “safe third country” agreement with Mexico, if migrant arrivals to the US border are not reduced by mid-July. What would it mean for asylum seekers? The BBC’s Barbara Plett Usher explains.

Please subscribe HERE http://bit.ly/1rbfUog

Posted in Uncategorized | Leave a comment

Class Act

I have always been a bit ambivalent about baseball great, Albert Pujols (AP), who now plays for the Los Angeles Angels of Anaheim and returned to St. Louis tonight for the first time after playing for Cardinals from 2001-2011.   But not after seeing this tweet last night.

Treating others with the dignity they deserve ranks much higher in my Hall of Fame than how many home runs a player hits.

You are one class act, AP.  Be sure to click on the video.

AP’s return to St. Louie tonight. 

Go here to see where AP ranks all-time in baseball stats.   His 645 home runs rank 6th all-time, only 15 behind the great Willie Mays.

Posted in Sports, Uncategorized | Tagged | Leave a comment

The Innate Angst Of Inequality

Just a short but  very interesting follow-up video to our last post,  When 50 Percent Of U.S. Households Were Insolvent, which illustrated the stunning and parabolic growth of wealth inequality in the United States.

NW_Table

We feel this post is necessary and very relevant as many dismiss and have no worries about the growing inequality throughout the country.  In fact, we had a conversation with a “not a problem” journalist today.  We couldn’t disagree more.

Much of the growing angst in our society is caused by widening income and wealth gaps.

Even in the investment world, there is ample evidence of conservative investors taking foolish risks with their capital because they see friends and neighbors getting rich — albeit temporary – during asset bubbles.  They feel stupid being left out and suffer anxiety watching their comrades increase their wealth while they sit on the sidelines.  Unfortunately,  they usually succumb and get sucked in right at market tops.

We suspect this is how Issac Newton really discovered the law of gravity through a very costly lesson in the financial markets.

In an updated and annotated text of Benjamin Graham’s classic “The Intelligent Investor,” WSJ’s Jason Zweig included a small anecdote about Newton’s adventures with investing the South Sea Company:

“Back in the spring of 1720, Sir Isaac Newton owned shares in the South Sea Company, the hottest stock in England. Sensing that the market was getting out of hand, the great physicist muttered that he ‘ could calculate the motions of the heavenly bodies, but not the madness of the people.’ Newton dumped his South Sea shares, pocketing a 100% profit totaling £7,000. But just months later, swept up in the wild enthusiasm of the market, Newton jumped back in at a much higher price — and lost £20,000 (or more than $3 million in [2002-2003’s] money. For the rest of his life, he forbade anyone to speak the words ‘South Sea’ in his presence.”  — Business Insider

Even Animals Feel The Angst Of Inequality

The following video is based on a widely-cited 2003 paper published in Nature by Sarah Brosnan and Frans de Waal.  They used capuchin monkeys in nearby enclosures to perform an equal task, which they would then be rewarded.  In the equal reward condition, both monkeys received cucumbers. In this case, the monkeys did the task well, cooperated, and formed a well functioning and productive mini-economy.

In the unequal reward task, one monkey got a cucumber, but the other monkey got a grape, which, apparently, is perceived and tastes more valuable in the capuchin kingdom.

Then all hell broke loose.

The angst, or whatever you want to label it, caused by inequality seems innate, does not induce cooperation, and is generally disruptive and unhealthy for societies even in the animal kingdom.

Take the 2 1/2 minutes and watch the video.

Posted in Uncategorized | 16 Comments

When 50 Percent Of U.S. Households Were Insolvent

Not that long ago, by the way.

My good friend, David Jones, sent over some new data this past weekend.  We have been busy.

Our First Take

Not a lot of prose tonight as we will let the data and charts speak with only some short comments.   We take a quick look at two issues in this post: 1) the growing wealth inequality in the U.S., and 2) the massive hit the American middle class took during the Great Financial Crisis (GFC).

Stay tuned for more analysis in future posts.

Stunning Growth In Wealth Inequality

Though we were cognizant of the growing inequality of wealth in the United States, we had not really internalized it and were shocked — no, floored — by the following data.

NW_Table

The table of data speaks volumes and explains much of the dynamic currently taking place in the U.S. economy and the American body politic.

The net worth of the top 1 percent compared to the bottom 50 percent has increased from a multiple of 6.5 in Q1 1990 to 26.0 in Q4 2018.  Absolutely stunning!

In growth terms, the wealth (net worth) of the top 1 percent has increased by 532 percent in the same period compared to only a 57.1 percent increase in the net worth of the bottom 50 percent.   Whereas the growth rate of the 1 percenters has outpaced nominal GDP by 2x since 1990, the net worth of the bottom 50 percent has tracked the economy by a paltry factor of 0.2, which truly reflects how the American economy has morphed into the asset-driven beast that it now is.

The moral of the story here is you better own assets.  Pity, or maybe fear, the younger generations saddled with their student loan debt and the debt they will inherit from the baby boomers.

Middle-Class Devastated During The GFC

The most shocking chart of our first cut at the data was the quarterly time series of the bottom 50 percent’s net worth.

Bottom_50

The bottom 50 (the data are aggregated thus not all households were insolvent) lost its entire net worth during the GFC and was technically insolvent (liabilities exceeding assets) during 8 of the 11 quarters during the period of Q2 2010 to Q4 2012.   The collapse in housing prices was the main culprit as the chart below illustrates but dig a little deeper and the huge increase in home mortgage leverage, which the cohort began to take on in earnest during the early 2000s, was, a, or, the, major factor in the destruction of wealth.

Nothing new here but interesting to finally see laid out in a clear and concise manner.

Though the Fed’s quantitative easing (QE), which targeted asset prices — as inflating them — shares much of the responsibility for the growing wealth inequality,  it also helped resurrect the balance sheet of the bottom 50 percent.  Some call QE “socialism for the rich” but there is no doubt some did trickle down to help the lower 50 recover some their net worth.

We suspect or know almost certainly,  many households are being lost in translation – in the aggregation and averaging.   Several million have yet to recover in our bifurcated economy.

We still need to take a deeper dive into the data but we did notice a big chunk in the recovery of the net worth of the lower 50 was the reduction in home mortgage liabilities.  We not yet sure how this took place but suspect much was through default, foreclosure, and debt forgiveness.  We also noticed big jumps in certain quarters.

RE_1

How Did The 1 Percent Fare During GFC?

Not too bad, in a relative sense, especially when juxtaposed to the hit the lower 50 took during the GFC.   This is reflected in the chart of the 1 percenters net worth.

Top_1

The net worth of the 1 percent fell almost 26 percent from Q3 2007 to Q1 2009, the respective peak and trough of the stock bear market.

Note the red bars also reflect the quarters when the lower 50 were technically insolvent.  In some of those quarters, the wealth of the 1 percent actually increased.   That rage was felt and reflected in the 2016 presidential election and is still playing out in real political time.

Upshot    

We have nothing against the 1 percenters, after all, we were part of, and may still be a member of that cohort.  The data does show the unsustainability of the current situation, however, both economically and politically.

We implore the plutocracy to take the data seriously, make a plan and commit to making and paying for the necessary social investments to stave off a more severe political disruption.   The optimal solution is always to help pull others up rather than having them pull you down.

Trump Not The Answer

We firmly believe Donald Trump is not the answer and is just a warm-up act to the real deal that may be yet to come.  We have looked at the economic data under the Trump administration, which we will present in the next few days, and the needle has moved very little and is reflected in the current polling data.


Monring Consult_Polls

A truer form of populism is moored in the economics of the left, in our opinion, though President Trump gets a lot of mileage from his anti-trade rhetoric and policies even as farmers seem to be turning on him.

China Trade Deal At The G20?

It’s going to be interesting to watch how he walks the fine line of trying to keep stocks afloat by cutting a trade deal with China’s President Xi at the G20 next week, while simultaneously feeding the base the red China meat.  Irreconcilable differences, in our opinion, unless Xi or Trump caves.  Not likely.

Trojan Horse For The Rich

Nonetheless, a narrative is taking shape that the Trump administration is more of a Trojan Horse for the 1 percent — tax cuts for the wealthy,  cuts to social services, and pumping stocks, where the top 10 percent directly hold 86 percent of total stock wealth with the bottom 50 holding less 1 percent;  presented as a Honey Boo Boo reality show to entertain the base.  Not exactly the savior of the working class.

We may or may not agree with the narrative, which is really not the point, but it’s inflating out in the ether and appears to be impacting the polling data, so please, spare us the hate mail.

Stay tuned for Mr. Toad’s Wild Ride, folks.   Long pitchforks and water cannons.

Posted in China, Economics, Policy, Politics, Uncategorized | Tagged , , , | 1 Comment

Doubtful ECB Can Prevent Recession – O. Blanchard

Take a few and listen to O., well worth your time. 

Olivier Blanchard, the former IMF chief economist and part of our elite “One Smart Dude Club (OSDC)”, speaks on the ECB’s monetary policy and the tools it has available to fight an economic downturn.   He essentially concludes Germany, which is reluctant to venture into fiscal stimulus but will be hurt the most by the trade wars,  will have to do some backsliding on its frugal ways.

Traders and ‘bots way offsides today, including us (but not short) as we were gone fishing, took a one-two body blow from the Draghi dove and Trump tweet.

It’s all about the Tape  Tweet, folks.

Posted in Uncategorized | 10 Comments

S&P500 Key Levels

Snoozefest until the FOMC on Wednesday.  Lots of Doji candles reflecting traders don’t wanna do jack all.  Volume running at about 90 percent of the 10-day moving average.

Market expecting no rate cut, though a 20 percent probability is not exactly zero.  It feels to us the market could be set up for some disappointment.  Expectations of three rate cuts by year-end seem excessive with 3.6 percent unemployment and 2 percent off all-time stock market highs.

The market needs a reality check here with respect to expected rate cuts and will be very sensitive to and looking for clues in the FOMC statement.

Key Levels

The S&P is having trouble at the key Fibo, 2900.95.  If that goes, the recent high of 2910.61 then off to new highs at 2954 plus.

On the downside, 2874 is a big number,  the 50-day moving average, and last week’s intraday low.   Going fishing tomorrow.


S&P

Expected_Fed Funds Rate


Expected_Fed Funds_probs


S&P_Chart

Posted in Uncategorized | Leave a comment