Republicans Set For Historical Thumping In Midterms

Updated October 30 @ 1:15 a.m. –   Data correction 

Summary

  • President Trump’s Gallup approval rating has collapsed over the past week
  • We have updated our simple single factor model, which now projects the Republicans will lose 53 House seats next Tuesday
  • We are taking the over
  • Oil prices have fallen, though not yet reflected in gas prices, which may help the president on the margin

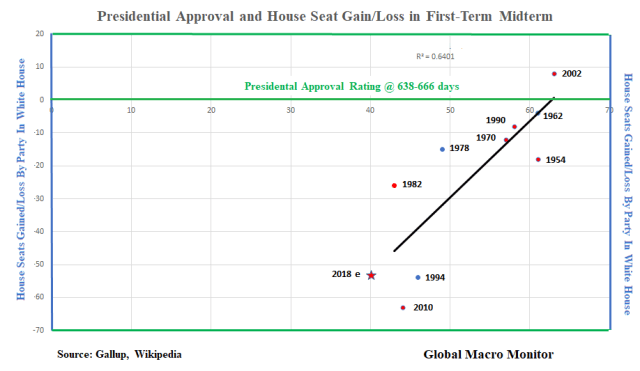
We have updated our single factor Congressional midterm model based on the latest Gallup polling data of the president’s approval rating, which is now plunging, falling 4 points in the past week.  Bad time for a swoon.

President Donald Trump’s job approval rating plunged 4 percentage points last week amid a wave of violence, the latest troubling signal for Republican chances in upcoming midterm elections.

Forty percent of Americans approved of Trump’s performance as commander in chief, according to Gallup polling during the week ending Oct. 28. That was down from 44 percent the prior week, an unusually steep decline for the poll, which is based on a survey of 1,500 U.S. adults conducted Monday through Sunday each week.  – Bloomberg

President Trump enters the week before the midterm election with the lowest approval rating of any full first-term president in modern day polling — 4 points below President Obama before losing 63 House seats in 2010, and 6 points lower than President Clinton before losing 54 House seats in 1994.

Trump_midterms_5

The presidential approval model predicts the Republicans are set to lose 53 House seats next Tuesday.   Ouch!

Of course, the midterm election will be determined more than just President Trump’s rating.  Moreover, the single factor model is simplistic, though it does have a decent R-squared of .64,  history may not be prologue, and the data points are a bit imprecise.

Nevertheless, we believe President Trump’s doubling down on the Caravan and “they are coming for us”  narrative, and moving the military to the border is going to backfire politically.  Though our perspective doesn’t infect the model, but we firmly believe it is the major factor in the collapse of President Trump’s approval rating.

Country Looking For Healing And A Leader To Unite

Here is what the traditionally conservative Dallas Morning News wrote, even before the tragic events of the past week,  in endorsing of the young RFK-esque Beto O’Rourke over Ted Cruz to represent Texas in the Senate.  It sums up the mood of the country, in our opinion.

In looking at the race for United States Senate in Texas, we recognize that this country stands on a precipice.  Whether we fall off the edge depends on how we answer this question: Can we set policy differences aside, even for a moment, and agree to treat each other with the respect befitting a great nation, with acknowledgment of the humanity of each person?  

We have been at divisive political moments before, and we know those often end when leaders emerge who find ways to get along personally even when they are engaged in grand, tectonic political debates. That is one of the underappreciated stories of the 1980s, when President Ronald Reagan and House Speaker Tip O’Neill worked together.  Even when they fought it out on tough issues, they fostered an enduring friendship.

For this reason more than any other, we favor U.S. Rep. Beto O’Rourke for U.S. Senate.  The pivotal issue before our country is public leadership, and here we believe O’Rourke’s tone aligns with what is required now. This inclusive and hopeful tone, along with O’Rourke’s approach of starting with shared principles and working toward solutions, offset any policy differences we have with him. Leadership is more than policy, and whether we are addressing the very real challenges before us now turns on our ability to find points of agreement.  – Dallas Morning News


Trump_midterms


Oil Prices And The Midterm

Oil prices have fallen since our last analysis, which may help the president on the margin.  Though, anecdotally, we don’t see it showing up in a drop in the price of gasoline at the pump.

Stay tuned, folks.  Prepare for Mr. Toad’s Wild Ride!

Posted in Politics, President Trump, Uncategorized | Tagged , , | 1 Comment

Why The 2018 Stock Market Corrections Are Different

Just a quick note and some data to bolster our last post and concern that Treasury yields are not coming in  during this stock market correction.

The table illustrates that the this year’s two S&P 10 percent corrections have coincided with a rise in the 10-year  Treasury yield.   This is very rare, at least in recent history, and has happened only once in the last 20 years, and that was a special case due to a massive flight to quality and complications around the Russian Debt Default and LTCM crisis.

Flight To Quality

In general, when stocks fall by 10 percent, there is a flight to quality and yields fall on Treasury securities.

Yes,  the 10-year is down from its peak of 3.25 percent but higher than when the S&P500 peaked in September.  One can fiddle with the data and use intraday highs and lows, but you get our point, we hope.

The Gathering Storm In The Treasury Market  

If you haven’t read our beast of a post on the structural changes in the Treasury market, we suggest you run to it now!   Click right here:  The Gathering Storm In The Treasury Market 2.0

We also recommend our most recent piece,  Where The Next Financial Crisis Begins.

Keep this on your radar folks,  we think it signaling there are structural changes taking place in the global capital markets.

Updated:  October 29 @  4:06 pm Eastern

S&P_500_Corrections


Posted in Equity, Interest Rates, Uncategorized | Tagged , | 33 Comments

S&P500 Key Levels

The oversold S&P is off 30 points from its morning high.  It’s imperative it has a strong close today.

We do think a test of the February low of 2532. 69 is a done deal, that is another 5.4 percent from current levels.

What concerns us most is that today’s 10-year yield Treasury yield is higher than where it was when the S&P500 peaked on September 21.   To be fair, the move in the 10-year to 3.25 percent triggered this stock market slide.

he markets may be signaling the global economy is sacked with too much debt.    Very rare do Treasury yields rise during a 10 percent stock market correction.

Here are key levels to watch:

S&P_500

Posted in Equities, Uncategorized | Tagged , | 5 Comments

Go Irish!

A beacon in a world that grows darker by the day.


Posted in Uncategorized | Leave a comment

Week In Review – October 26

Summary

  • Another ugly week for equities led by non-China Asia
  • Starting to see a flight to quality as 10-year yields coming in a bit
  • U.S. credit blowing out again
  • VIX has doubled in October
  • Lumber still in timber mode as homebuilders now down 30 percent from highs

Commentary:   The S&P is on pace to be the fourth worst October since 1950 and, if no bounce and  a 0.5 percent cum decline by Wednesday will make it the third worst, only surpassed by 1987 and 2008.   Bad Company.   Equities are way oversold and many companies ready to exit their restricted window on buybacks.  If we don’t get a bounce next week, markets have a much deeper problem than the garden variety correction the cheerleaders are touting.

Nevertheless, many forces are converging to keep us in the bunker over medium-term.  Political uncertainty —  recall we expect a political earthquake in eight days.  Expect, women, young, and left.   The U.S. bond auctions are sputtering and central bank U.S. debt purchases are over.

Angela Merkel took another hit in elections in the central region of Hesse today, ergo more instability for the German governing coalition.  Watch the euro.

Polls are now closed in Brazil, and Jair Bolsonaro is set to lead Brazil.  Markets have rallied a lot pricing in a Jair win,  leading many to believe a “sell the news” response is order.  We suspect not.


Week_Chart_1

Week_Chart_2


Week_Chart_3


Week_Chart_4


Week_2018_ETFs


Week_Table

Posted in Uncategorized | Leave a comment

Sector ETF Performance – October 26

Sector_ETF_Day

Sector_ETF_W

Sector_ETF_M

Sector_ETF_YTD

Posted in Sector ETF Peformance, Uncategorized | Tagged | Leave a comment

Global Risk Monitor – October 26

RiskMon_1

RiskMon_2


Posted in Daily Risk Monitor, Uncategorized | Tagged , , , , , | Leave a comment

QOTD: The Taiwan Strait

Repeatedly challenging our bottom line (on the Taiwan question) is extremely dangerous,  If someone attempts to split Taiwan from China, the Chinese military will take any necessary actions at any cost. – General Wei Fenghe, Chinese Defense Minister

Posted in Uncategorized | 1 Comment

Where The Next Financial Crisis Begins

We are not sure of how the next financial crisis will exactly unfold but reasonably confident it will have its roots in the following analysis.   Maybe it has already begun.

The U.S. Treasury market is the center of the financial universe and the 10-year yield is the most important price in the world, of which, all other assets are priced.   We suspect the next major financial crisis may not be in the Treasury market but will most likely emanate from it.

U.S. Public Sector Debt Increase Financed By Central Banks 

The U.S. has had a free ride for this entire century, financing its rapid runup in public sector debt,  from 58 percent of GDP at year-end 2002, to the current level of 105 percent, mostly by foreign central banks and the Fed.

Marketable debt, in particular, notes and bonds, which drive market interest rates have increased by over $9 trillion during the same period, rising from 20 percent to 55 percent of GDP.

Central bank purchases, both the Fed and foreign central banks, have, on average, bought 63 percent of the annual increase in U.S. Treasury notes and bonds from 2003 to 2018.  Note their purchases can be made in the secondary market, or, in the case of foreign central banks,  in the monthly Treasury auctions.

In the shorter time horizon leading up to the end of QE3,  that is 2003 to 2014,  central banks took down, on average, the equivalent of 90 percent of the annual increase in notes and bonds.  All that mattered to the price-insensitive central banks was monetary and exchange rate policy.   Stunning.

Greenspan’s Bond Market Conundrum

The charts and data also explain what Alan Greenspan labeled the bond market conundrum just before the Great Financial Crisis (GFC).   The former Fed chairman was baffled as long-term rates hardly budged while the Fed raised the funds rate by 425 bps from 2004 to 2006, largely, to cool off the housing market.

The data show foreign central banks absorbed 120 percent of all the newly issued T-notes and bonds during the years of the Fed tightening cycle, freeing up and displacing liquidity for other asset markets, including mortgages.   Though the Fed was tight, foreign central bank flows into the U.S., coupled with Wall Street’s financial engineering, made for easy financial conditions.

Greenspan lays the blame on these flows as a significant factor as to why the Fed lost control of the yield curve.  The yield curve inverted because of these foreign capital flows and the reasoning goes that the inversion did not signal a crisis; it was a leading cause of the GFC as mortgage lending failed to slow, eventually blowing up into a massive bubble.

Because it had lost control of the yield curve,  the Fed was forced to tighten until the glass started shattering.  Boy, did it ever.

Central Bank Financing Is A Much Different Beast

The effective “free financing” of the rapid increase in the portion of the U.S debt that matters most to markets, by creditors who could not give one whit about pricing,  displaced liquidity from the Treasury market, while, at the same time,  keeping rates depressed, thus lifting other asset markets.

More importantly, central bank Treasury purchases are not a zero-sum game. There is no reallocation of assets to the Treasury market in order to make the bond buys.  The purchases are made with printed money.

Reserve Accumulation

It is a bit more complicated for foreign central banks, which accumulate reserves through currency intervention and are often forced to sterilize their purchase of dollars, and/or suffer the inflationary consequences.

Nevertheless, foreign central banks park much of their reserves in U.S. Treasury securities, mainly notes.

Times They Are A-Changin’

The charts and data show that since 2015,  central banks, have, on average been net sellers of Treasury notes and bonds, to the tune of an annual average of -19 percent of the yearly increase in net new note and bonds issued.  The roll-off of the Fed’s SOMA Treasury portfolio, which is usually financed by a further increase in notes and bonds, does not increase the debt stock, but it is real cash flow killer for the U.S. government.

Unlike the years before 2015, the increase in new note and bond issuance is now a zero-sum game and financed by either the reallocation from other asset markets or an increase in financial leverage.  The structural change in the financing of the Treasury market is taking place at a unpropitious time as deficits are ramping up.

Because 2017 was unique and an aberration of how the Treasury fnanced itself due to the debt ceiling constraint,  the markets are just starting to feel this effect.   Consequently, the more vulnerable emerging markets are taking a beating this year and volatility is increasing across the board.

The New Market Meta-Narrative 

We suspect very few have crunched these numbers or understand them, and this new meta-narrative, supported by the data, is the main reason for the increase in market gyrations and volatile capital flows this year.   We are pretty confident in the data and the construction of our analysis.   Feel free to correct us if you suspect data error and where you think we are wrong in our analysis.  We look forward to hearing from you.

Moreover, the screws will tighten further as the ECB ends their QE in December.  We don’t think, though we reserve the right to be wrong, as we often are,  this is just a short-term bout of volatility, but it is the beginning of a structural change in the markets as reflected in the data.

Interest Rates Will Continue To Rise

It is clear, at least to us, the only possibility for the longer-term U.S. Treasury yields to stay at these low levels is an increase in haven buying, which, ergo other asset markets will have to be sold.   If you expect a normal world going forward, that is no recession or sharp economic slowdown, no major geopolitical shock, or no asset market collapse,  by default, you have to expect higher interest rates.  The sheer logic is in the data.

Of course,  Chairman Powell could cave to political pressure and “just print money to lower the debt” but we seriously doubt it and suspect the markets would not respond positively.

Stay tuned.


Central Bank_2


Central Bank_5


Central Bank_10


Posted in Black Swan Watch, ECB, Fed, Uncategorized | Tagged , , | 34 Comments

The Economic Consequences of Mr. Trump – Project Syndicate

With unemployment at a 50-year low, wages starting to pick up, and the stock market booming, the US economy has defied expectations since the 2016 election. Nobel laureates Angus Deaton and Edmund Phelps, along with Barry Eichengreen, Rana Foroohar, and Glenn Hubbard, ask why, and whether what looks like a robust recovery is masking another crisis in the making. ** This film was created in collaboration with the Center on Capitalism and Society at Columbia University.

Learn more at https://capitalism.columbia.edu and https://capitalism.columbia.edu/econo…

** Keep up to date with PS films by subscribing to our YouTube channel: https://www.youtube.com/project-syndi…

Posted in Economics, Uncategorized | Tagged , | Leave a comment