

Or, at least, went into labor.


Wow, three decades and one year today, I was a young economist at the World Bank. My friend and I, now the chief economist at the FDIC, were graduate students and walked by the White House on our way to lunch. The stock market was down somewhere between 5-10 percent in the morning. I looked through the gates on Pennsylvania Avenue and thought to myself, “I wonder if President Reagan is up to the challenge.”
My Boss In The Oval
The president was 76 years old, and rumors were floating around he was already losing it. Little did I know, I would be working for the man who was briefing the POTUS in the Oval about the crash on that morning just a few years later at a major money center bank.
He was the Deputy Secretary of the Treasury, who was acting Secretary on Black Monday as James Baker was in Europe beating up on the Germans over exchange rate policy.
Over lunch in 1989 or 1990, my boss shared with me the play-by-play in the Oval on October 19, 1987. He said President Reagan was sharp, impressive, calm, and proactive, jumping up from his desk, “What do we need to do to calm the markets?” How America misses that kind of leadership even if you agreed with the president’s policies and politics, or not.
Money & Banking Class
I was also a young adjunct professor at George Mason University teaching money and banking courses. I had been warning my students that a major crash, as in 25 percent, was highly probable.
I think my classes were on Tuesday and Thursday. I walked in the next day after Black Monday and they were impressed. Interest rates were spiking for almost a year, and coupled with the increased volatility, which began in August after a two-year stock run, almost straight up, were clear warning signals.
The stock market was in a speed wobble and free fall even before it crashed. Ditto for 1929.
I also can’t remember any of my students’ names but one was a big blonde dude, very bright, and another a young woman who said she worked at the C.I.A.. I can’t remember the exact details of the path of how I walked to class that day, or any of my students name, but I am 100 percent certain it took place, Senator.
One In A Zillion?
WTF? Wasn’t the volatility spike on October 19, 1987 like a one in 11 billion probability, or something like that?
I later worked with options traders who were short calls on the OEX that day and lost money, so they said. The vega (volatility derivative) swamped the delta causing the price of the call option to increase in price even as the price of the underlying fell over 20 percent. That is frickin’ hard to believe.
The Morning After
The next morning, Terrible Tuesday, the market was still in free fall. Volume had already exceeded the prior day. No bid. The market makers were abandoning ship, some were thought to be insolvent.
Many Wall Street firms put pressure on the NYSE to close the market but President Reagan, under pressure from the Fed, would not allow them claiming executive privilege.
…the president of the United States would very much prefer if the New York Stock Exchange could see its way clear to remain open.” – Howard Baker, Chief of Staff
All of a sudden, I believe after lunch, a phantom buyer came into Chicago and bought the Major Market Index (MMI), which stabilized prices and the market hasn’t looked back since. Market psychology is a real bitch sometimes.
Thank you, Alan Greenspan. Can’t say for sure it was him and them but it is widely believed to be the birth of the Fed put, and later the Plunge Protection Team (PPT).
Recall, the Dow didn’t recover its September 1929 high until 1954.
Now The Addiction
The problem now is we are addicted to and expect the Fed crack or Xanax with every little market hiccup. The economy, and, now, especially, monetary policy are determined, in large part, by asset prices.
It’s stunning to see the POTUS and pundits, such as Jim Cramer, whining the Fed is “too crazy tight” when the real effective funds rate is still negative.

Crazy stupid.
Shanghai – term describing a type of kidnapping. Back in the 17th and 18th century in back alleys behind orphanages and bars there were trap doors that were watched and opened on drunken people or wandering children, then the children or drunks were beaten up until unconscious and brought aboard a ship to do slave labor out at sea until they died.
“we need one more crew member, let’s shanghai some drunk fuck.” – Urban Dictionary
What a warped world.
Shanghai ugly. Trap door in the definition above is spot on.
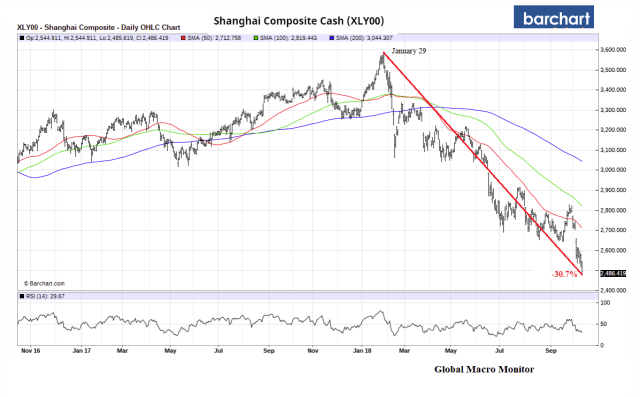
The index is now down 30 percent from the January high.
China is not an asset dependent economy as is the U.S., therefore the stock market has less an impact on growth. You can see from the monthly chart, the Chinese have seen this picture before. Huge speculative spikes, gravity finally takes over, then the proverbial dead cat bounce. Wash, rinse, repeat.
Monthly chart looks like the Shanghai Composite is headed for the 2,000 support level, another 20 percent lower.
China is still a command economy, folks. Remember that.

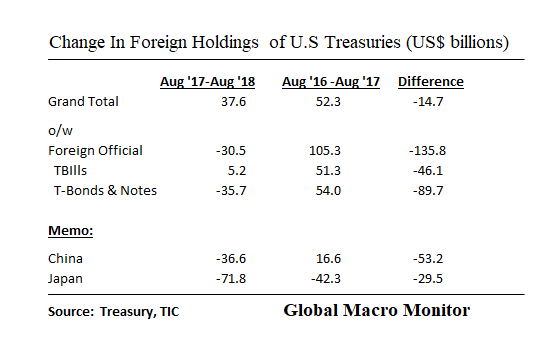
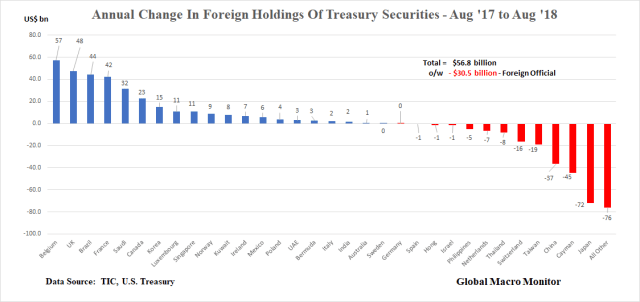
We had a request to look at the annual change in foreign holdings of U.S. Treasury securities as an addendum to our post from last night.
It’s clear the two largest foreign creditors to the United States government are pulling the plug. Not so much dumping their trillion dollar plus stock of holdings but engaging in slow sales and definitely no more net buying.
Not good at a time when the U.S. budget deficit is exploding and set to run a trillion hole as far as the eye can see. At least, until the market has other ideas.
Also, interesting is the sharp decline in flows from the Cayman, which are the hedge funds domiciled offshore.
Expect the hole from China and Japan, and especially the central banks, to be plugged by capital flows diverted from the marginal emerging markets, and we suspect lower credit quality corporate bonds.
The U.S. government will be funded but will have to pay more — maybe much more as the price-insensitive central banks are no longer the alargest buyers but now sellers — and at the expense of the other borrowers. The classic crowding out issue.
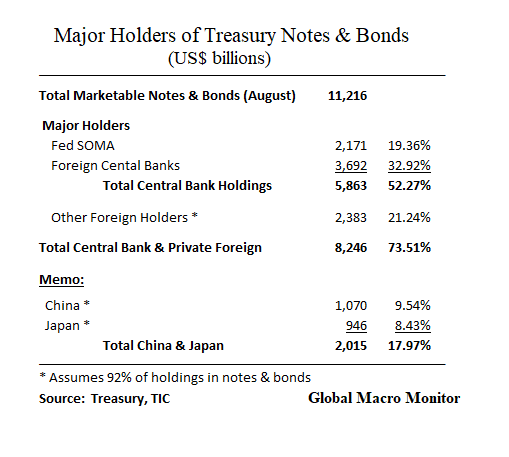
Central banks and foreigners have accumulated almost 75 percent of the stock of marketable notes and bonds. That liquidity is/has dried up, folks. America First soon to be America Thirst?
The budget mess is also starting to get loopy. That is higher interest rates = higher interest payments = higher deficits = higher borrowing requirements = higher interest rates… Wash, rinse, repeat. Yes, Mr. Vice President, deficits do matter when they have to be financed by normal means.
The free ride is over, Edgar, and winter is coming.

Yikes! Sounds like a House Of Cards, Claire… Just, maybe, it is.
It’s dark but so is the real thing currently. House of Cards is one reason why NFLX is up in a down tape today — superb original content. However, Netflix’s library of old movies suck, in our opinion.
The question is will Reed redeem the Underwood Washington in the final season?

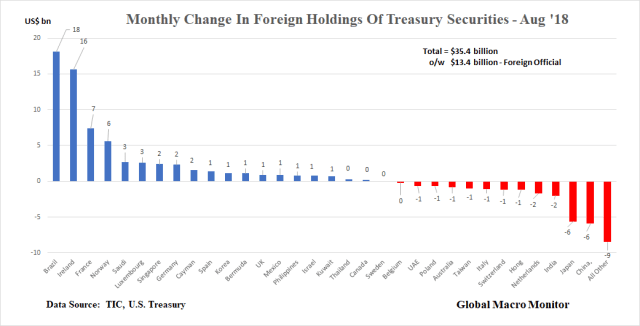
The U.S. Treasury just released the August TIC (Treasury International Capital) data at the market close.
The key takeaways:
Upshot
Markets are way too complacent, and the Trump administration is too cavalier about the economy’s increasing vulnerability caused by its dependence on foreign financing of the government’s exploding budget deficits.
Check out the trends in the data and then do the math.
With the budget deficit exploding, coupled with the Treasury having to raise an additional $300 billion plus/or minus per year to pay back the Federal Reserve as it rolls off its balance sheet, the supply of marketable Treasury securities hitting the market over the next few years will be unprecedented.
At the same, time the “free financing” of deficits provided by the central banks, including the Fed and foreign central banks, is over. Not to mention the other factors which have kept rates low are fading.
Stay tuned!

Summary
We suspect our Sep 23rd beast of a post, The Gathering Storm In The Treasury Market 2.0, was TLDR – Too Long, Didn’t Read. One famous blogger said of it, “This post is so big, you can see it from space.” We feel it was an important read for any market watcher as the 10-year T-Note yield is the most important price in the world.
In that post we which laid out why several factors which have kept U.S. long-term interest rates low and repressed term premium suppressed are fading,
Impatience and ADD equals missed opportunities, as we wrote in the summary bullet points,
That was just before the 10-year yield broke out.
We are going to slice and dice the that post for an easier read for those of us use to 140 280 characters.
We named four significant factors that were changing and set to move long-term interest rates higher and increase the term premium. This post extracts and focuses on the little noticed fact that Social Security has moved from surplus to deficit this year and the impact it will have on the Treasury market.
More than 70 million baby boomers are in the process of retiring and Social Security and Medicare are projected to run an $82 trillion cash deficit over the next 30 years
Posted on September 24rd
Social Security Now In Deficit
Another significant structural change in 2018 is that Social Security (SS) has moved into structural deficit. In fact, SS began running a primary deficit (noninterest income less payouts) just after the GFC.

Source: Social Security Administration
Our chart below shows the U.S. government ’s off-budget balance, which only includes social security and postal service, the federal entities protected from the normal budget process, and excluded from budget caps, sequestration, and pay-as-you-go requirements. The postal service is a tiny fraction of the balance.
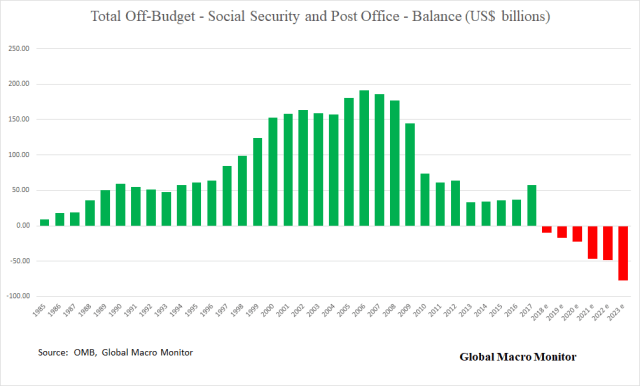
The important takeaway is that the social security surpluses were used to build asset or reserves in their two trust funds:
1) Old-Age Survivors Insurance (OASI) Trust Fund, which pays retirement and survivors benefits, and 2) Disability Insurance (DI) Trust Fund, which pays disability benefits.
If one looks past the cash flow transactions to the impact on actual payments to and from the public, it becomes clear that an increase in trust fund reserves will be associated with a decrease in publicly held Treasury securities. That decrease in turn reduces the Treasury’s current cash needs for interest payments to the public and its need to borrow to make those cash payments.
– Social Security Administration
The large surpluses before the GFC (see above charts) provided a sizeable portion of the financing of the government’s on-budget deficit. For example, the off-budget surpluses from 2002-2008 averaged $173.5 billion per year, which financed, on average, 40 percent of the on-budget deficits.
In other words, social security provided the U.S. government with a significant free-ride of deficit financing, and took substantial pressure off the markets, keeping interest rates low.
The next chart illustrates how the Treasury is becoming increasingly dependent on market financing as the social security surpluses faded and are now in deficit. Marketable debt currently makes up 71 percent of the over $21 trillion total public debt versus 49 percent in 2007.
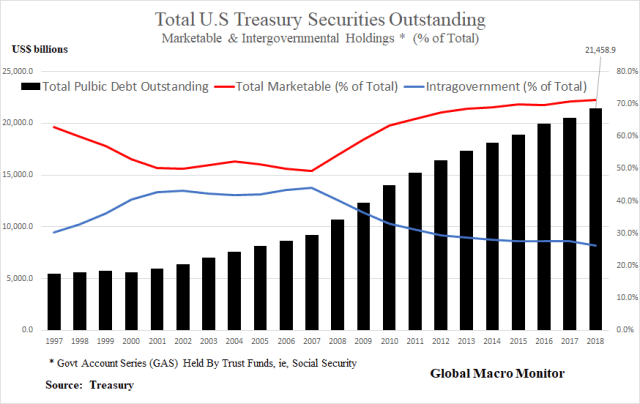
The upshot? More relative issuance of Treasuries into the market and pressure on interest rates to increase and to crowd out other borrowers.
The data speaks for itself.
Real Effective Fed Funds Rate (REFFR)
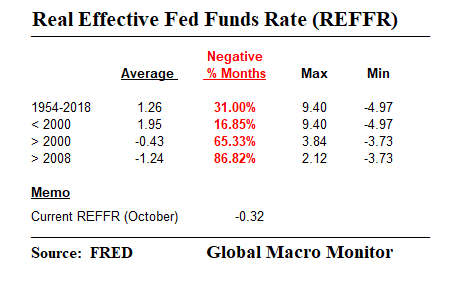
The real effective Fed Funds rate (REFFR), the Federal Reserve’s target rate of overnight commercial bank reserves lending rate less the CPI year-on-year change, remains negative for the 36th consecutive month.
The REFFR has been negative during 87 percent of the months since the beginning of 2008, and 65 percent of the months this century, compared to just 17 percent in the months from 1954 to 2000. If, anything is crazy, that is just plain nuts!
If they are already whining about the Fed with a still negative real fed funds rate is there is any hope of weaning the markets and economy from the crack? A perpetual bull market is not an entitlement, folks, even though some seem to think so.
The REER monthly average since 2000 has been -0.43 percent compared to 1.95 percent from 1954 to 2000.
In other words, the Fed has been performing triage and has kept the economy in the ICU for most of the 21st century. Not exactly a strong economy, in our book.
Balance Sheet
What’s getting tighter is the liquidity withdrawal due the Fed’s declining balance sheet, which is down equivalent to -$265 billion, or about 6.75 percent of the end-Sept ‘17 monetary base, when the balance sheet reduction began.
Note the projected monthly roll off of the SOMA’s Treasury portfolio by the red bars in the below graph. We estimate the Fed is set to reduce its balance sheet by another $125, including its MBS portfolio, in Q4.