COTD: President Trump’s Proposed Tax Reform

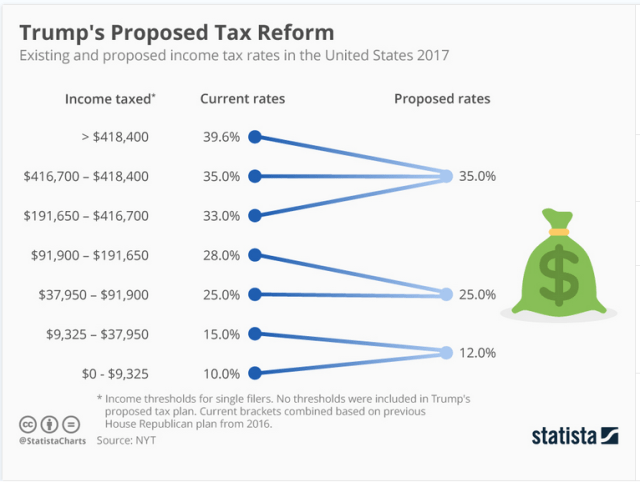
Individual income tax makes up around 49 percent of the Unites States tax revenue, the single biggest position, according to inside.gov. Trump wants to simplify the tax code by bringing the number of income tax rates from now seven down to three (35, 25, 12 percent). The plan didn’t name specific income thresholds, but the New York Times consulted plans by the House Republicans from 2016 to see how the new brackets could shape up.

Some observers have argued that Trump’s tax plan would one-sidedly profit the rich. Indeed, bringing down the tax ceiling from almost 40 to 35 percent would profit the biggest earners. In the lower middle income bracket ($37,950 to $91,900) there wouldn’t be any movement (25 percent). This contradicts Trump’s assertion that he would aim for tax cuts for the middle class. Finally, lowest income bracket taxes would hike 2 percentage points.  – statista

Tax Reform_Statista

Posted in Budget Deficit, Uncategorized | Tagged , | 3 Comments

Corporate Tax Rates and Tax Receipts

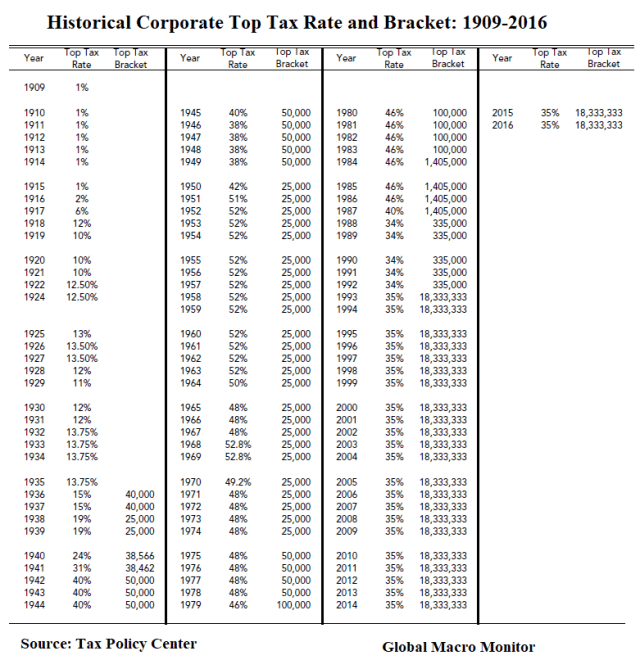
Here are some interesting data on the U.S. corporate tax rate throughout the last hundred years and a chart of federal tax receipts on corporate income as a percent of GDP.  We gathered the data from the Tax Policy Center and FRED.

Key Observations:

On Rates:

  • The corporate tax rate usually quoted is for the top bracket;
  • The corporate tax rate began to climb rapidly in 1940;
  • President Truman raised the rate from 38 % to 52 % from 1949 to 1952;
  • The tax rate peaked under Johnson/Nixon at 52.8 %;
  • President Reagan did not cut the corporate tax rate until the Tax Reform Act of 1986 (1395 pages) phasing it in over two years, reducing it from 46 % to 34 % in 1988.
  • During President Clinton’s first year in office, 1993, the corporate rate was raised to 35 percent where it has remained until today.
  • President Trump’s plan to reduce the rate to 20 percent puts it back to where it hasn’t been since 1939.

Federal Corporate Tax Receipts:

  • Corporate tax receipts peaked in 1942 at 7.52 % of GDP with a rate of 40 %;
  • Corporate tax receipts bottomed after the dot.com bust in 2002 at 1.38 % of GDP;
  • It appears that corporate tax receipts experienced a structural change in the early 1980’s and have been in the 40-year range between 1.38 % and 2.88 % irrespective of the corporate tax rate and more economically dependent. We suspect it is globalization.

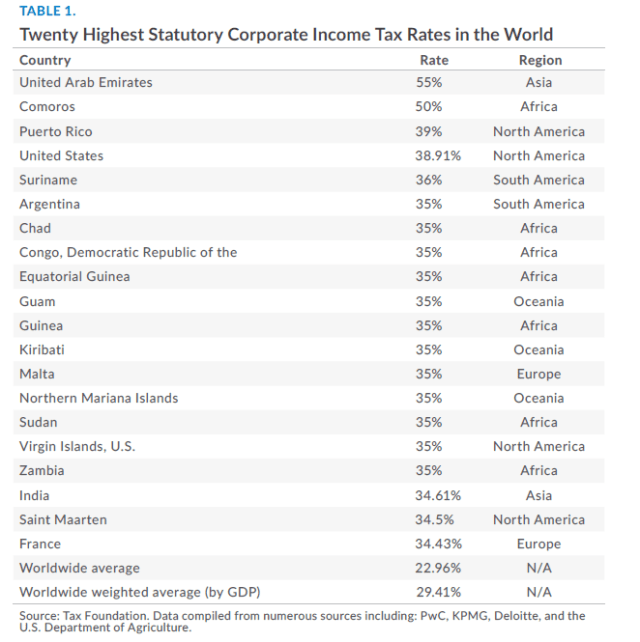
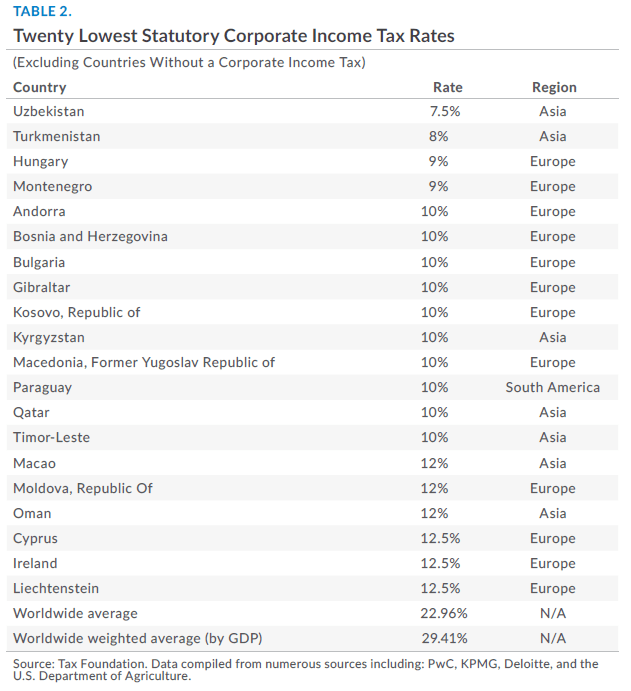
We have also added a couple charts of the highest corporate tax rate countries and the lowest coming to us via the Tax Foundation.   They note the U.S. effective corporate tax rate is among the highest in the world,

The United States has the fourth highest statutory corporate income tax rate among the 202 jurisdictions surveyed. The U.S. rate of 38.91 percent (comprised of the federal statutory rate of 35 percent plus an average of the corporate income taxes levied by individual states) ranks only behind the United Arab Emirates (55 percent),Comoros (50 percent), and Puerto Rico (39 percent). Comparatively, the average tax rate of the 202 jurisdictions surveyed is 22.96 percent, or 29.41 percent weighted by GDP.  –  Tax Foundation

Corporate Taxes_Table

Corporate Taxes_Chart

Corporate Taxes_Highest

Corporate Taxes_L

Posted in Fiscal Policy | Tagged , | Leave a comment

Bunds Wagging Treasuries

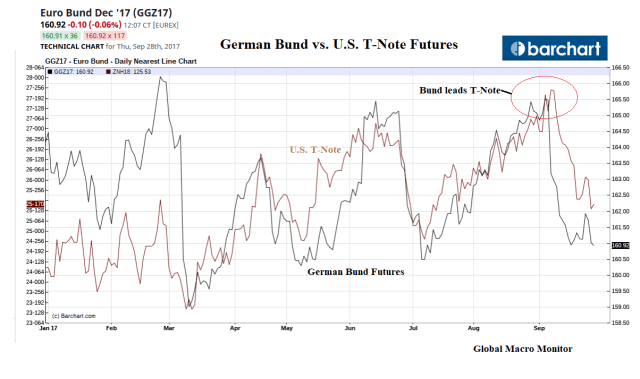
Take a look at the comparison chart of the nearest Bund and U.S. 10-year T-Note futures.

Contrary to popular belief, this latest bond market sell-off was led by the German Bund and not U.S. Treasuries, flopping due to the current market narrative of a hawkish Fed, though it is a factor.

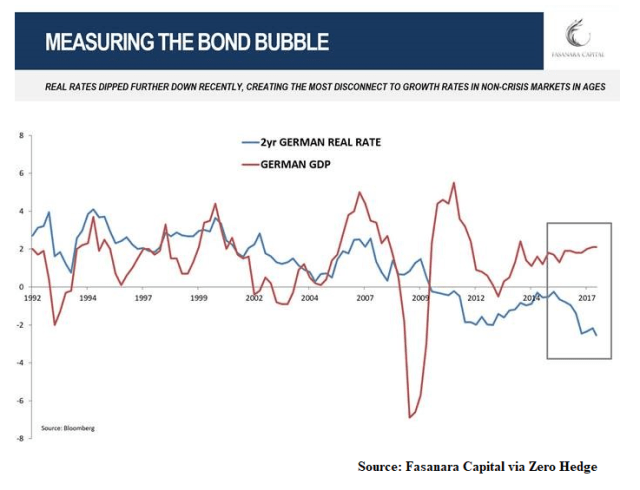
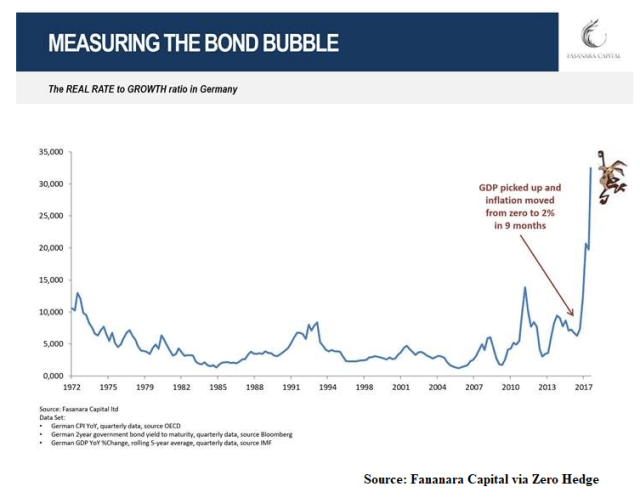
Global central banks x/ Japan are talking tough, and Europe is in a Yuuuuge bond market bubble, with the ECB way behind the curve.  That is the market where maximum bondholder nervousness lives, in our opinion.

We wonder if there are any Bunds around to trade?

The chart clearly shows the Bund peaking on September 5th versus the September 7th peak of the U.S. 10-year Treasury.

Bund_T-Note

Monitor European Sovereigns

Traders and investors should closely monitor the European bond market because that is where the bubble is and the ECB is way behind the curve given Europe’s improving economic fundamentals.


Bond Bubble_1_Sep19

Bond Bubble_2_Sep19

We think a spike in interest rates (which may be the one currently underway) emanating from Europe which spreads to the U.S., though not as acute, is the most likely trigger for an October sell-off in the global risk markets.

Equity markets are getting super lathered up over an event a long way off and has, at best, a 50/50 chance of getting through Congress.  Tax reform.

Yet event risk is legion and ubiquitous.  Any number of events, aside from an interest rate spike, could trigger the correction we are looking for.

Watch 62 basis points on the Bund yield, the 52-week high, which is now only a chip shot away.

Mr. October on deck and ready to celebrate commiserate the 30th anniversary on the 19th day of the month of, well, you know.

Stay tuned.

Posted in Bonds, Uncategorized | Tagged , , | Leave a comment

Schäuble Out As German FinMin

In our Sunday night post,  Merkel Retains Power, Far Right Moves To Bundestag, we asked:

Will the Greens demand the current German Finance Minister, Wolfgang Schäuble, step down? — Global Macro Monitor, September 24

This morning the headline on Politco.eu reads,

‘It’s over’: end of the Schäuble era – Poltico.eu

Germany_It's over


Not getting much buzz in the U.S. but this is  big news.

Sound likes Merkel is trying to woo the Free Democratic Party (FDP) into a coalition government and dangling the Finance Ministry as the carrot.  We hear the FDP wants the Finance portfolio.

If the liberals [FDP] succeed in taking over the finance ministry, they’re unlikely to abandon Schäuble’s parsimony. Like Schäuble, FDP leaders are champions of budget discipline and take a skeptical view of plans put forth by French President Emmanuel Macron, such as a substantial eurozone budget. – Politico.eu

Recall Germany’s concerns that a euro area fiscal union morphing into a transfer union.

How could Germany, with a budget surplus last year of 0.8 percent of GDP and the public debt of 68.3 percent of GDP, accept a fiscal union with Spain running the euro area’s largest budget deficit of 4.5 percent of GDP and a public debt of 100 percent of GDP?  – CNBC, May 14

If the Green Party gets the Finance Ministry it will be good news for Greece, the rest of Southern Europe and the anti-austerians.

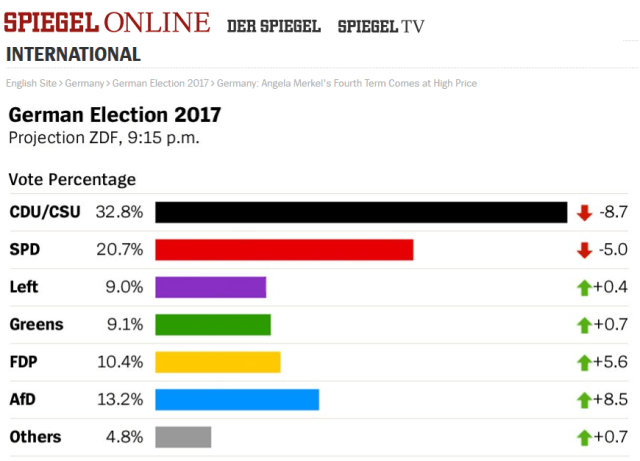
Merkel has asked Schäuble, 75, to become speaker of the parliament, which is sure to become much rowdier with the arrival of the Alternative für Deutschland (AfD), the first far-right party represented in Bundestag.  The AfD won 94 seats in the house by securing 12.6 percent of the vote on Sunday.

Markets

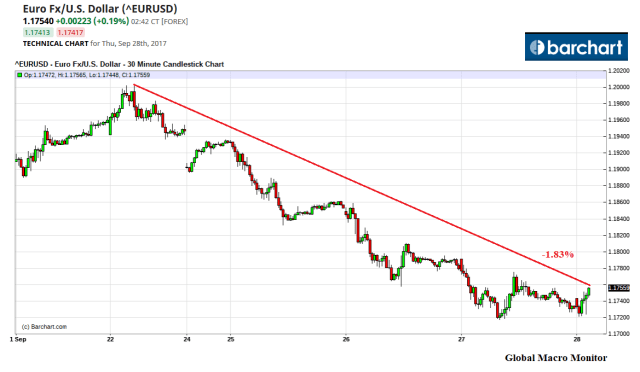
The euro has been hammered since the election and it looks like the European bond market temper tantrum is underway, as we suspected.

The soon to come European bond market temper tantrum is the external shock we expect to ignite a decent sell-off in global risk markets in October.   There are other events, such as an economic or policy shock coming out of China’s 19th National Congress of the Communist Party, that can also rock the markets.

Don’t discount a potential big macro swan coming out of Washington either.

We are not looking for a bear market, but a decent size flash-type crash that may last a few days or a few weeks, which can be bought.   Everyone is waiting to pounce — until volatility spikes and fear takes over.   It should be fast and furious, especially with the rise of the buy the dipper algos and trading ‘bots.
 – Global Macro Monitor, September 20

Euro sovereign weakness spilling into an already weak U.S. bond market, adding to the hawkish Feds speak, we believe will lead to a decent sell-off in risk assets sometime soon.  The 10-year U.S. yield is up almost 30 bps since September 7th.

Another 10 bps higher in the 10-year Bund yield will break resistence and  the European bond sell-off  could gather some momo.   Watch this space.

U.S. Tax Reform

U.S. stocks getting all lathered up over tax reform especially small caps as tax cuts affect small caps disproportionately positive.   “Harder than health care” is the word on the street in Washington about passing a tax reform bill.   The lobbyists bring out the big weapons and money during tax reform.  Budget hawks want offsets, which will take away the goodies from many special interests.

The Republicans are in their hurry-up offense as they smell a wave election coming in 2018 and they will soon be out of power.

It is starting to get interesting.

Mr. October on deck.   Stay tuned.

Gerrmany_Euro

Gerrmany_Bund

Posted in Uncategorized | Leave a comment

The Emerging Markets 30-30 Club

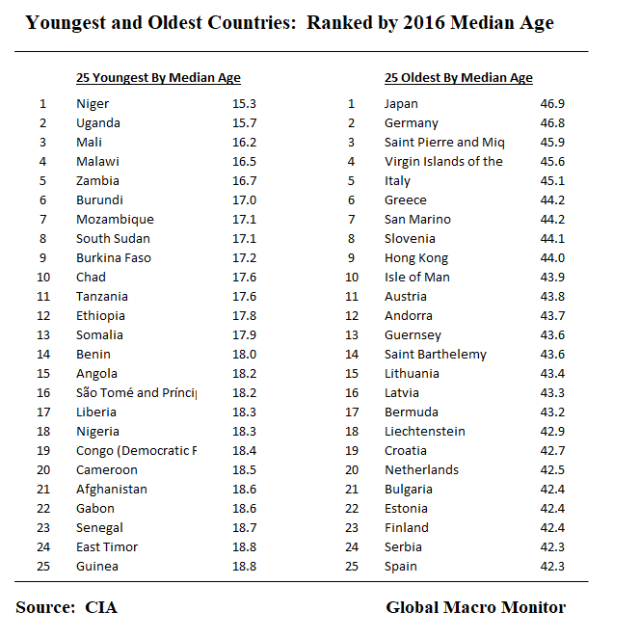
Demographics are destiny and increasingly becoming  the defining narrative of the global economy.   Japan’s aging population is blamed for much of the country’s economic woes.   Doomsters predict economic Armageddon as the world goes gray.

We put together a nice data dump for you to decide.   We also look at the relationship between investment, the median age of a country, and the IMF’s 2017-20 GDP forecast for the world’s economies.
EM_3030_Age

The 30-30 Club

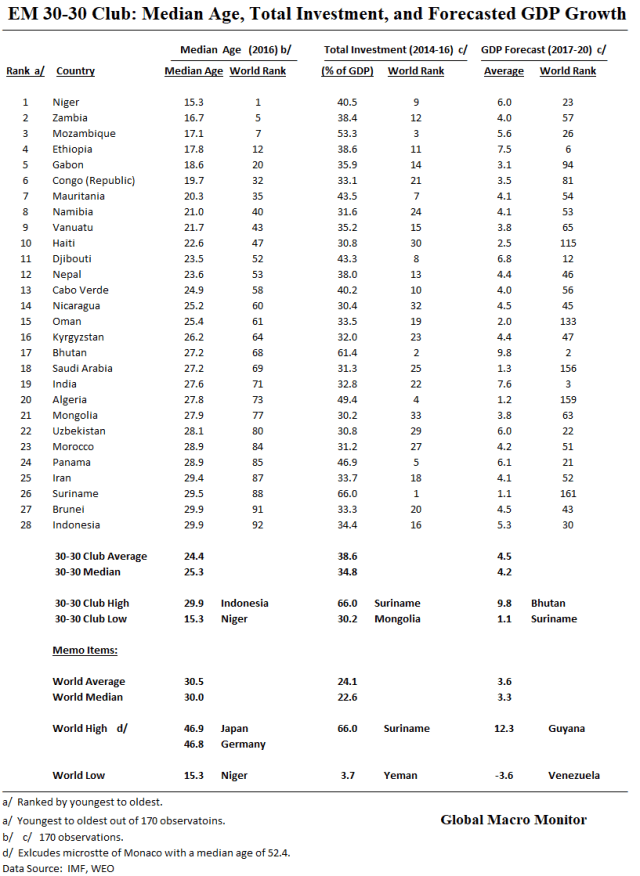
Just as major league baseball has an elite 30-30 club – where a player hits over 30 home runs and steals over 30 bases in one year – we have constructed our own  30-30 club for the global economy.     We filtered countries by median age, those under 30 years; and by investment as percent of GDP, those who averaged over 30 percent of GDP from 2014-2016.

Our 30-30 club,  in theory, should experience higher growth than other economies.  A younger population equates to a growing labor force, and higher investment should lead to higher productivity growth —  both,  the secret sauce of a dynamic economy and main factors in traditional growth models.  Human capital, or education and training,  and innovation, tougher to measure, are also additional necessary factors for dynamic economic growth.

This post is just a cursory analysis that could be the topic of many Ph.D. dissertations.  We thought about running some multiple regressions, but you do not pay us enough.

By the way,  Mike Trout was the last major league ballplayer to hit over 30 home runs and steal more than 30 bases in 2012.

G20

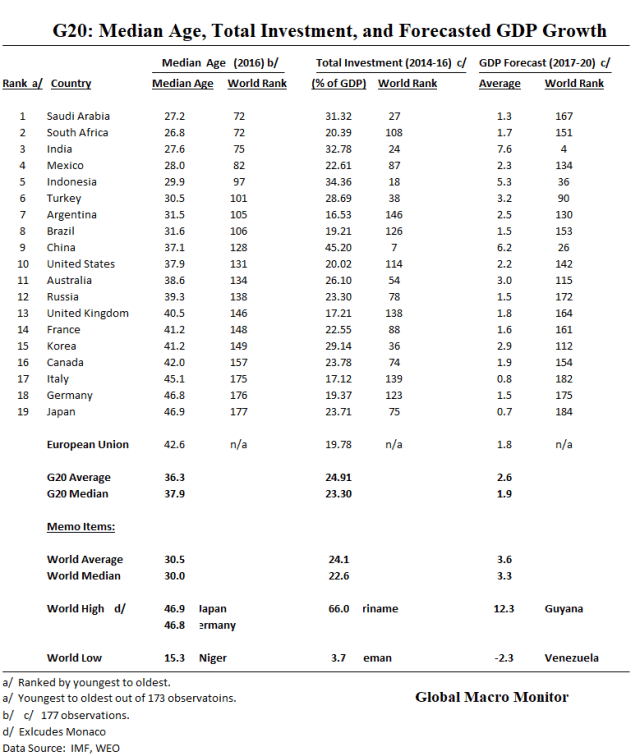
Let us first have a look at the G20 data for a reference point to compare the later data.

The G20 median age is almost eight years older than the world’s median age.  The EU is old.   Japan and Germany are the two oldest countries in the world.

The G20 investment to GDP ratio average was around 25 percent for 2014-16 .  Median forecasted growth is 1.9 percent for the 2017-2020 period.

Blasé!  Except for the outliers, especially India and Indonesia.
EM_3030_G20_Table

EM_G20_Chart

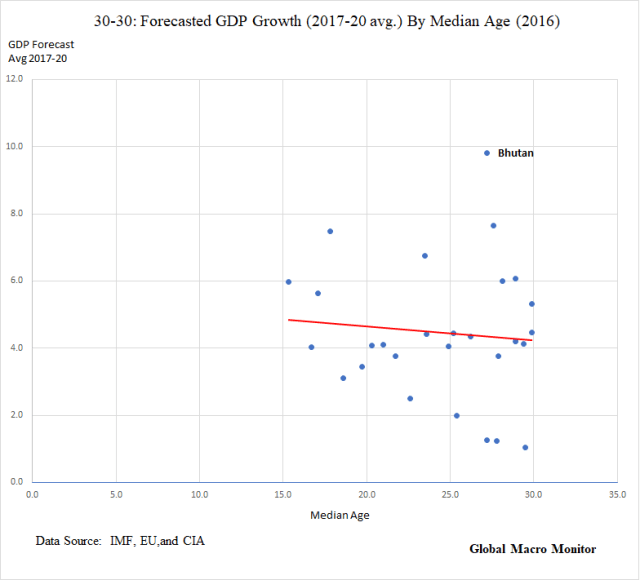
The chart shows the relationship between GDP growth and median age.   The trend line illustrates that older populations tend to grow slower than younger ones.

Yep.  It is a simplistic analysis,  other variables should be controlled for, and a better analysis would include multiple multi-variate regressions.      Grab your checkbook blockchain and send us some Bitcoin if you want us to go deeper.

Emerging Markets 30-30 Club

Only 28 out of  our 170 country sample made the cut. Both the average and median gwowth forecasts are almost 1 pecennt above the world’s.  Not that impressive but we will take it.  Saudi. Suriname, and Algeria’s flattish growth really punk the average and median.

It is no surprise that relatively small emerging markets dominate the 30-30 club except for India, Indonesia, and Saudi.    Very similar to the fact growth in the equity markets is found in the small cap stocks.
 

EM_3030_3030_Table

EM_3030_3030_Chart

The chart is interesting in that as the median age approaches 30 the deviation from the trend line gets larger.  We have to think about that for awhile.

Nevertheless,  not a tight fit but still the sign is correct – a negative relationship.  Younger countries,  even in our 30-30 club,  tend to grow faster than older countries.

The World Chart

We threw in the chart of the entire sample.  As expected the relationship is much tighter.

Moreover, the converse is true with the world chart:  as the median age increases country GDP growth converges at lower levels.    Younger economies have a much more broader dispersion of economic performance.
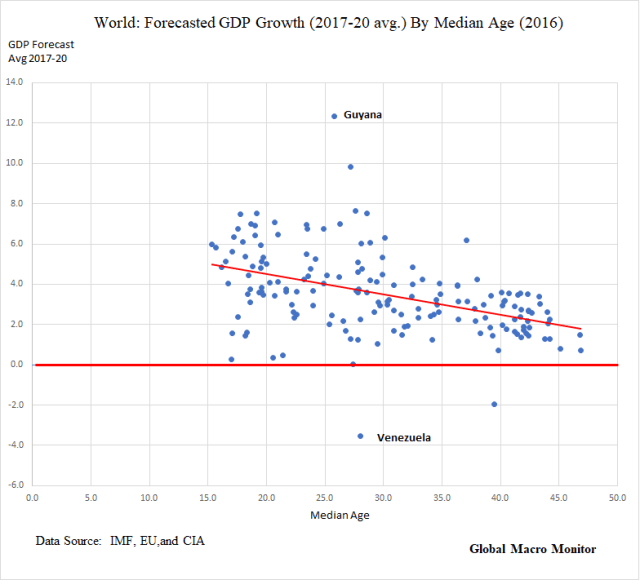
EM_3030_World_Chart

Upshot

It’s obvious.   All other things remaining equal — and they never do — you know where the growth is going to be and where the capital is going to be flowing over the next several years.

Need to nomalize valuations first,  however.


Posted in Demographics, Economics, Uncategorized | Tagged , , , , | 1 Comment

Merkel Retains Power, Far Right Moves To Bundestag

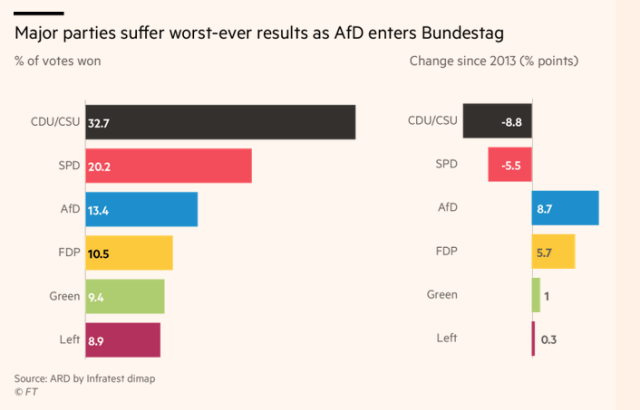
Just when you thought eMac – Emmual Macron –  had stamped out right-wing populism in Europe, here come the Germans.   The country’s two leading political parties,  the Christian Democrats (CDU/CSU – “The Union) and the Social Democrats (SPD),  who are were the governing coalition took a beating in today’s election.

German Elections_FT Chart1
The CDU,  Chancellor Angela Merkel’s party,  and its sister party, the CSU,  lost almost 9 percent of the votes won relative to 2013 and the the SPD lost 5.5 percent.

The hard right populist party the Alternative for Germany (AfD) gained nearly 9 percent; the Free Democratic Party, pro free markets, civil liberties, and globalism gained 5.7 percent;  the Green Party picked 1 percent;  and the Left Party increased by. 0.3 percent.

The Social Democrats have already stated they will move to the opposition and Ms. Merkel will have to cobble together, for the first time a three-party coalition government,  most likely consisting of the Christian Democrats (CDU, CSU), the Free Democratic Party (FDP), and the Greens.

The new government will be more unstable, and it will create more market uncertainty.

Jubilant AfD

Furthermore,  the jubilant Alternative for Germany (AfD), who campaigned to “take their country back”  (sound familiar?) will be the third largest party and will (Deutsche)mark the first time a hard right populist party is represented in the Bundestag.   Just as they are in other countries, some say this is the final normalization of German politics.

Mainz University professor Jürgen Falter saw this is a “normalisation” of German politics. – FT

Nevertheless,  in a post tonight on Spiegel Online, Stefan Kuzmany comment on the election and the AfD,

…the AfD is no ordinary party. Its ranks, even its leadership, include people who openly court far-right positions, who want to take a positive view of the German military’s actions in World War II, who play down the Holocaust and want to abolish the remembrance of it. And now those people will soon be sitting in the German parliament, the Bundestag. –  Spiegel Online

The right-wing populists have already announced their intention to “chase down” Ms. Merkel every day.

To counter the AfD,  the Chancellor Merkel may have to tact to the right, especially on immigration, but this may cause instability within her new fragile coalition.

Market And Economic Implications

Will the Greens demand the current German Finance Minister, Wolfgang Schäuble, step down?  Will the stance on the ECB’s QE policy harden?  Will FDP remain skeptical of Macron’s proposal to shore up the eurozone?

No reaction in the markets tonight with the S&P futures and the euro flattish.

On the margin,  the election results are risk market bearish and we suspect the euro some weakening in the common currency after its massive run.

But politics, generally,  are mostly noise and transitory unless they portend some major structural changes.  Populism would count as a major structure change.

More, important, however,  Europe’s economic recovery is gaining momentum.   Moreover,  Europe is in a massive bond bubble and we expect a taper tantrum sometime in the next month.    Negative rates with the current momentum is absurd.

A little over an hour to the European open.

Gute Nacth!


German Elections_Spiegel Chart2


Posted in ECB, Euro, Politics, Uncategorized | Tagged , | Leave a comment

Week In Review – September 22

Global Stock Indices

Relatively quiet week in global equity markets given the FOMC’s historic decision to start reducing the Federal Reserve balance sheet, to which we called the market action a big double cheese non-burger.

Argentina continues  rockin’ the free world, up almost over 5 percent this week and closing in on the 50 percent mark for the year.  Argentina’s competitiveness is getting a double boost with a weaker currency, down 9 percent against the dollar this year and the dollar index is down 10 percent.   That’s about 20-25 percent boost in euro terms.

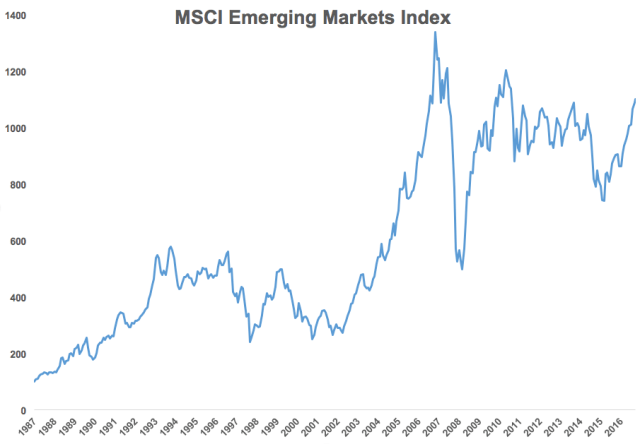
Emerging market equities have been stellar this year.

“After lagging for many years, there has been a significant breakout to two-year highs in the MSCI Emerging Markets Index relative to the S&P 500,” he wrote in a note, calling this “another indicator that the EM strength could be legitimate and should continue to be a place to find potential alpha in well-diversified portfolios.”  – Ryan Detrick via MarketWatch

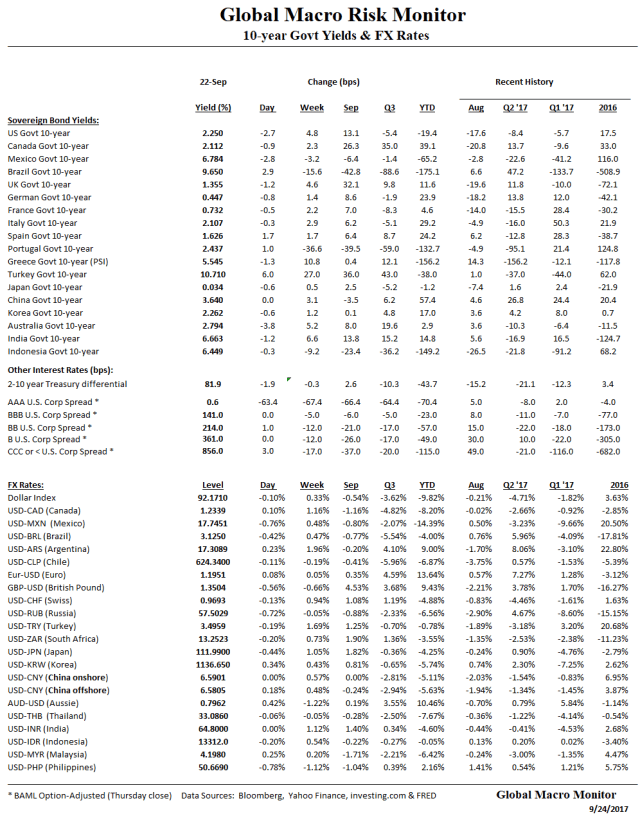
Turkey down on “dodgy” politics and as global markets begin to fret over carry trade countries with high-interest rates to attract hot money capital flows to cover current account deficits.   Turkish 10-year yield up 27 bps on the week.

Weekly_Stocks

Global 10-year Bond Yields

Big move down in Portugal 10-year yields as the sovereign recaptured its investment grade rating from S&P.   Brazil continues to come in as markets are true believers in potential economic reforms of a government under political fire.  Brazil and Indonesia bonds rates are honey to yield seeking capital in a NIRP and ZIRP world.

Turkey hit with what was noted in stock section above.

The UK and China sovereign ratings were downgraded this week.  Ratings agencies always the last to turn out the lights and markets are way ahead of the them.

The “head for spread” continues.  Junk in 12 bps.

Weekly_Bonds

Global Currencies

Dollar relatively stable and strong against EM.  The Dixie holding above the 91-92 level on the FOMC action.  Euro/$  having a tough time cracking and holding the 1.20 level.    Shorts may get nervous.

Weekly_Currency

Select Commodities

Nothing big except iron ore continues to flop.  Not that bad of a week for the complex given the Fed action.

Weekly_Commodities

Other Risk Indicators

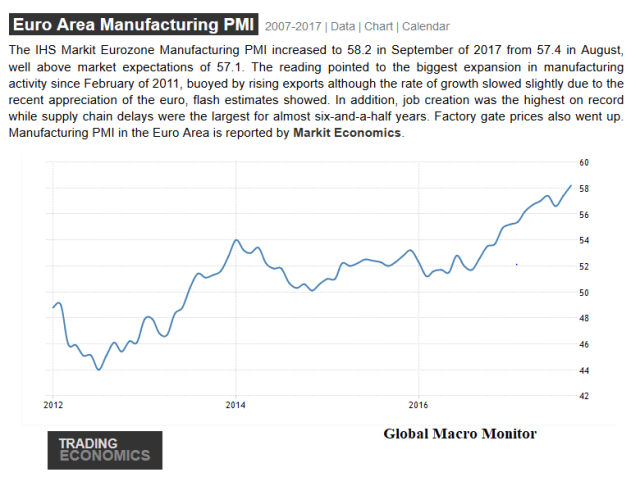
Energy stocks,  this year’s big laggard,  bought up as expectation crude in a new higher range of $50-55.   Euro banks up on stronger PMIs throughout Europe.  Russell looks like it is ready to take out new high.   Stress index and VIX lower.   Markets believe all is well.

Weekly_Other

On Our Radar Next Week

  • We are watching North Korea as tensions ratchet up.  The debacle now has morphed into what looks like a cage fight between “Twitter Man” vs. “Rocket Man”.  Markets are not going to like this.
  • Fallout of Saturday’s New Zealand election, which returned a hung parliament. Not expecting much impact.
  • The results of Germany’s election will be more interesting
  • Watching Spain for potential instability leading up to Catalonia’s independence vote on October 1.
  • Watching fallout from Kurdish independennce vote from Iraq set for Monday.   Turkey not happy.
  • Will Aaron Rodgers, QB of the Green Bay Packers, take a knee in today’s game? President Trump’s tirade against the NFL in his speech in Alabama on Friday night is blowing up in his face and has transformed a racial issue into an assault on the First Amendment.  Caesar should not pick on the circuses and the gladiators.  Always a losing proposition to awaken the masses.
  • Lots of Fed doves speak next week. Janet Yellen at 11:50 eastern on Tuesday.
  • Economic data: Wednesday – Durable goods; Thursday – GDP, and Friday – Personal Income.
  • Most important,  European bond markets as ECB is way behind the curve, especially given last week’s strong PMIs (see the chart below)

Notice a prevailing narrative from the above?

The whole world, even now the west, is slouching toward tribalism.

Most important, we are preparing for the coming October correction we have been looking for.

Stay thirsty, my friends.

Key Charts

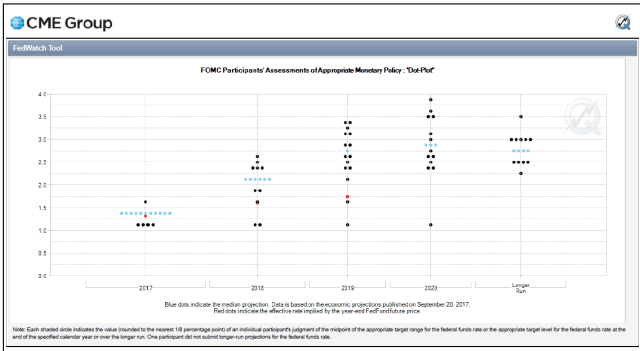
The red dot represents the markets’ expectation versus  FOMC dots.  Market expecting much lower policy rates than Fed officials.  See here.

Weekly_Charts_4

Weekly_Chart2

Weekly_Chart1


Posted in Uncategorized, Week in Review | Tagged , , , , | Leave a comment

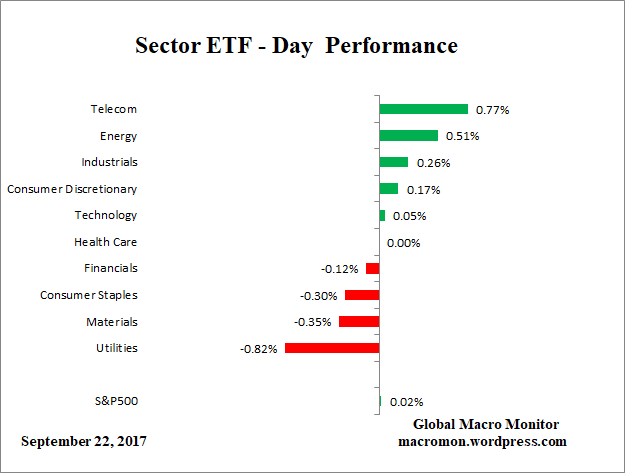
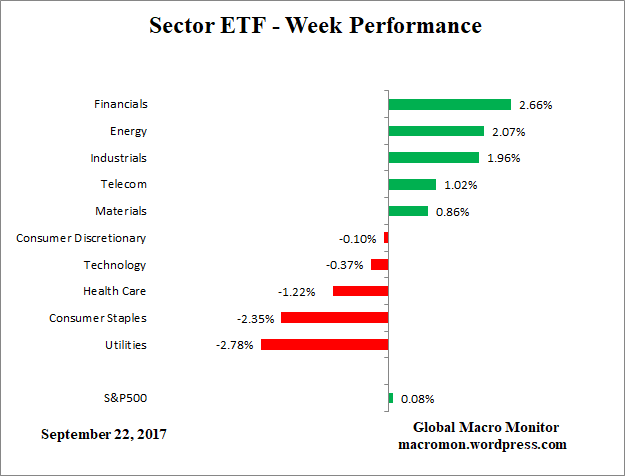
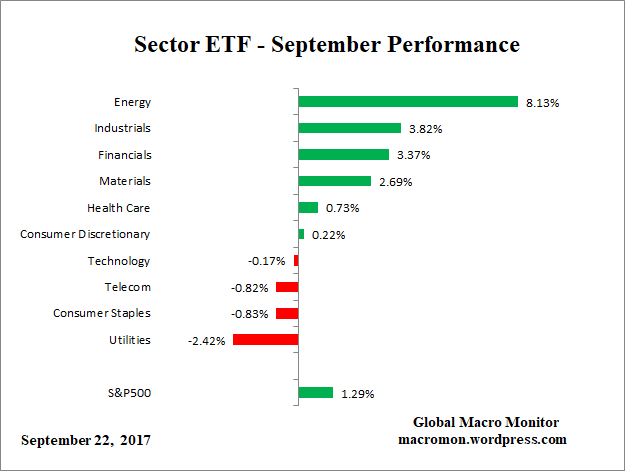
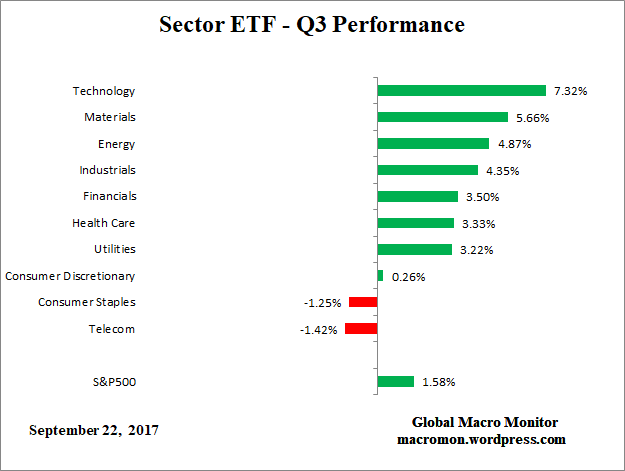
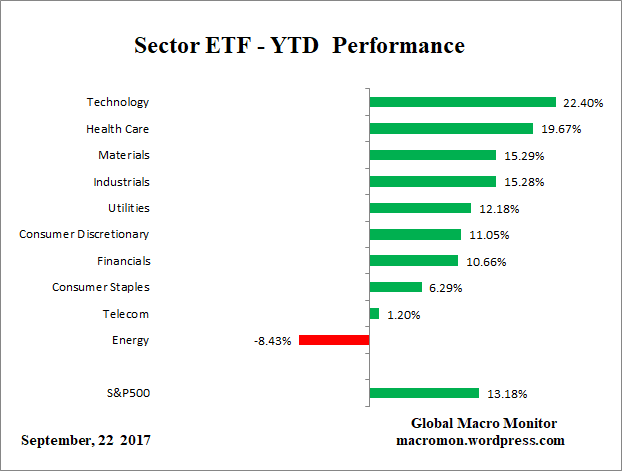
Sector ETF Performance – September 22

ETF_DayETF_WeekETF_MonthETF_QETF_YTD

Posted in Sector ETF Peformance | Tagged , | Leave a comment

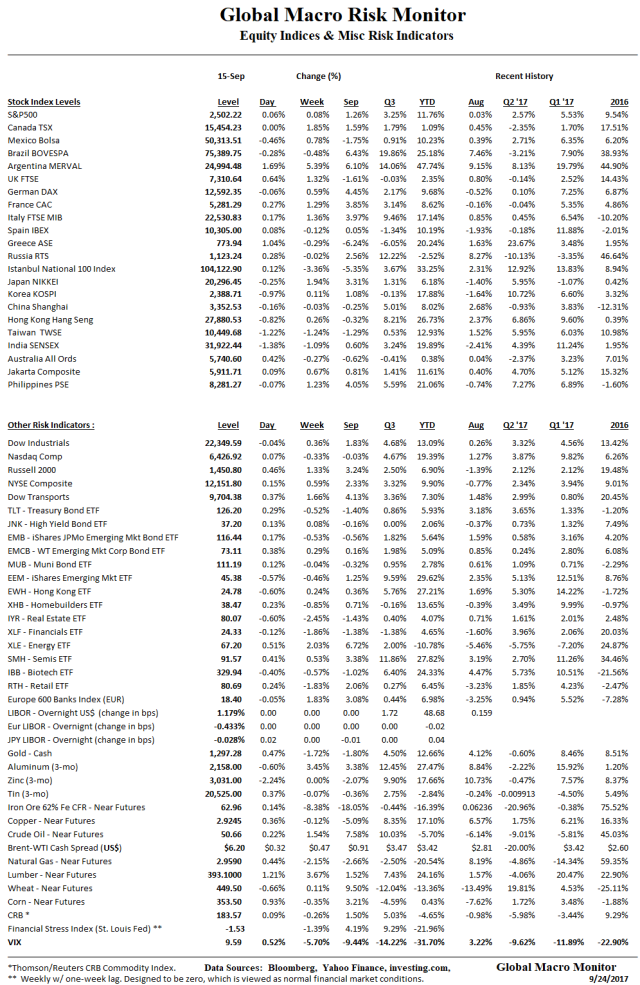
Global Risk Monitor – September 22

RiskMon_1


RiskMon_2

Posted in Daily Risk Monitor, Uncategorized | Tagged , , , , , | Leave a comment

The Sermon On The Mount[ain Of Debt]

“Blessed are the young, for they shall inherit the national debt.” – President Herbert Hoover

The Hoover administration thought there was no room and was ideologically opposed to fiscal expansion to stimulate aggregate demand.  Furthermore, Keynesian theory was not even developed at the time.  The General Theory of Employment, Interest and Money  was not published until February 1936.

A policy error, partially due out of  ignorance, that led to the Great Depression, though it was monetary policy and the Fed’s failure as “lender of last resort” that “put the Great in the Great Depression.”

…what happened is that [the Federal Reserve] followed policies which led to a decline in the quantity of money by a third. For every $100 in paper money, in deposits, in cash, in currency, in existence in 1929, by the time you got to 1933 there was only about $65, $66 left. And that extraordinary collapse in the banking system, with about a third of the banks failing from beginning to end, with millions of people having their savings essentially washed out, that decline was utterly unnecessary  – Milton Friedman

Here is Ben Bernanke,

The problem within the Fed was largely doctrinal: Fed officials appeared to subscribe to Treasury Secretary Andrew Mellon’s infamous ‘liquidationist’ thesis, that weeding out “weak” banks was a harsh but necessary prerequisite to the recovery of the banking system. Moreover, most of the failing banks were small banks (as opposed to what we would now call money-center banks) and not members of the Federal Reserve System. Thus the Fed saw no particular need to try to stem the panics. At the same time, the large banks – which would have intervened before the founding of the Fed – felt that protecting their smaller brethren was no longer their responsibility. Indeed, since the large banks felt confident that the Fed would protect them if necessary, the weeding out of small competitors was a positive good, from their point of view. – Ben Bernanke

National Debt

06/29/1929 =  16,931,088,484.10    (16.8 % of GDP)

09/20/2017 =  20,179,769,858,967.22     (104.9 % of GDP)

Source:  U.S. Treasury Department

How many generations can keep “kicking the can down the road”?

Have we finally bumped up against the upper bound of the debt limit?   “This Time Is Different.”

Prepare for the “clash of generations.”

It has already started.

.
Ernie_Kicking the Can

Ernest Hemingway “kicking the can the down the road” in Sun Valley, Idaho.

Posted in Debt, Demographics, Uncategorized | Tagged , | 17 Comments