Chart of the Day: Euro Rescue Pie

(click here if chart is not observable)

Posted in Black Swan Watch, Chart of the Day, Charts, PIIGS, Sovereign Debt, Sovereign Risk | Tagged , , | Leave a comment

Connect the Carry Trades

Wow! This chart from the Economist looks like one of those elementary school exams where you draw lines to connect the best match.   So, our friends,  a few questions.  Which rates are the result of financial repression, capital flows, and/or stellar credit risk.   And what is the best carry trade, assuming you can borrow close to the sovereign.   Make sure your lines are clear.

    (click here if chart is not observable)
Posted in Bonds, Charts, Monetary Policy, PIIGS, Sovereign Debt | Tagged , | Leave a comment

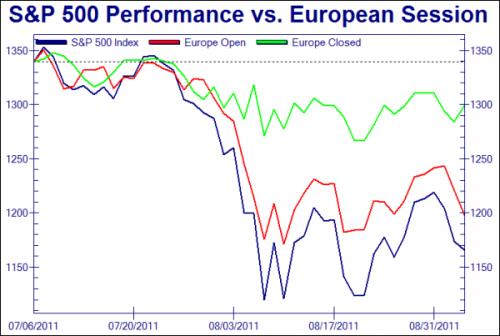
The Euro Trashing of the S&P500

Great chart posted by Zero Hedge citing John Lohman, also a friend of this blog,  showing how the S&P500 would be almost 10 percent higher if it only traded during hours when Europe was closed.   No doubt the robo traders have their buy programs kicking in as soon as Europe closes.  Today was a perfect example.  As ZH points out it works until it doesn’t.   Just like bull markets.

(click here if chart is not observable)
Posted in Charts, Equities, Euro | Tagged , | 2 Comments

Quote of the Day: Guessing Game

The problem we have now is that stocks need to prove themselves. There just isn’t any reason to believe that the lows are going to hold at this point. It certainly is possible, but at this point all you can do is cross your fingers and play the bottom guessing game. 

– James “Rev Shark” DePorre,  TheStreet.com

Posted in Equities, Quote of the Day | Tagged , , | Leave a comment

Time for the IMF and G20 to save Europe?

Provocative FT piece by Barry Eichengreen & Co.  on why the IMF and G20 need to step up and help Europe save the Euro.    The article notes Europe is in a destabilizing feedback loop,

The eurozone is caught in a vicious circle. Sovereign credit is deteriorating, reducing confidence in banking systems, which in turn increases the likelihood that governments will have to assume additional bank liabilities. This further impairs sovereign credit, which further undermines confidence in the banks.

Europe’s leaders have shown themselves incapable of breaking this vicious cycle, raising the danger of the European crisis becoming a global crisis. It is now past due time for the International Monetary Fund and Group of 20 to intervene.

The piece outlines a four point comprehensive solution for Europe’s debt crisis:

1) Consistent accounting treatment and regulatory oversight of European banks’ sovereign exposures through the European Banking Authority (EBA).   The EBA would have authority to set reserves on banks’ impaired sovereign debt, which would make it easier to provide debt relief to the highly indebted countries.

2) A TARP-like direct injection of capital into European banks from the EFSF.   A sub-facility financed by Asia to purchase preferred shares in the European banks;

3)  A larger bank liquidity facility through the expansion of the Fed’s dollar swap lines with the ECB. Asian central banks flush with dollars would also provide dollar funding to European banks;

4)  Debt reduction facility along the lines of the Brady Plan for the crisis countries.   This would also include Debt-for-equity, debt-for-environment, and debt-for-education swaps.

It’s an interesting piece, the only comprehensive solution out there, and well thought out.  We suggest you take the time and read it.    As Europe flounders, in the words of Angela Merkel, “the fall won’t be boring.”  Click here for full FT article.


Posted in Black Swan Watch, Euro, PIIGS, Policy, Politics, Sovereign Debt, Sovereign Risk | Tagged , , , , | Leave a comment

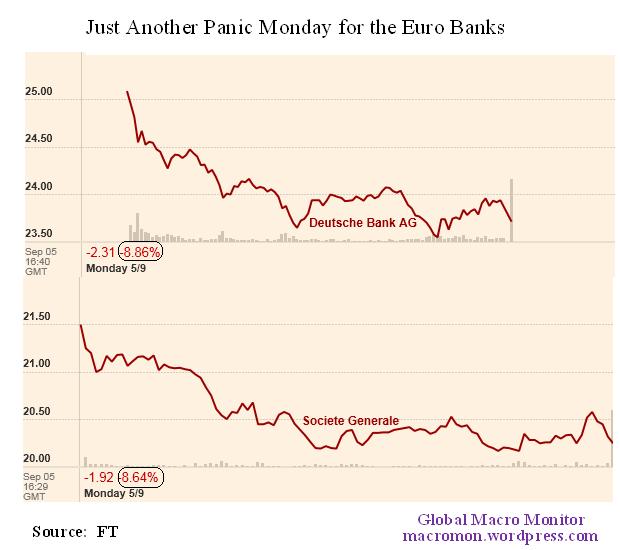
Just Another Panic Monday in Euroland

Buckle up.

(click here if charts is not observable)

Posted in Black Swan Watch, Equities, Euro, Sovereign Debt, Sovereign Risk | Tagged , , , , , | 1 Comment

Greece: Where “Tax Evasion is a National Sport”

(click here if video is not observable)

Posted in Black Swan Watch, PIIGS, Sovereign Debt, Sovereign Risk | Tagged , | Leave a comment

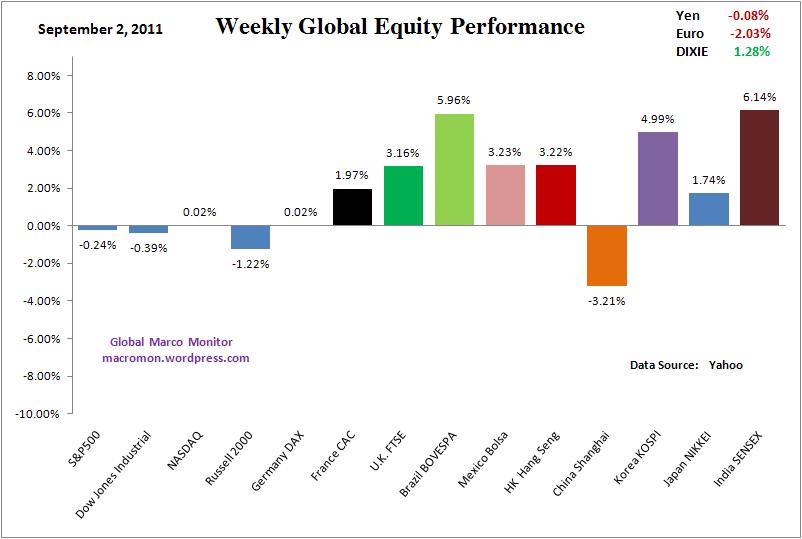
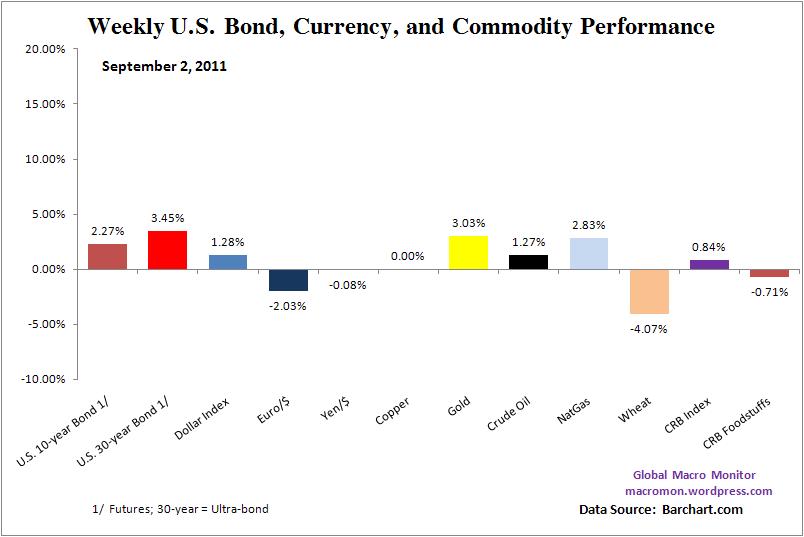
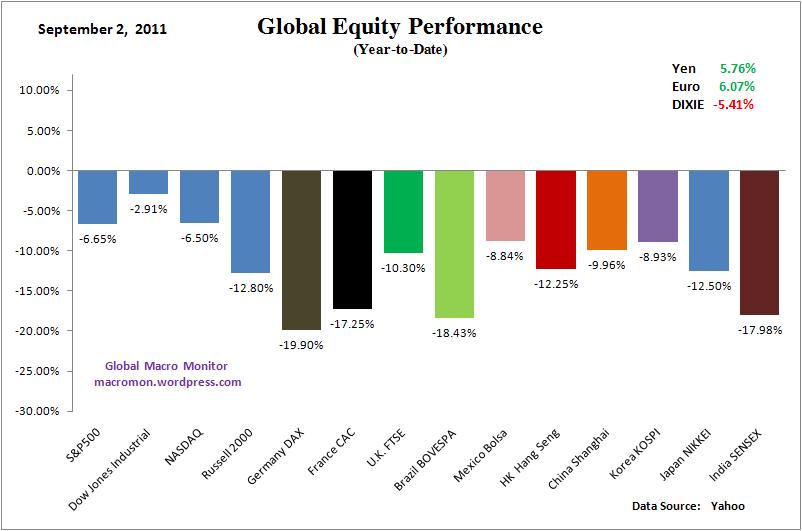
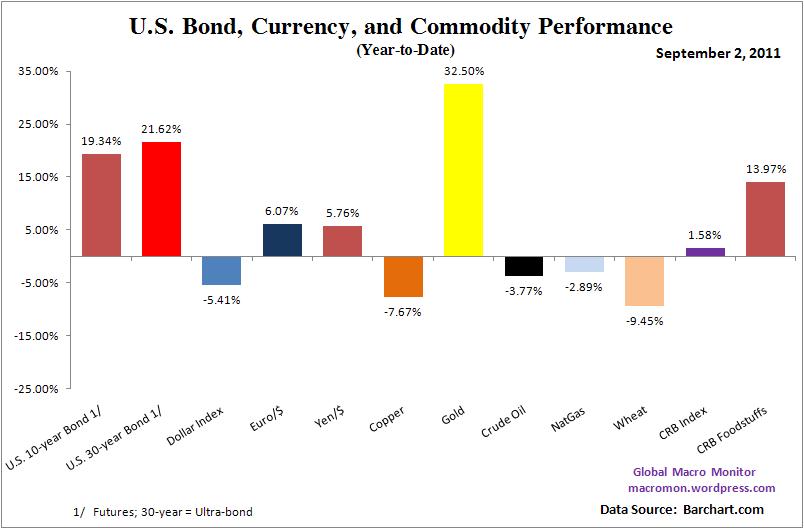
Week in Review: Wake Me Up When September Ends


(click here if charts and video are not observable)

Posted in Week in Review | Tagged , , , , , , | 1 Comment

Global Trend Indicators

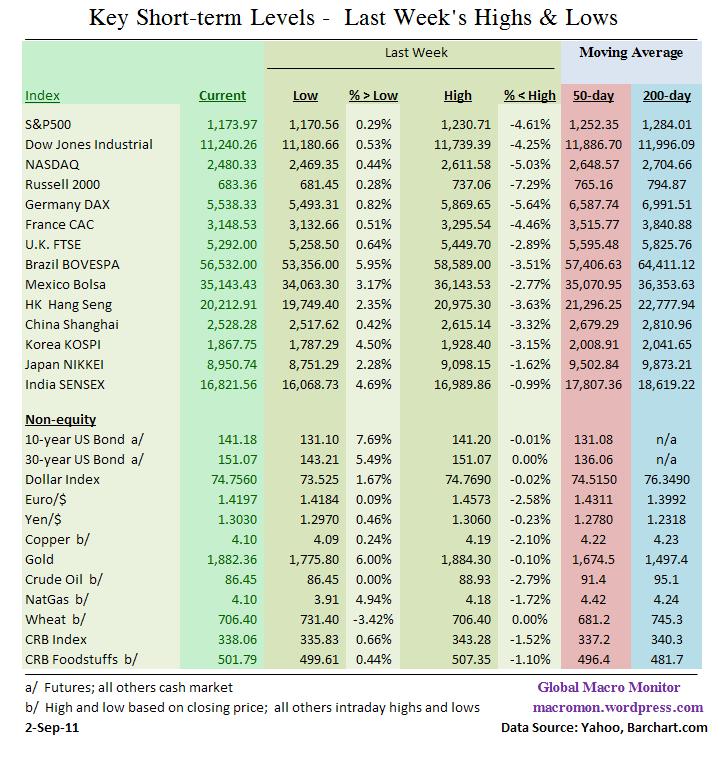
(click here if tables are not observable)

Posted in Global Trend Indicators | Tagged , , , , , , , | 1 Comment

S&P500 Takes the “Road Not Taken”

Two roads diverged in a wood, and I,
I took the one less traveled by,
And that has made all the difference.  – Robert Frost, 1915

Robert Frost may have been the greatest contrarian trader, no?

Our post of August 22nd, S&P500 Faces a Fork in the Road,  noted the S&P500 faced a fork in the road.  One path, the 2010 bullish trajectory bolstered by Jackson Hole; the other, the bearish 2008 trajectory, the result of, say, a European sovereign induced banking crisis.

From the post to yesterday’s close, the S&P500 was up almost 8.5 percent generating its “best eight-day gain since 2009.”  Not a lot of fundamental news to explain the rally so let’s just call it for what it is/was,  a Robert Frost rally.

The road not taken,  less crowded, and most shorted was the path of least resistance in a quiet market with very little macro headlines.   We noted hedge funds, some with almost no tolerance for short-term pain, had opened their biggest net short positions in the S&P500 since early 2008.   Hence the rally.

Where to now?   We’re not certain, but Bespoke does note September is the cruelest month for stocks, the S&P500 is having trouble at 1230, which is right at the 50 percent retracement of the recent crash, and the Europeans will be returning from their holiday at Swan Lake.

Even given our uncertainty where equities are headed, we note most global stock indices have attempted to put in W bottoms and it therefore essential the August 9th 1101 low on the S&P500 holds.   Our sense, however, volatility is about to pick up in the next two months.   Our best guess is the S&P500 and other equity indices will enter an expanding triangle pattern (see chart below)  in September and October before deciding how to close the year.   Best to buckle up.  But, hey, what do we know?

(click here if chart is not observable)
Posted in Charts, Equities | Tagged , , | 4 Comments