Inflation, Minimum Wages, Suicide, & Karl Marx

Is the rise of the global populism the result of a mismeasurement of inflation?

“Look around the world, I see small revolutions everywhere, in France with the gilets jaunes, Brexit in the UK, the election of Trump. I see a lot of angry people. You know, I grew up in France, so I had a good dose of Marx in my education. The first thing Marx teaches you is that revolutions are typically the result of inflation. Marx was wrong about many things, but he was right in that inflation is a deeply destabilizing force.”  — Louis-Vincent Gave, CEO of Gavekal Research,

Seeing lots of inflation as we enter the New Year — from milk and Subway sandwiches to big price spikes on restaurant menus.   It’s anecdotal and we have no doubt the government statisticians will find a way to massage the price hikes away.  They always do as they need to do.

Retailers Passing On Wage Costs

It now looks like retailers are passing on the relatively large increases in the minimum wage that went into effect on January 1st — between 8-15 percent in some California cities  — to consumers.

Maybe that’s partially why the stock market is going apeshit –margins are safe?
Min_Wage_2

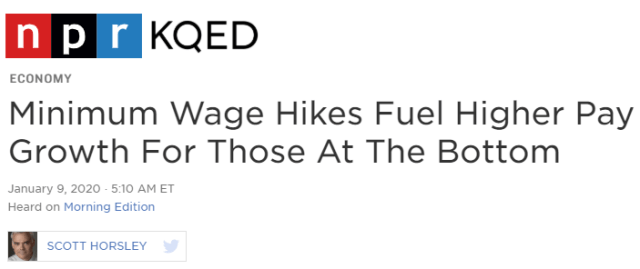
While the federal minimum wage hasn’t changed in more than a decade — it’s still $7.25 an hour — many cities and states have adopted higher thresholds. In Arizona, Colorado and Maine the minimum wage is already $12 an hour. Minimums are higher still in California, Massachusetts and Washington state. – NPR

There is no doubt the White House will be taking a victory lap even though they had very little direct impact on the recent minimum wage increases.  The strong labor market does make them doable, however.

Moreover,  does it really move the needle for the standard of living of someone increasing their hourly salary from $12 to $13 per hour?

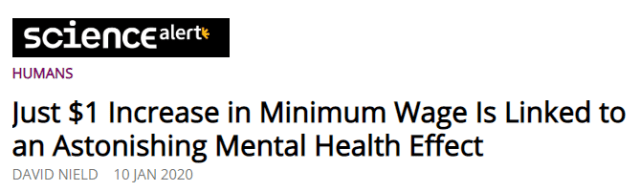
Apparently, for the high school and less educated it does improve mental health.   A new academic study speculates that raising the minimum wage can reduce the suicide rate for non-college educated workers,
Min_Wage_4

The new study suggests that raising the minimum wage in every US state by $1 between 1990 and 2015 could have prevented somewhere in the region of 27,550 suicides.

…the researchers estimate a 3.5-6 percent reduction in the suicide rate for every dollar increase in the minimum wage – that’s for those with a high school education or less (a group that saw 399,206 suicides between 1990-2015), with higher drops likely during periods of high unemployment.  — ScienceAlert

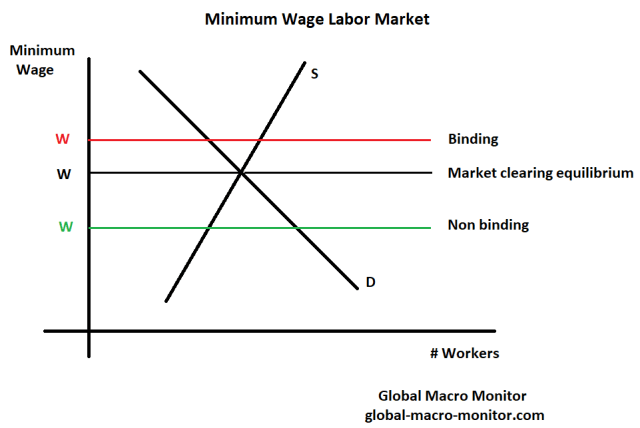
Binding versus Non Binding Minimum Wage

We really didn’t think the minimum wage rate was binding in California as some companies pay a much higher starting hourly wage for unskilled labor.

Recall our post from April 2018 with the photo I snapped at an In-N-Out in Marin County.

 

Apr24_In and Out


That’s a starting hourly wage of $16.00 to flip burgers, folks, which is close and, in some cases, more than what some high school substitute teachers make.
Min_Wage

We are economists and do believe a binding minimum wage will reduce employment, which depends more on the local labor market and small business conditions.   Because labor supply and demand curves are not observable in the real world, it’s always difficult to definitely forecast the ultimate outcome and must be done on a case-by-case basis.

Money Illusion

As I checked out at the grocery market the other night,  I mentioned to the cashier how surprising it was to see so many 10 plus percent price hikes on store items.  We then launched into a discussion about the recent increase in the minimum wage, which I perceived that it applied to her.   It wasn’t that long ago when a checker at a major grocery store was a decent middle-class job.

She responded something to the effect,

“A lot a good the wage increase is going to do, if we have to pay higher prices for food and other things.”  

She sounded like an economist pontificating on real wages!  She may not formally understand the laws of economics but sure acts as if she does.   Sorry, Noah, I still like Friedman’s pool player/physics analogy.

Inflation

If there is anything that will blow up the huge global bond market bubble, which will then torch the stock market bubble, it will be the realization that inflation is on the rise.  Mr. Market has been so gaslighted into thinking there is no inflation and that deflation lurks behind every 5 percent correction in the S&P500.  He has to believe, however, as the perception of this bull market’s longevity depends on it.

Because the market believes this, the Fed has to do it’s rain dance the central bank will ride to the rescue of every market downturn an extinguish the perception of an imminent deflationary economic collapse.  There doesn’t appear a path of extraction from this silly policy as the markets and central bank relationship is far beyond the tipping point and now exorbitantly linked.

We have been preaching, pounding the table, and debating for years that the official inflation numbers do not reflect life in the real world.  The government has a big incentive to keep the inflation rate low as 50 percent of Americans are dependent on government entitlement programs, many of which have cost of living adjustments (COLA) linked to the change in the CPI index.    Higher inflation = bigger deficits.

Karl Marx On Inflation

We were very pleased to have stumbled upon an interview with Louis-Vincent Gave, CEO, and co-founder of Gavekal Research last October.  Gave is one smart dude and he confirmed our suspicions, and then some,

I don’t buy the argument that we have deflation everywhere.

Why not?

Look at the median CPI in the US: It’s at a ten year high. Look around the world, I see small revolutions everywhere, in France with the gilets jaunes, Brexit in the UK, the election of Trump. I see a lot of angry people. You know, I grew up in France, so I had a good dose of Marx in my education. The first thing Marx teaches you is that revolutions are typically the result of inflation. Marx was wrong about many things, but he was right in that inflation is a deeply destabilizing force. We are being told today that there is no inflation, but if you take a basket of the 72 most bought items at Walmart, the price of that basket is up 4,8% year on year. So, if you are among the poorest people in America and you buy your Walmart items, your cost has gone up 4,8%, while your wages go nowhere. Should we be surprised that people are angry?  –  TheMarket

There are a lot of gems in this interview, folks, and we encourage implore you to give it a thorough read.

Prices In The Real World

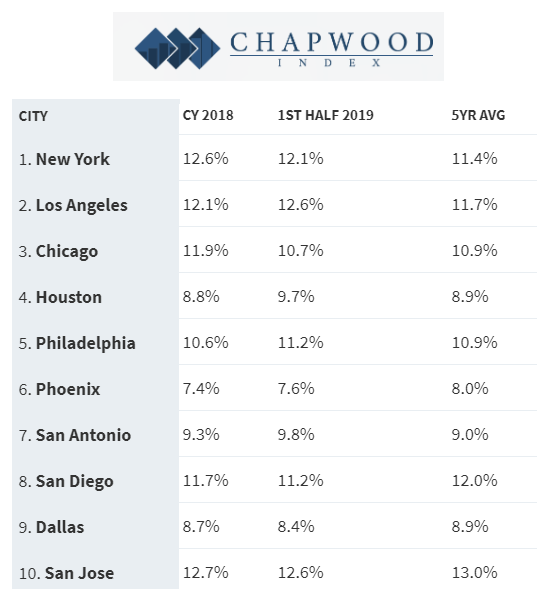
If you want a good idea of what real prices on real things and real services are really doing in the real world follow the Chapwood Index,

The Chapwood Index reflects the true cost-of-living increase in America. Updated and released twice a year, it reports the unadjusted actual cost and price fluctuation of the top 500 items on which Americans spend their after-tax dollars in the 50 largest cities in the nation.  – Chapwood Index
Min_Wage_3

Bill Fleckenstein @fleckcap


Stay tuned, folks, we will be pounding the table even harder in 2020.

Just a heads up.  The Global Macro Monitor will soon be moving to a subscription-based model, which will restrict some premium posts to subscribers only.   We have researched and thought long and hard about the fee.  We have many readers from weak currency countries and don’t want to price them out.   We are contemplating a low monthly nut of, say,  around $10, which is fair and should attract enough subscribers to make it worth our time.  Free to $10 is inflation, no?  Stay tuned.  

Posted in Bonds, Inflation/Deflation, Uncategorized | Tagged | Leave a comment

COOLEST TECH at CES 2020

Posted in Uncategorized | Leave a comment

QOTD: War And Truth

QOTD – Quote of the Day

In war, truth is the first casualty. – Aeschylus

Posted in Uncategorized | Leave a comment

U.S. Troop Levels In Iraq

Great graphic from Stratfor, who, BTW, is running a great subscription deal.  You’re gonna need some good geopolitical analysis in 2020.  That we can be certain.  See here.

It seems like Mr. Market is the only one who didn’t see the Iranian retaliation coming.

EMH* über alles!   NOT!

Godspeed to our soldiers.

* Efficient Market Hypothesis


US Troop Levels In Iraq

Posted in Uncategorized | Leave a comment

U.S. Trade Deficit Shrinking And It’s All China

Trade_Deficits_2


JANUARY 7, 2020 — The U.S. Census Bureau and the U.S. Bureau of Economic Analysis announced today that the goods and services deficit was $43.1 billion in November, down $3.9 billion from $46.9 billion in October, revised

November exports were $208.6 billion, $1.4 billion more than October exports. November imports were $251.7 billion, $2.5 billion less than October imports.

The November decrease in the goods and services deficit reflected a decrease in the goods deficit of $3.9 billion to $63.9 billion and a decrease in the services surplus of less than $0.1 billion to $20.8 billion.

Year-to-date, the goods and services deficit decreased $3.9 billion, or 0.7 percent, from the same period in 2018. Exports decreased less than $0.1 billion or less than 0.1 percent. Imports decreased $3.9 billion or 0.1 percent. – Census Bureau

Trade_Deficits

2019 Merchandise Trade Deficit (Excludes Services) To Improve By $30 BN

Interesting chart (see below) of the dynamics of the U.S. Merchandise Trade Deficit (excludes services).  Based on our December estimate, which is an extrapolation of the prior three months,  the U.S. Merchandise Trade (goods) deficit will improve by around $30 billion in 2019 from its 2018 level.

All China

All of the improvement, and then some, comes from a $100 billion reduction in the merchandise trade gap with China.   We have also included the U.S, growing trade deficit with Vietnam in the chart below, which mirrors China over the past few years and illustrates the trade diversion caused by the tariff wars.

Trade Diversion

Some believe that supply chains will move en masse out of China to other areas, such as Vietnam.   True on a relatively limited basis but these countries are too small to scale and absorb even a modest move of supply chains out of China.   The data also illustrate that tariffs, when used as a tool for import-substitution — i.e., a policy to move supply chains back onshore — are relatively ineffective.


Trade_Deficits_GMM

Posted in Trade War, Uncategorized | Tagged , , | Leave a comment

The Best Gear & Gadgets From CES Unveiled 2020

Posted in Apple, Technology, Uncategorized | Tagged | Leave a comment

COTD: China’s Social Credit Score System

COTD:  Chart of the Day

Background:

The Social Credit System (Chinese: 社会信用体系; pinyin: shèhuì xìnyòng tǐxì) is a national reputation system being developed by the Chinese government. The program initiated regional trials in 2009, before launching a national pilot with eight credit scoring firms in 2014. In 2018, these efforts were centralized under the People’s Bank of China with participation from the eight firms. By 2020, it is intended to standardize the assessment of citizens’ and businesses’ economic and social reputation, or ‘Social Credit’.

The system will be one unified system and there will be a single system-wide social credit score for each citizen and business.The system is considered a form of mass surveillance which uses facial recognition system and big data analysistechnology. In 2019, it is estimated that 200 million monitoring CCTV cameras of the “Skynet” network have been put to use in mainland China, with eight Chinese cities ranked among the world’s top ten most monitored cities, while the number of surveillance cameras is expected to reach 626 million by 2020 when the Social Credit System becomes fully effective.  –  Wikipedia


China_Social_Credit_Score

Hat Tip:  Patrick Chovanec  @prchovanec


Posted in China, Uncategorized | Tagged , | 2 Comments

Stock Market Returns And Presidents – Beware Of Averaging

We have warned about looking at averages (see here), especially with such skewed distributions and how a couple outliers can greatly distort this most common statistical metric.

Real Life Macro Economy Example: 

2019 Q1:  Average U.S. Household Wealth =  $803.3K   
                  Median U.S. Household Wealth =   $112.5 K    – GMM,  Sep 2019

Even the MSM is now questioning the macroeconomic data because of our two-speed economy — one for the well-off and one for the not so — as exemplified in this New York Times headline, which we will address in a week or two.

Predential_S&P_6

The Average Stock Market Return of All Presidential Administrations

The same applies to average stock market returns, especially during presidential administrations, which are distorted, distributed and touted during election years.

So when we saw the following CNBC headline, which was then subsequently repeated in a presidential Tweet, we thought it necessary to dig deeper and use a little Sabermetric-esque analytics.  We even provide you with some of the raw data as not to appear too partisan.

As Always 

Just the facts ma’am  — no obfuscation, twisted reality using distorted averages with outliers, and with context.


Predential_S&P_4.png

  • The S&P 500 has returned more than 50% since President Trump was elected, more than double the average market return of presidents three years into their term, according to Bespoke Investment Group.

President Donald Trump’s stock market stacks up well against the majority of his presidential predecessors.

The S&P 500 has returned more than 50% since Trump was elected, more than double the 23% average market return of presidents three years into their term, according to data from Bespoke Investment Group dating to 1928. — CNBC, Dec 26th

Really?

We haven’t tried to replicate the data in the article and do not doubt its veracity but do believe it needs some context to reflect current reality.

Beware Of Averages

Remember, if I am having a beer with a couple buddies at our local dive bar and we’re the only customers in the joint. and in walks Bill Gates, we are all now billionaires on average.

We show below that the first three-year performance of the S&P in three out of the last four presidencies equaled or outperformed President Trump’s stock market – i.e., Bush#41 to Obama.

Presidential Stock Returns

We have posted similar data but here you go again,


Predential_S&P_1

Dead Ball Era v. Juiced Economy & Stock Market

First, we thought it important to look at S&P500 returns (index changes) of post-WW II presidents.   The S&P500 was created in 1957 and using the data, which was created a back history just doesn’t make us feel comfortable.  The integrity of the data is always an issue, in our book.

Second, the context of the data is important.

Just as Sabermetrics makes the distinction of, say, home runs hit during the “dead ball” era, where the home run league leader hit less than 10 home runs during the entire season in 13 of the years between 1900-1920.   Similarly, the economy and stock market are now “juiced” with large budget deficits, negative real interest rates, and quantitative easing.   It is difficult to compare today’s stock market dynamics to that of President Harry Truman, for example.

Juiced

The average annual average budget deficit from Ike’s first administration to the end of the Carter administration was -1.2 percent compared to -3.3 percent from Reagan to Trump.   Even excluding the outliers of the Clinton surplus years and Obama deficits after the Great Financial Crisis (GFC), the post-Carter average annual fiscal deficit still is 3 plus percent.

Enough has been said about our super juiced monetary policy, which we believe the genesis of the moral hazard with respect to the stock market began at the October 1987 stock market crash.

The Data

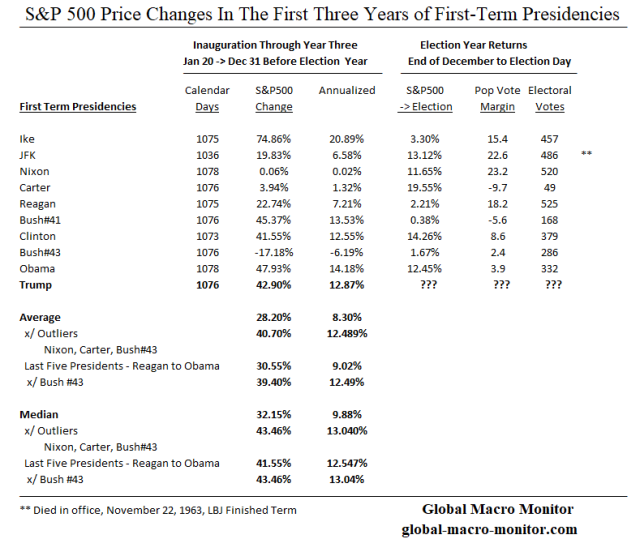
The data in the above table illustrate the change in the S&P during the first three years of a first-term president, from the close on the eve of Inauguration Day to the end-of-December before the election year.  The price change has also been annualized.

We also look at the change in the S&P during the election year, from end-of-December until election day,  the difference in the popular vote and the number of electoral college votes won.    Some nice cocktail hour conversation.

Results – Outliers, Skew, and Distortions

For all first-term presidents since Ike, during their first 1070 plus days in office (Kennedy tragically cut short),  the average change in the S&P500 is 28.20 percent.    Note, however, the median change is 32.15 percent, significantly higher than the mean (average), which reflects a negative skew caused by a few negative outliers.

Given there have only been three presidencies since Teddy Roosevelt, who left office with a stock market lower than the one they inherited — Hoover, Nixon, and Bush#43 — it is also important to take these outlier data points into account, which causes significant distortions in the averages.

Results Excluding Outliers

Excluding the outliers of Nixon, Carter, Bush#43,  the average change in the S&P500 for the six presidencies (excluding Trump) increases to 40.70 percent with a median return of 43.46 percent.  The medium return exceeds Trump’s S&P,  which contradicts the impression given by the CNBC article and the President’s Tweet.

Remember, many people have drowned at Coney Island Beach, which has an average depth of water of only 11 inches.    How can that be?

This leads us to update our parable, The Central Tendency Problem Of A Seattle Dive Bar,

Central Tendency Problem & Stock Market Returns Of Last Five Presidents

Presidents Bush#41, Clinton, and Obama are sitting in a popular dive bar in Seattle after the stock market close on New Year’s Eve.  It’s relatively early and they are the only patrons in Get Shorty’s.

Joe, the bartender, is a student at the University of Washinton studying statistics. The three Presidents are boasting about the stock market returns in their first three years in office.   

President Bush#41 raises a glass to toast his stock market, “the S&P500 index was up 45.37% during my first 1,076 days in office.”

President Clinton brags, “my S&P was 41.55 percent!”

President Obama weighs in, “Gotcha all, the S&P500 was up 47.93 percent during my first three years.”

Joe, the bartender, brings out a Python program and calculates the average and median S&P500 index change of the three Presidents:

Change in S&P500 During First Three Years
 Bush#41,  Clinton, and Obama

Average = 45.95 percent 
Median  = 45.37 percent 

President Trump = 42.90 percent

Suddenly, the door swings open and in walks President Trump, who sits at the bar, orders a Cherry Cola, whips out a copy of the CNBC article citing the data, “The S&P500 during my first three years in office has more than doubled the average market return of other presidents in during the same period.”

Joe’s project starts to get interesting.   He shows President Trump the data that the S&P500 during his first 1076 days, the S&P500 actually underperformed the average of the other recent presidents sitting at the bar by more 200 basis points.

President Trump is shocked and shouts that is “fake news.”   He lashes out, “You all need to read this CNBC article.”  

Twenty minutes later,  President Bush#43 walks in to have a pop (of water) with his fellow presidents. 

Joe can’t believe all of the past five presidents are sitting at his bar.  Now relieved after W. enters,  he recalls #43 inherited a nasty bear market and left office eight years later in a nasty bear market.   Surely,  W.’s stock market return in his first three years will be such an outlier it will bring down the average S&P change for the other three presidents and calm an increasingly irritated President Trump.  

Joe asked President Bush#43 what was the change in the S&P during his first three years. 

W. responds,  “I got screwed and inherited President Clinton’s bursting dot.com bubble and bear market.  My S&P500 was down 17.18 percent. Darn it!”

Joe enters the data into his program and shows the results to President Trump, 

Change in S&P500 During First Three Years
 Bush#41,  Clinton, Bush#43, and Obama

Average = 29.42 percent 
Median  = 43.46 percent 

President Trump = 42.90 percent

President Trump begins to calm down.  He then whips out his cell phone and commences to tweet out the data that the S&P500 in his first three years was 46 percent higher than the average of his four predecessors.   

Upshot? 

Know thy stats, especially as we enter a presidential election year and the decade of, what we believe, will be deepfakes.

Be skeptical and test all things, including our posts, folks.

More Data

Wait there is more.

The following table uses the Dow Jones Industrials to compute the returns during the various administrations going back to Teddy Roosevelt.  The Dow was created in May of 1896 and none of the original stocks are still in the index after GE was given the boot in June 2018.

Predential_S&P_2


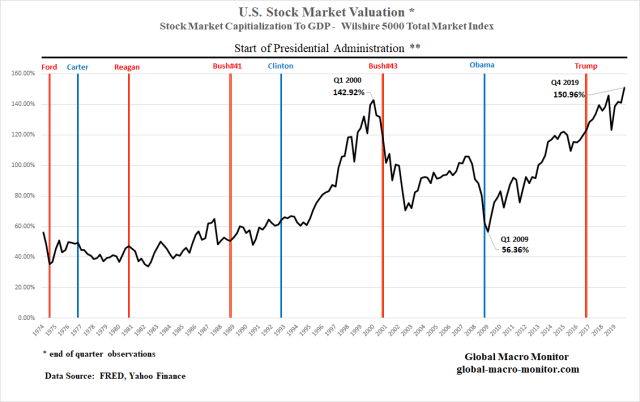
We have also added some context in terms of valuations as illustrated by the last two columns.  It is our favorite stock market valuation metric — the stock market cap to GDP ratio —  using the Wilshire 5000 Total Market index in the numerator.   The Wilshire 5000 index was created in 1974.

What stands out is that both President Trump and President Bush#43  inherited an extremely overvalued stock market, 116 percent of GDP, which is why we are pretty bearish on the eventual terminal point for Mr. Trump’s S&P.  The stock market cap to GDP ended 2019 at 150 percent.  Stunning and can you say, “Yikes!”   See the Market Valuation chart below.

Are Democrats Or Republicans Better For The Stock Market? 

We will let the facts speak as not to be accused of partisanship.  We encourage you to recreate the results for yourself.   We also stress context as presidents cannot control the stock market, well, except maybe the current one, and look at the valuations each president inherited and left to his successor, for example.

Note, the data are price changes and do not include dividends.

Predential_S&P_3

The facts are there have been 12 Republican and 8 Democratic presidents since Teddy Roosevelt assumed office after the assassination of President McKinley.  The Republicans have held office almost 53 percent of the 43k plus calendar days.

Only three presidents have experienced negative stock markets during their entire term, all Republicans  — Hoover, Nixon, and Bush#43.

The average change in the Dow during Democrat administrations is 92 percent,  more than double the average of Republican administrations.

How could that be?  It is so the opposite to the perceived conventional wisdom?  Outliers?

Stay tuned.

Predential_S&P_7


Posted in Equities, Politics, President Trump, Uncategorized | Tagged , , | 3 Comments

If War Comes, It Won’t Be Your Father’s War

Just a heads up and reminder, folks.   Do some homework.

SAN JOSE, Calif. (AP) — Security researcher Brian Wallace was on the trail of hackers who had snatched a California university’s housing files when he stumbled into a larger nightmare: Cyberattackers had opened a pathway into the networks running the United States power grid.

Digital clues pointed to Iranian hackers. And Wallace found that they had already taken passwords, as well as engineering drawings of dozens of power plants, at least one with the title “Mission Critical.” The drawings were so detailed that experts say skilled attackers could have used them, along with other tools and malicious code, to knock out electricity flowing to millions of homes. – Times of Israel,  Dec 2015

You can start by reading Ted Koppel’s book on cyberattacks,

Lights Out


In this New York Times bestselling investigation, Ted Koppel reveals that a major cyberattack on America’s power grid is not only possible but likely, that it would be devastating, and that the United States is shockingly unprepared.

Imagine a blackout lasting not days, but weeks or months. Tens of millions of people over several states are affected. For those without access to a generator, there is no running water, no sewage, no refrigeration or light. Food and medical supplies are dwindling. Devices we rely on have gone dark. Banks no longer function, looting is widespread, and law and order are being tested as never before.   – Amazon

Or watch this:

Posted in Geopolitical, Uncategorized | Tagged , | Leave a comment

U.S. Manufacturing ISM At 10-year Low

ISM

December PMI registered 47.2 percent, a decrease of 0.9 percentage point from the November reading of 48.1 percent, the lowest reading since June 2009’s 46.3 percent. New Orders Index came in at 46.8 percent, a decrease of 0.4 percentage points from the November reading of 47.2 percent. The Production Index was 43.2 percent, down 5.9 percentage points compared to November. The Backlog of Orders Index posted 43.3 percent, up 0.3 percentage points. The Employment Index registered 45.1 percent, a 1.5-percentage point decrease from the November reading of 46.6 percent. The Supplier Deliveries Index was 54.6 percent, up 2.6-percentage points. The Inventories Index was 46.5 percent,  up 1 percentage point.

The Prices Index registered 51.7 percent, a 5-percentage point increase from the November reading of 46.7 percent. New Export Orders posted 47.3 percent, down 0.6-percentage point. The Imports Index came in at 48.8 percent, a 0.5-percentage point increase from the November reading of 48.3 percent.

“Comments from the panel were consistent with November, with sentiment improving compared to the third quarter. December was the fifth consecutive month of PMI® contraction, at a faster rate compared to the prior month. Demand contracted, with the New Orders Index contracting faster, the Customers’ Inventories Index remaining at `too low’ status and the Backlog of Orders Index contracting for the eighth straight month (and at similar rates to November). The New Export Orders Index contracted for the second month in a row, recording 10 months of poor performance and likely contributing to the faster contraction of the New Orders Index. Consumption (measured by the Production and Employment indexes) contracted, due primarily to lack of demand, contributing negatively (a combined 7.4-percentage point decrease) to the PMI® calculation. Inputs — expressed as supplier deliveries, inventories and imports — improved in December, due primarily to slowing contraction in inventories and supplier deliveries remaining in expansion territory. Imports contraction eased slightly. Overall, inputs indicate (1) supply chains began to stress in December and (2) companies remained cautious that materials received would be consumed by the end of the fourth quarter. Prices increased for the first time since May 2019, a positive for 2020.

“Global trade remains the most significant cross-industry issue, but there are signs that several industry sectors will improve as a result of the phase-one trade agreement between the U.S. and China. Among the six big industry sectors, Food, Beverage & Tobacco Products remains the strongest, while Transportation Equipment is the weakest. Overall, sentiment this month is marginally positive regarding near-term growth,” says Fiore.  – ISM

Only Three of 18 Industries Reporting Growth

Three reported growth in December: Food, Beverage & Tobacco Products; Miscellaneous Manufacturing; and Computer & Electronic Products. The 15 industries in contraction reporting are listed in order: Apparel, Leather & Allied Products; Wood Products; Printing & Related Support Activities; Furniture & Related Products; Transportation Equipment; Nonmetallic Mineral Products; Paper Products; Fabricated Metal Products; Petroleum & Coal Products; Electrical Equipment, Appliances & Components; Textile Mills; Primary Metals; Chemical Products; Plastics & Rubber Products; and Machinery.

China Hope

Hope remains high that the Phase 1 trade agreement with China will turn things.   We are not so sure as there was nothing in the deal to really move the economic needle with exception of a toning down of the conflict.


See the full report here. 

ISM_2.png

Source:  ISM

Posted in Uncategorized | Leave a comment