Just an update on our last post, Trouble Coming To Walmart Nation? Warehouse clubs and supercenter retailers continue to shed workers. Along with being Amazoned, the big box retailers are adopting automation at a lightspeed pace and have cut over 42k jobs in the last 12 months.
On Friday, the BLS reported the retail sector lost another 11.4k jobs, the 8th consecutive month of payroll losses. Retail is one of the country’s largest employment sectors, ranking 4th behind education & health, professional & business services, and leisure and hospitality.
Moreover, Walmart is not only the world’s largest private employer but the largest employer in many states throughout the United States.
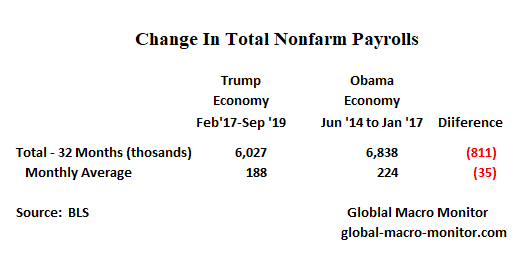
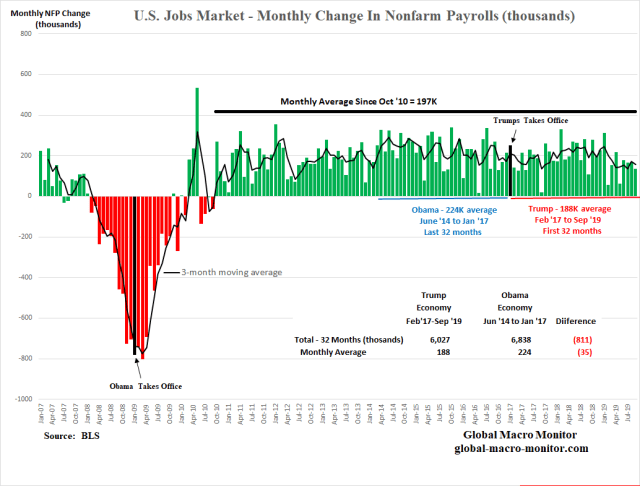
A nice chart for those who live in a fact-based world.
Job creation in the first 32 payroll reports in the Trump administration is significantly lagging the prior 32 months before President Trump took office.
Employment Situation – September
On Friday, the BLS reported a total nonfarm payroll monthly increase of 136k, including 114k private-sector jobs; an unemployment rate falling to 3.5 percent, the lowest rate since December 1969, and average hourly earnings falling by 1 cent.
The BLS notes a big downshift in job creation from last year,
Total nonfarm payroll employment increased by 136,000 in September. Job growth has averaged 161,000 per month thus far in 2019, compared with an average monthly gain of 223,000 in 2018. – BLS
Private Sector NFP Creation Lowest 3-mo MA Since 2012
September’s 114k monthly increase in private sector payrolls was the fifth-lowest of the Trump administration and, more disturbing, the 3-month moving average of private-sector job creation is now at its lowest level since July 2012.
To be fair, robust job creation is a difficult proposition when labor supply is so scarce as measured by a 3.5 percent unemployment (UR), though we believe the UR is a flawed measurement. See here.
The New Political Spectrum
We are starting to wonder if facts matter anymore.
The post-modern nightmare now seems fully realized in today’s culture, where there is no reality only constructions of reality. There is no truth, there are no facts. It’s true only if you believe it’s true.
We reject this nonsense and are becoming convinced the new political spectrum is not about the left and the right anymore but it is bookended by a fact-based reality versus the conspiracy dominant, or, what we call the National Enquirer based.
Many from the traditional left and right live together, though not in agreement, on both extremes of the spectrum. Our preference is for a fact-based lefty or righty over the alternatives any day.
Reality is a much easier reality and a better world when the facts are established and the conclusions are debated rather than arguing over two or many different realities. Unfortunately, we are seeing this now play out in real-time in the U.S,, which is very destructive and, if not checked, will end up in economic disaster.
Lincoln And The Facts
President Lincoln, a great storyteller, had something to say about drawing different conclusions from the same established or, what economists like to call “stylized facts,”
During his days as an Illinois circuit court lawyer, legend has it Lincoln would persuade juries with the use of his funny but truth piercing stories,
The story goes that Lawyer Lincoln was worried he had not convinced the jury during the closing argument of a civil case against a railroad. The jurors had gone to lunch to deliberate. Lincoln followed them and interrupted their dessert with a story about a farmer’s son gripped by panic,
“Pa, Pa, the hired man and sis are in the hay mow and she’s lifting up her skirt and he’s letting down his pants and they’re afixin’ to pee on the hay.” “Son, you got your facts absolutely right, but you’re drawing the wrong conclusion.”
Deepfakes have started to appear everywhere. From viral celebrity face-swaps to impersonations of political leaders – it can be hard to spot the difference between real and fake. Digital impressions are starting to have real financial repercussions. In the U.S., an audio deepfake of a CEO reportedly scammed one company out of $10 million. And with the 2020 election not far off, there is huge potential for weaponizing deepfakes on social media. Now, tech giants like Google, Twitter, Facebook and Microsoft are fighting back. With Facebook spending more than $10 million to fight deepfakes, what’s at stake for businesses, and what’s being done to detect and regulate them?
In addition to Iran, hackers from North Korea and Russia have already started targeting organizations that work closely with 2020 presidential candidates. – NY Times
The road to a credible China trade deal just got a bit narrower and bumpier after President Trump all but recruited China for his 2020 campaign. China may not accept but they do now have a tremendous amount of more leverage. Don’t tell that to Mr. Market, which closed at its high of the day, however.
It is also going to be hard for the body politic to now trust that POTUS is not self dealing in trade negotiations. whether true or not. Perception is everything in politics.
The rabbit hole just gets deeper and darker every day, and the path to extraction goes more foggy on the hour.
“China should start an investigation into the Bidens,” Trump said in remarks to reporters outside the White House. Trump said he hadn’t directly asked Chinese President Xi Jinping to investigate Biden and his son Hunter but it’s “certainly something we could start thinking about.” – AP
We do wonder how long the American public will maintain confidence in POTUS to negotiate for them in good faith, especially now to secure a “good” trade deal for the country? If the Trump team makes concessions to China, it could raise doubts they went easy in order to get some oppo for his campaign, for example. That weakens the American negotiating position and lessens the chance of a deal.
Update 8:04 pm Eastern
This just in,
During a phone call with Xi on June 18, Trump raised Biden’s political prospects as well as those of Sen. Elizabeth Warren, who by then had started rising in the polls, according to two people familiar with the discussion. In that call, Trump also told Xi he would remain quiet on Hong Kong protests as trade talks progressed. – CNN
Elizabeth Warren?
The fact he sold the young people fighting for democracy in Hong Kong down the river is no surprise to us. We posted about this in August. See here.
Biden And The Swamp
We have no doubt the arms of the People’s Liberation Army (PLA) intelligence agency, including the MSS, have the sophistication and technology to cook up, say, a deep fake video of Hunter Biden even bribing Jesus and generating a viral sensation on social media.
Or the Chinese could blackmail the Trump administration with the threat of releasing propaganda, such as a deep fake video of one of the negotiators offering a quid pro quo, say, easing up on Huawei for help with the campaign.
Yes, the whole Biden story of working for a Ukrainian gas company thing is extremely swampy, but not illegal, and will, if not already, hurt Uncle Joe’s campaign.
Ivanka’s China Trademarks
Hunter Biden’s swampiness pales in comparison to that of POTUS and family, however,
Since she has retained her foreign trademarks, the public will continue to have to ask whether President Trump has made foreign policy decisions in the interest of his and his family’s businesses,” CREW said in a post. “Her trademarks remain a potential conflict of interest as she continues to work on policy in the White House and meet with foreign leaders.” – CNBC
We leave you with the following tweet sent out this morning by the Chairman of the U.S. Government’s Federal Election Committee, Ellen Weintraub, just shortly after President Trump recruited China to his campaign.
— Ellen L. Weintraub (@ellenlweintraub on threads) (@EllenLWeintraub) October 3, 2019
For the Fox News viewers, if you’re listening, President Trump is reaching out to China for help on his campaign. That is the Chinese Communist Party (CCP)!
It is hard to comprehend the current state of American politics, especially after what President Trump did today. It appears now even the Drudge Report, which has a tremendous influence on the Alt-Right and led the charge on the Clinton impeachment, is starting to turn on him.
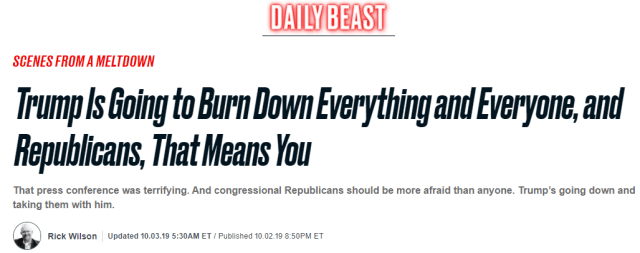
This leads us to ask the question: Does the President of the United States have a Samson Complex and is hellbent on taking down everyone and everything down with him?
…the life story of a psychotherapy patient to that of biblical Samson reveals that both men suffer from a behavioural disturbance, manifested in the compulsion to re-enact the experience of betrayal by women [Nancy Pelosi?], followed by destructive attacks of rage against others, and ultimately against their own tormented selves. — Journal Of Medical Psychology
Rick Wilson, the Republican strategist seems to think so. Similar to the biblical story, where the blinded and shorn Samson says, “Let me die with the Philistines,” and then brings down the temple on himself and everyone else present, Wilson thinks POTUS will do the same, at the very least to the Republicans.
“Trump is a suicide bomber, and you’ve strapped yourselves to him so tightly that when he explodes, you’re going out to meet the 72 porn stars of the Trumpian afterlife with him. (Spoiler alert: They all look like Ivanka.)
“Trump’s manic performance Wednesday was distressing to watch, even for his supporters. Far from being the master of transgressive politics, his anger and frustration are evident and ugly. He’s lost control of the story and of himself.
“Trump can’t keep the process running on his terms and his timetable, and it’s driving him deeper into what I call the Eccentric Dictator Phase of his Presidency.” — Newsweek
In keeping the commitment we made to our readers in the post, America’s Perilous Path Of Wealth Distribution, we follow up with some additional and interesting data on wealth distribution in the United States. If you haven’t read Sunday’s post, run don’t walk to gather some background for the following data. See here.
Here’s the summary section,
Summary
We illustrate the stark contrast in the growth of household wealth between the different percentile groups since Q1 2000
The top 1% of households now hold more wealth than the bottom 90%
The aggregate nominal wealth of the bottom 50% of households has fallen by almost 10 percent since 2000, from 3.4 percent of total household wealth to just 1.3 percent
The share of the top 1% is now over 31 percent and has grown by over 165 percent since Q1 2000
The average wealth per household of the bottom 50% has declined 25 percent in nominal terms and 50 percent in real purchasing power compared to the 1%’s increase of 118 percent and 50 percent, respectively
The widening wealth gap is a major factor in the rise of populism in the U.S. and the debate over a wealth tax will be a central focus of the 2020 presidential election
Asset inflation resulting from quantitative easing (QE) has contributed to the widening wealth gap
The following tables illustrate and present the aggregate wealth data from the Fed’s new Distributional Financial Accounts (DFA). Note we use the terms “wealth” and “net worth” interchangeably.
Wealth Distribution By Percentile
This table was in our original post.
Key Takeaways
Top 1% now hold more wealth than the bottom 90%
Top 10% hold over 70% of U.S. household wealth
Bottom 50% experienced a decline in aggregate wealth
Bottom 50% hold a mere 1.3 percent of household wealth
Wealth Distribution By Growth Rates By Percentile Group
Key Takeaways
Bottom 50% of households experienced an 8.6 percent decline
90-99% percentile group experienced the most rapid growth
Household wealth expanded faster than nominal GDP by a factor of 1.3x
Asset markets experienced two ugly bear markets during the period yet growth aggregate wealth and nominal GDP still diverged, which is not sustainable
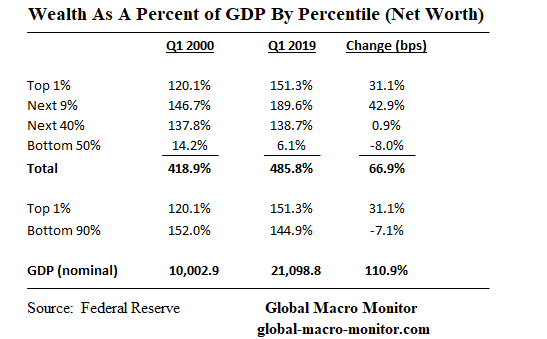
Wealth Distribution As A Percent Of GDP Growth By Percentile Group
Key Takeaways
Household wealth expanded to 486 percent of GDP by Q1 2019, which is historical, if not, the historical high.
Bottom 50% of households saw their wealth fall from 14 percent of GDP to 6.1 percent
50-90% of percentile group household kept just kept pace with GDP growth
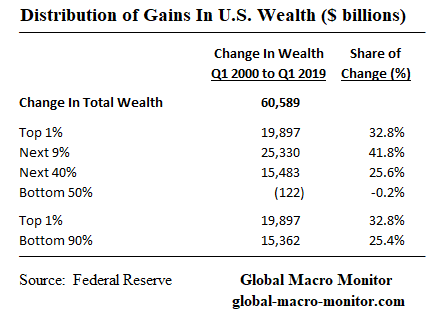
Distribution Of Wealth Gains By Percentile Group
Key Takeaways
Total U.S. household wealth increased by $60.6 trillion from Q1 2000 to Q1 2019
Bottom 50% transferred a small portion of their wealth to the up 50%
10% of households took down almost 75 percent of wealth gains
90-99% percentile group, with wealth per household ranging from $1.5 million to $11 million, took the largest portion of gains, or 41.8 percent of the $60.6 trillion increase in total wealth.
Note the data are not drawn from a panel study, which is a particular design of data where each unit of analysis is followed at specified intervals over a long period. That is many of the households in each percentile moved into other percentiles over the period.
Upshot
Long pitchforks.
Stay tuned for a couple more posts on Wealth Distribution in America.
Running Out Of Free Lunches
We are almost out of free lunches, folks, and will be posting only sporadically unless your support increases. Donate whatever you think is fair by clicking on the PayPal button just below the Twitter and search icons on the upper right-hand side of the blog. You do not need a PayPal account and can use almost any credit card.
Bad news for Trump continues to leak out and staffers and acquaintances are indicted all through the rest of 2017 and 2018. The Democrats take the House and Senate in a landslide in November 2018.
Impeachment charges are brought both against President Trump and Vice President Pence, say, as a co-conspirator on obstruction of justice charges in the firing of James Comey.
It’s 2019 and the Dems control the House and the Senate with comfortable majorities.
The House impeaches the President and Vice President. The Senate convicts both.
Nothing but crickets from Vice President Pence since the news of the Ukraine scandal broke and after what appeared to be President Trump throwing him under the bus.
Nothing to see here. Just Trump trying to get his own vice president, Mike Pence, impeached. pic.twitter.com/qAcs1aAmSa
Trump Leaves Office By Year-End There is only one thing Trump likes more than power – money. As his legal troubles grow exponentially in 2019, the president has an epiphany that he could lose all his wealth. He cuts a Spiro Agnew-like deal and resigns from office in return for leniency. The markets rally into the announcement but Trump doesn’t go easy and dog whistles to his base as he hits the exit. The U.S. experiences a period of political and social instability. Stocks sell-off hard.
Does anyone have a clue how fragile, unstable, and how thin the ice just might be?
Do you think any of this is priced? If feels like things are about to get nonlinear.
We illustrate the stark contrast in the growth of household wealth between the different percentile groups since Q1 2000
The top 1% of households now hold more wealth than the bottom 90%
The aggregate nominal wealth of the bottom 50% of households has fallen by almost 10 percent since 2000, from 3.4 percent of total household wealth to just 1.3 percent
The share of the top 1% is now over 31 percent and has grown by over 165 percent since Q1 2000
The average wealth per household of the bottom 50% has declined 25 percent in nominal terms and 50 percent in real purchasing power compared to the 1%’s increase of 118 percent and 50 percent, respectively
The widening wealth gap is a major factor in the rise of populism in the U.S. and the debate over a wealth tax will be a central focus of the 2020 presidential election
Asset inflation resulting from quantitative easing (QE) has contributed to the widening wealth gap
Long pitchforks and water cannons
Wealth Tax Talk
We hear a lot these days about wealth taxes. A new wealth tax on the upper echelons of the top 1% of wealthiest households will likely be at the center of the 2020 presidential campaign.
This kind of rhetoric and these ideas just don’t happen in a vacuum and are gaining political momentum. Our analysis will illustrate how it is based and moored in the two-decade-long change in the country’s distribution of wealth.
The prediction markets now give Elizabeth Warren a 50 percent probability of winning the Democratic nomination compared to only 21 percent for Joe Biden.
Here is a little snippet of Elizabeth Warren’s plan for a wealth tax from her campaign website.
..an Ultra-Millionaire Tax on America’s 75,000 richest families to produce trillions that can be used to build an economy that works for everyone — elizabethwarren.com
During the next week, we will present a series of posts analyzing wealth distribution in the United States, which seems to have reached a political tipping point. The top 1% of American households now have more wealth than the bottom 90% compared to 79 percent of the bottom 90% in Q1 2000.
In this post, we briefly present some data and charts on the growing wealth inequality between the top 1% and the bottom 50% of U.S. households.
Changes In Wealth For Average Household
Just a few caveats before looking at the following charts.
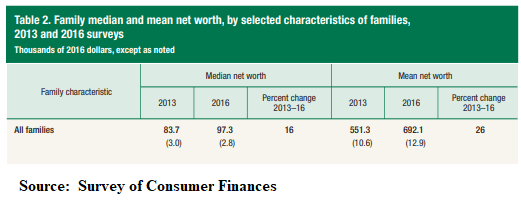
Note the significant differences between the average and median data points, which is the result of the top-heavy distribution of wealth in the U.S. where 70 percent of household wealth is now held by the top 10%, pulling up and distorting the average.
Second, our estimate of the number of households, which we have sourced from the Census Bureau and extrapolated for the current year. There is an ongoing debate about what constitutes a household and a family. Nevertheless, we are very confident our estimates in the following two charts are very good and close approximations of the data that will be eventually published in the next SCF, which should be out in a year or two.
The Raw Data
The following table illustrates the aggregate wealth data from the Fed’s new Distributional Financial Accounts (DFA). Note we use the terms “wealth” and “net worth” interchangeably.
Though the DFA time series begins in 1989, we use Q1 2000 as our base year not only because it represents the beginning of the new Millenium but it was also the quarter of peak aggregate nominal wealth for the bottom 50% of households.
Key Takeaway
The most stunning takeaway, at least for us, from the table is that the nominal aggregate wealth of the bottom 50% has declined, underscore fallen in nominal terms, over the past 19 years. That is almost a 10 percent decline while, at the same time, the wealth of the top 1% has increased by 166 percent. The share of the total household wealth of the bottom 50% has dropped from a mere 3.4 percent in 2000 to 1.3 percent in Q1 2019.
The aggregate wealth of the top 1% relative to the bottom 50% has increased from a factor of 8.5 to 24.6 from Q1 2000 to Q1 2019. Stunning and politically dangerous.
The data are even starker when taking into account that household formation has grown by over 20 percent since the beginning of 2000.
Nominal Average Wealth/Net Worth Per Household
Real Average Wealth/Net Worth Per Household
Go no further to understand America’s rising populism and growing political conflict than the above two charts. It also illustrates the country’s two-speed economy and the sharp contrast of the economic well being of the top percentile groups and the bottom 50% of U.S. households.
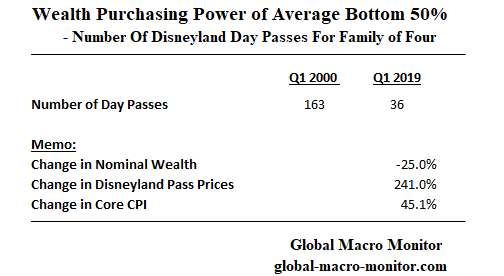
Real-World Example Of Wealth Decimation
It is hard to comprehend the decimation in purchasing power of the wealth of the average household on the other side of middle from 2000 to 2019 but let us help with a simple real-life example.
In 2000, the average wealth per household of the bottom 50%, assuming a family of four, could purchase 163 day passes at Disneyland. In 2019, however, given the decline in nominal wealth and the increase in Disneyland ticket prices, which have outpaced core CPI by more than 5x, fell to just 36 days.
Official Inflation Data Flawed
Just an aside, the relative increase in Disney tickets illustrates why we are so skeptical of and think the official inflation data calculated by the government underestimates real-world price increases, which are what truly matter with respect to a consumer’s real purchasing power.
Yes, we do understand relative price changes and that Samsung large screen televisions are much less expensive than they were in 2000.
Another Data Caveat
One should not make the mistake of viewing the above comparisons as a panel study. That is there is no doubt that some households were in the bottom 50% in 2000 are now in the top 1%, and vice versa.
In addition, the data are averaged with a range from a deeply negative net worth for the lowest percentiles of the bottom 50% to around $100k of the top percentile of the bottom 50%. Ditto for the top 1% where a few of the highest percentile households hold over $100 billion in wealth and the lowest of the top 1%, i.e., the 99th percentile of all U.S. households, is just over $10 million.
Keep that in perspective, folks, during your meditation on the data.
Why The Wealth Divergence?
One, or the major factor of the wealth divergence is that the returns earned on assets such as stocks, bonds, and equity in private businesses have greatly exceeded the growth of wages, which have been nothing short been dismal over the past 20 years. The several rounds of quantitative easing (QE) and the subsequent asset inflation have greatly contributed to the problem, increasing the support for some kind of a People’s QE.
We also illustrated in an earlier post how debt-laden the bottom 50% is relative to other percentile groups.
Upshot
So, there you have it, folks.
It doesn’t take a Ph.D. economist or political scientist to understand what, we believe, is the biggest problem in today’s political economy. Just contemplate and study the few charts and data points above.
It will certainly be one of the main drivers of the 2020 presidential election and the winner will most likely be the candidate who convinces the majority of the electoral college or voters in the swing states, that he/she can best fix the problem or, more darker, is better at exploiting the rage against it. Yikes!
Either way, we suspect the 2020 campaign will be very ugly.
The concept of fairness in the distribution of resources is not just political but the literature increasingly shows is more innate. The perception of fairness also triggers more cooperation and helps an economy and society become more efficient and run more smoothly.
See our June post, The Innate Angst Of Inequality, or take a few minutes to view the video in the Appendix at the bottom of this post.
Can Markets Handle A Hard-Left Turn?
We are not so sure asset markets can handle and sustain a hard-left political turn. We are fairly certain, however, the current trajectory of the distribution of household wealth is not politically sustainable.
We are hoping for new policies that focus more on equitable growth, pulling the lower middle and bottom 50% of households up to close the wealth gap rather a radical redistribution of wealth program. The quickest but ugliest path to close the wealth gap is for both public and private equity markets to take, say, a 50 percent hit, which will end up hurting the most vulnerable.
I recall a conversation with one of my lefty political science professors during the dot.com crash. I asked if he was happy that the wealth gap between the richest man in the world at the time, Bill Gates, and the poorest person (maybe it was me) was cut in half with the crash of the Nasdaq. He responded, “no, let’s not do it that way.” Good for him.
Wealth Tax As An Investment In Social Stability
Nevertheless, some sort of redistribution of wealth from the uber-wealthy is inevitable, in our opinion. After all, the top of the top 1% have taken down an extraordinarily disproportionate share of the increase in total household wealth since 2000. They should view some sort of a wealth tax as an investment in the country’s social infrastructure and political stability in order to protect the totality of their asset holdings.
Whatever the scenario, the markets are vulnerable and to extract ourselves from this mess it is going to take some very effective and competent leadership with lots of nuance and finesse. Apollo 13 like leadership and finesse.
…to return the [Apollo 13] astronauts safely, a new return trajectory had to be calculated and that is where his education in physics, as well as his experience at NASA, came into play. Calculating that return trajectory was like threading a needle from 70 feet away, he said. “We had to be accurate.”
“Apollo 13 was a test of real leadership and how we took a potential tragedy and turned it into a success,” he said. “All of us had a conviction to ride Apollo 13 to the end. We never thought we couldn’t do it.’ — Cherokee Phoenix
Stay tuned for more data posts. Long pitchforks and water cannons, for now.
Running Out Of Free Lunches
We are almost out of free lunches, folks, and will be posting only sporadically unless your support increases. Donate whatever you think is fair by clicking on the PayPal button just below the Twitter and search icons on the upper right-hand side of the blog. You do not need a PayPal account and can use almost any credit card.
There will be some political instability into a second referendum vote as the Brexiteers take to the street. Depending on how things shape up with President Trump’s legal troubles, we may be moving into a transatlantic “summer of discontent,” where the U.K. and U.S. experience a bout of political and social instability. – GMM, March 13, 2019
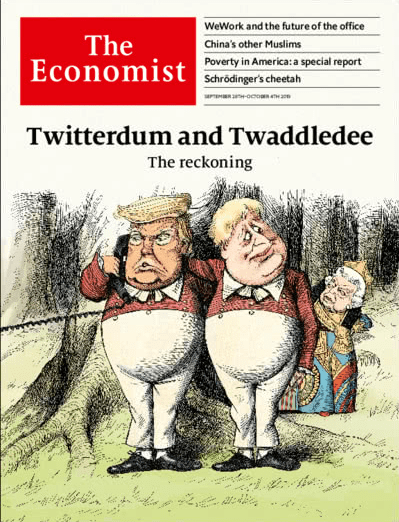
Buckle up for the coming Political Oktoberfest on both sides of the pond. Impeachment for Twitterdum and a vote of no confidence for Twaddledee and an early election on the docket.
The prediction markets now put the probability of impeachment at 70 percent and no BREXIT by November 1 at 78 percent.
Bad Things Happen During Impeachments
Noted in our analysis are the two big “coincidences” of bad things concurrently occurring at tipping points during the two impeachment proceedings. The Russian default on the same day President Clinton confessed to the grand jury and the OPEC oil embargo during the same week of Watergate’s Saturday Night Massacre. Coincidences?
Bad things tend to happen in the world when the U.S. administration is distracted and looks weakened by political scandal. And, believe us, there is a legion of bad things out there just waiting to happen, all of which are stock market negative. — GMM, May 2017
We just found this tidbit of history from Politico of how during the Watergate scandal the Nixon administration was melting down and the President retreated to self-medication,
The Nixon administration began disintegrating—the president unable to play his role as the leader of the nation and the free world—at 7:55 p.m. on October 11, 1973.
The newly appointed secretary of state, Henry Kissinger, picked up his telephone. His trusted aide at the National Security Council, Brent Scowcroft, was on the line from the White House. The Arab-Israeli war of 1973 was in its fifth day, escalating toward a global crisis and a potential nuclear conflict.
SCOWCROFT: The switchboard just got a call from 10 Downing Street to inquire whether the president would be available for a call within 30 minutes from the prime minister. The subject would be the Middle East.
KISSINGER: Can we tell them no? When I talked to the president he was loaded.
President Richard Nixon—ravaged by more than four years of war in Vietnam, 15 months of Watergate investigations and countless nights of intense insomnia—was incapacitated. – Politico
Wow! POTUS was hammered as the world spiraled toward nuclear conflict and incapable of taking “the call.”
This further confirms our suspicions that domestic political scandals, such as Watergate, distorts and weakens the global perception — and maybe not just perception — of U.S. leadership in the world. And contributed, at least, partially, to the 1973 Yom Kippur War and subsequent economic crisis caused by the related OPEC embargo.
It was only nine days later after the above account by Politico the Saturday Night Massacre took place.
If past is prologue, as Trumpgate thickens we suspect the world may become more unstable.
…Thank goodness President Trump doesn’t drink, but he does seem to find release — i.e., self-medicate — through his Twitter account. And recent history shows that one “bad” tweet can do more damage and be more self-destructive to a Presidency than, say, five martinis. Gulp! — GMM, May 2017
The White House is weighing some curbs on U.S. investments in China, a source familiar with the matter told CNBC. This discussion includes possibly blocking all U.S. financial investments in Chinese companies, the source said.
It’s in the preliminary stages and nothing has been decided, the source said. There’s also no time frame for their implementation, the source added. – CNBC
We don’t think the U.S. is in a strong position to start a war on capital flows given its very weak net international investment position (NIIP), which now exceeds a negative $10 trillion dollars. Capital inflows help keep U.S. asset markets afloat and finance budget deficits.
Net International Investment Poistion
The difference between a country’s external financial assets and liabilities is its net international investment position (NIIP). A country’s external debt includes both its government debt and private debt, and similarly its public and privately held (by its legal residents) external assets are also taken into account when calculating its NIIP. Note that commodities, as well as currencies tend to follow cyclical patterns, whereby they undergo significant valuation changes, of which is reflected in NIIP.
A country’s international investment position (IIP) is a financial statement setting out the value and composition of that country’s external financial assets and liabilities. A positive NIIP value indicates a nation is a creditor nation, while a negative value indicates it is a debtor nation. – Wikipedia
Slouching Toward Socialism
The trade war, the political manipulation of imports and exports, and the threat of managing capital flows are just too much of a slouch toward socialism, in our book.
Do you think the SEC has the same concern of protecting the public from overhyped and overvalued IPOs that owners dump on the public? Think loss-making Uber, which is down 30 percent since its IPO and WeWork, almost. Just askin’.
Running Out Of Free Lunches
We are almost out of free lunches, folks, and will be posting only sporadically unless your support increases. Donate whatever you think is fair by clicking on the PayPal button just below the Twitter and search icons on the upper right-hand side of the blog. You do not need a PayPal account and can use almost any credit card.