The Power & Paranoia Of Redaction

Grab your popcorn and strap yourself in, folks,  for the coming political donnybrook over the full release of an unredacted version of the Mueller Report.   Me thinks it will be kicked up to the Supremes to decide.

Apr1_PowerOfRedaction

The above is exactly why we vote for full transparency with the exception of possibly some minor, but necessary, redactions to protect Agent Smith.


Posted in Uncategorized | Tagged , | 3 Comments

Beware Of Retrofitting Fundamentals To Price Action

See our post, Newton’s Q1 Law Of Motion For The S&P,  by clicking here

S&P_Newton


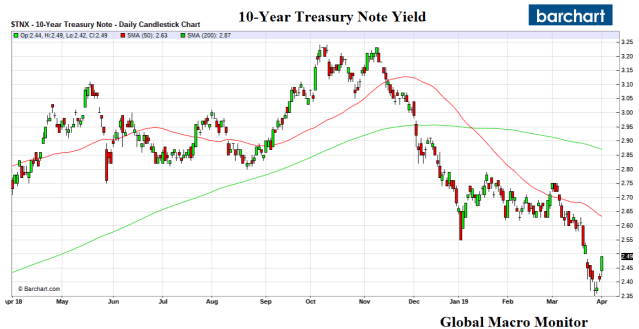
The past few weeks were a classic exercise in how markets tend to “retrofit” price action to their expectations of economic fundamentals and illustrates the risk of a self-fulfilling feedback loop.  The 10-year bond yield fell more than 40 basis points from March 1 to March 27 and the 10-year less 3-month yield curve temporarily inverted, leading even the President’s top economic advisor and his nominee to the Federal Reserve to call for an emergency 50 bps interest rate cut by nation’s central bank.

Apr1_10_year_Chart


Day trading the market and economic noise to set longer-term economic policy can be dangerous thang.  That’s Chauncey Gardener-esque, folks, and puts the credibility of U.S. policymaking into question.

Why Did Rates Collapse In March? 

Nobody really knows for certain but we suspect it was the collapse in the 10-year German bund yield, which crossed over into negative territory once again, falling from 18 bps on March 1 to -8 bps on March 27th.  The German manufacturing sector is now in a “deep recession” and the shortage of German bunds due to ECB asset purchases has distorted the economic signal of interest rates.

Apr1_German_BundInterest rates in the U.S. are affected and somewhat anchored by the German bund yield.

Nevertheless, we were a bit perplexed by the sharp move down in U.S. yields as we didn’t see the U.S. economy collapsing.  Au contraire,

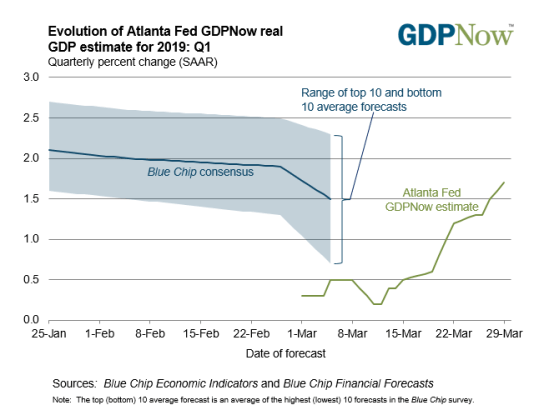
Note the Atlanta’s Fed GDP now forecast for Q1 2019 has moved up from around 0.5 percent at the beginning of the month to around 1.2 percent, which is a big move lost on the markets.  – GMM, March 22

Markets are way over their skis on the deflation and growth scare.

The Atlanta Fed’s GDP Now Q1 forecast has skyrocketed over the past few weeks, up from 0.3 percent to 1.7 percent.   There is no deflation and it’s entirely possible the Cleveland Fed Median CPI prints 3 percent y/y in March with energy prices now skyrocketing.   The daytraders in and out of the administration calling for a 50 bps rate cut are panicked and clueless unless they see something nobody else does.   Could they be signaling the China trade deal is in trouble?  Just askin’. – GMM, March 31


Apr1_GDP_Now

The GDP now Q1 forecast is currently at 2.1 percent.

Moreover, the talk of deflation is just nonsense.

…the Fed began sucking dollars out of the economy. This combination of a reduced supply and heightened demand for dollars produced an entirely unnecessary deflation. – Stephen Moore,  Wall Street Journal, March 13th

Actually, that sucking sound is not the Fed reducing bank reserves but it’s the U.S. Treasury increasing the size of its monthly note and bond auctions in order to maintain its balances (checking account) at the Fed as the central bank shrinks its balance sheet.  That is coming to end in September, however.

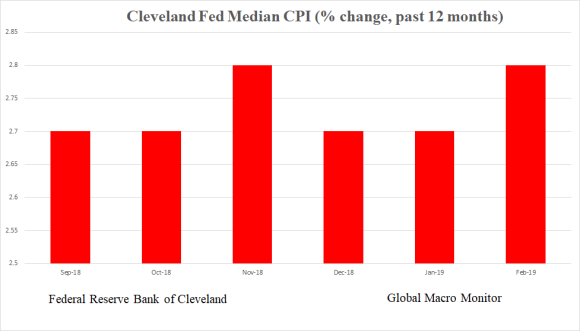
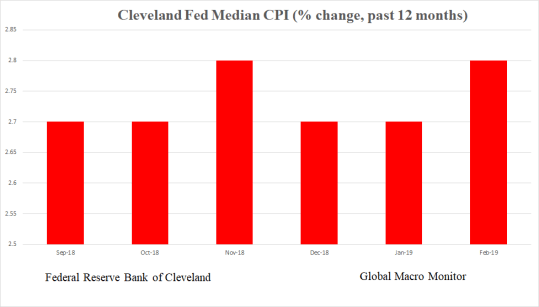
Take a look at the Cleveland Fed’s Median CPI running at an annual rate of 2.7 percent, which may approach or breach 3 percent for March with the rise in energy prices.

Median_CPI

What Now? 

If you have been reading GMM,  you know our thoughts on equities.  The sheer momentum of such a strong first quarter carries over into the rest of the year, which is the justification of our year-end S&P target of 3025.

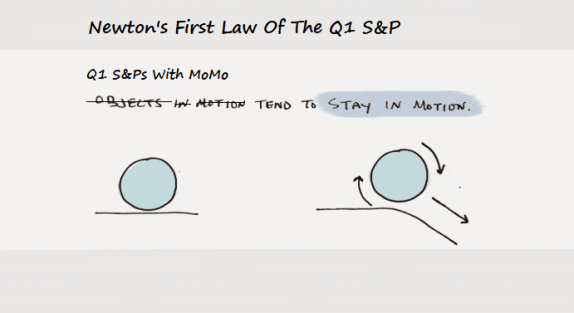
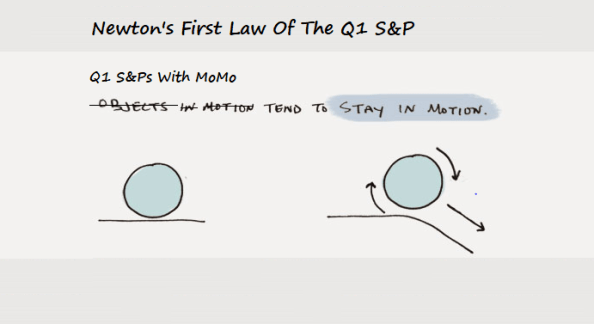
There has not been one year since 1950, not one, where the S&P has increased by more than 10 percent in Q1, after experiencing a negative prior year, which didn’t close the year up less than 20 percent.  It’s Newton’s Q1 Law of S&P Momentum.   Is this time different?

We don’t think the move will be sustainable, however, and are selling the strength in the final three quarters, which we suspect the bulk of the final move will take place in Q4.

Bonds

Bond yields are more interesting.

Clearly for yields to take off and move much higher,   Euro yields will need to get off the mat.  The German manufacturing sector may emerge and show some improvement if China has truly bottomed.  We also expect pressure to build on German policymakers to introduce a significant fiscal stimulus.

We are now watching the key levels of 2.57, 2.63 (50-day), and 2.70 percent as the next hurdles for the 10-year to heal thyself.  Stay tuned.


Apr1_10_year_Key Levels


Apr1_10_year_Chart2


Posted in Bonds, Charts, Uncategorized | Tagged , | 2 Comments

Newton’s Q1 Law Of Motion For The S&P500

Newton’s three laws of motion may be stated as follows:

  1. Every object in a state of uniform motion will remain in that state of motion unless an external force acts on it.
  2. Force equals mass times acceleration.
  3. For every action, there is an equal and opposite reaction.

The first law, also called the law of inertiawas pioneered by Galileo. This was quite a conceptual leap because it was not possible in Galileo’s time to observe a moving object without at least some frictional forces dragging against the motion. In fact, for over a thousand years before Galileo, educated individuals believed Aristotle’s formulation that, wherever there is motion, there is an external force producing that motion.  – Stanford University

S&P_Newton


Quite A Quarter!

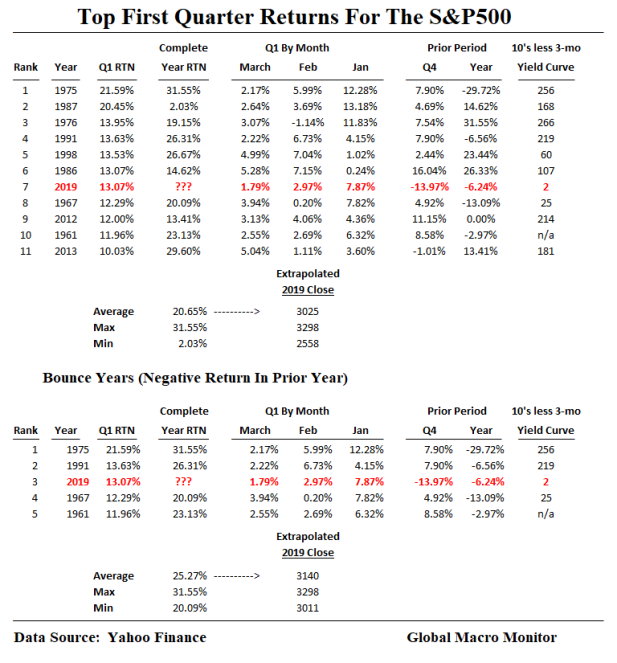
The S&P500 was up 13.07 percent in the first quarter,  the best since 1998 and the seventh best first quarter since 1950.   Of all 276 quarters since 1950, Q1 2019 ranked 17th, in the 94 percentile and the best since Q3 2009.  The index experienced a huge trampoline effect, bouncing off and reversing the 13.97 decline in Q4 2018, which ranked as the 10th worst performing quarter since 1950 placing it in the 3.6 percentile of S&P quarterly moves.

A Q1 S&P With Momentum Tends To Gain Momentum

Of the 10 first quarters where the S&P has increased over 10 percent, only one, 1987, has finished lower for the year.  The data below also illustrate that the annual change for the S&P when the index was up more than 10 percent in Q1, averages 20.65 percent.

Using that average and extrapolating from Friday’s close would put the year-end S&P500 at 3025, or about 2.85 percent above the all-time high of 2940.91.  We will use that as our target, which doesn’t violate our longer-term bearish view.  Bear markets tend to climb back after a sharp sell-off to make a new nominal high before rolling over hard.  This was certainly the case in 2007.

The underlying fundamentals just are there to have confidence the coming move as a sustainable one.  The market certainly is not cheap.

In addition to our concerns about valuation, we don’t like the high levels of public and corporate debt, the changing structure of the U.S. Treasury market, the increasing market manipulation by governments (i.e., market socialism), the shifting geopolitical tectonic plates, including the recession of American global leadership and the end of Pax Americana,  local domestic politics, and geopolitics, in general.  We could go on.

Power Of Zero

We believe the Power of Zerothat is zero to negative bond yields, or the fear of, will be the main driver of equity markets until year-end.  Walter Bagehot liked to quote the famous market aphorism as a powerful motivation for savers to chase risk,

JOHN BULL can stand many things but he cannot stand two per cent – Economist

Not without volatility, however.

Strap yourself in, it’s going to be an interesting rest of the year.

Traders and bears are going to be forced into this market.    Stay tuned.


S&P_Q1


S&P_Quarters


Posted in Equities, Equity, Uncategorized | Tagged , | 2 Comments

Stare At The Clouds Long Enough And… Yikes!

As the saying goes, “if you stare at the charts long enough, you can see any pattern you what to see.”

We weren’t even staring but spotted this cloud pattern last week.

It looks similar to only a pooh bear, however.  So is it an omen of only a 30 percent bear market to come?


Ursa

Posted in Technical Analysis, Uncategorized | Tagged | 1 Comment

Quarter In Review – March 28

Summary

  • Big bounce in all assets after the Q4/December downdraft
  • Global bond yields way down on global deflation panic as $11 trillion in global bonds now have negative yields
  • The Power of Zero (yields) has driven stocks up with China leading the way
  • Dollar stronger, closing quarter close to the top of its recent range
  • Argentina peso hammered in Q1
  • Cable stronger in spite of Brexit chaos
  • China and Russian currencies stronger
  • All major stock markets up for the quarter with Nasdaq leading U.S. indices
  • Semis and Homebuilders up 20 percent
  • Crude oil up over 30 percent
  • CRB up 8 percent.  Where is the deflation?

Commentary: The stock market usually bounces after a down year as back-to-back down years are very rare.  The Dow’s probability of an up 2019 is close to 90 percent.

Markets are way over their skis on the deflation and growth scare.

The Atlanta Fed’s GDP Now Q1 forecast has skyrocketed over the past few weeks, up from 0.3 percent to 1.7 percent.   There is no deflation and it’s entirely possible the Cleveland Fed Median CPI prints 3 percent y/y in March with energy prices now skyrocketing.   The daytraders in and out of the administration calling for a 50 bps rate cut are panicked and clueless unless they see something nobody else does.   Could they be signaling the China trade deal is in trouble?  Just askin’.

Moreover, if Trump closes border with Mexico bad economic news to come.

If the bottom is in with the China growth scare, bonds are in for a big pasting in the next quarter.   An uptick in China will also help sentiment in Germany and Europe.

We expect the Q1 momo to continue in stocks, with the S&P making a nominal new high by year-end at around 3025, 2.85 percent above the all-time high, before the continuation of the bear market,  which began in Jan 2018, and the next Big Dipper hits.  This is based on a simple extrapolation of the momentum that takes place after such a strong first quarter after a down year.

The S&P500 finished March close enough for government work to our February 4th expectation, so we are taking a victory lap.

If history is any guide, given the historical start to the year, the S&P should finish March at or around 2850-ish. – GMM,  Feb 4th

Happy hunting next week and the quarter, folks!


GDP_Now


Median_CPI


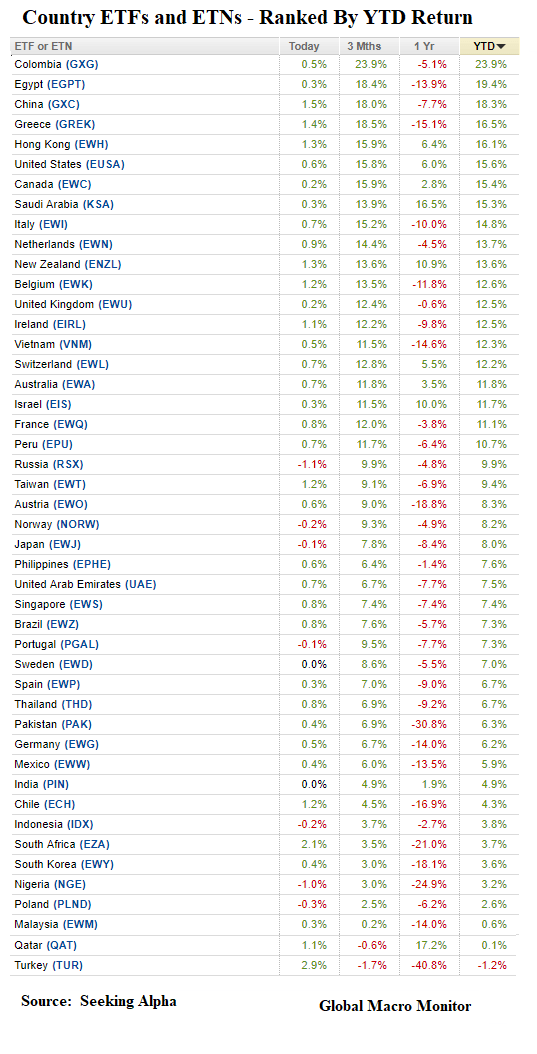
Week_2019_ETFs


Week_Table

Posted in Uncategorized, Week in Review | Tagged , , , | 2 Comments

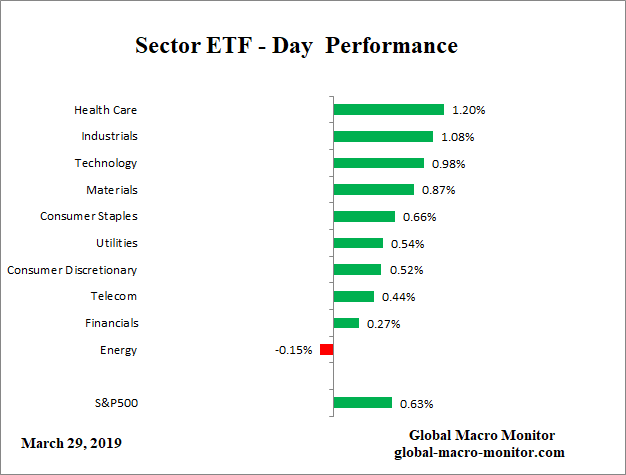
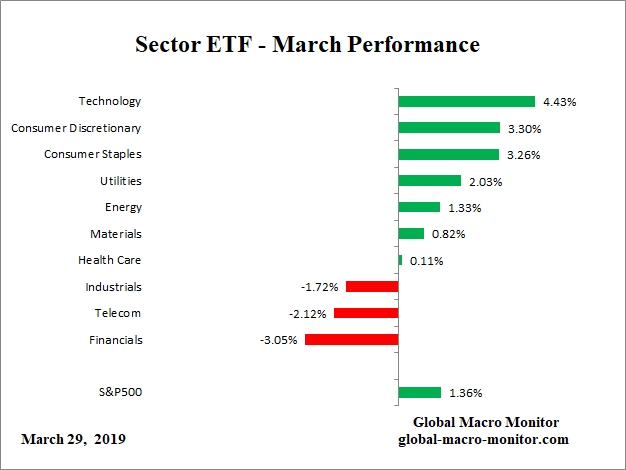
Sector ETF Performance – March 29

We will be phasing out free rider access to the Sector ETF Performance during our website overhaul to take place over the next month.  Contribute by clicking on donate widget on the right-hand side of the website. 

ETF_Day

ETF_Week

ETF_Month

ETF_YTD


Posted in Sector ETF Peformance, Uncategorized | Tagged , | Leave a comment

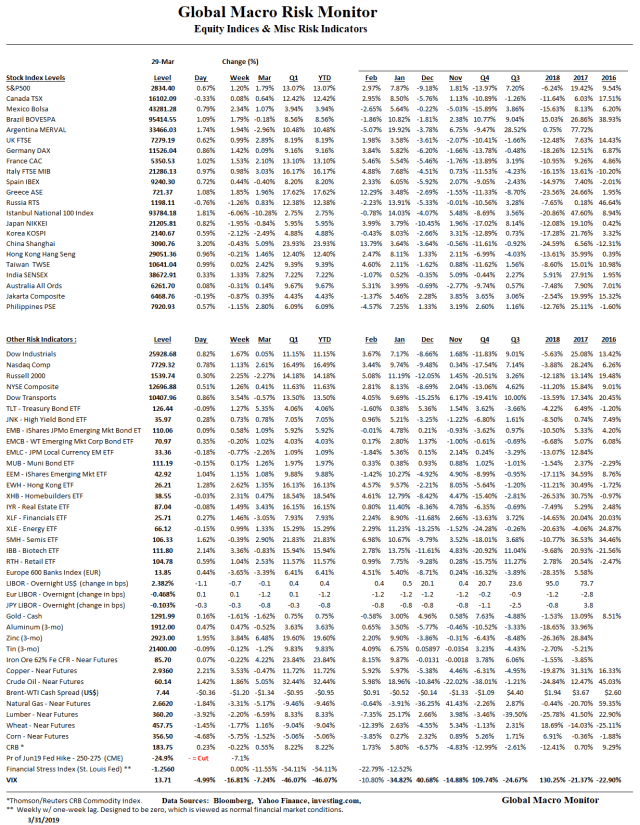
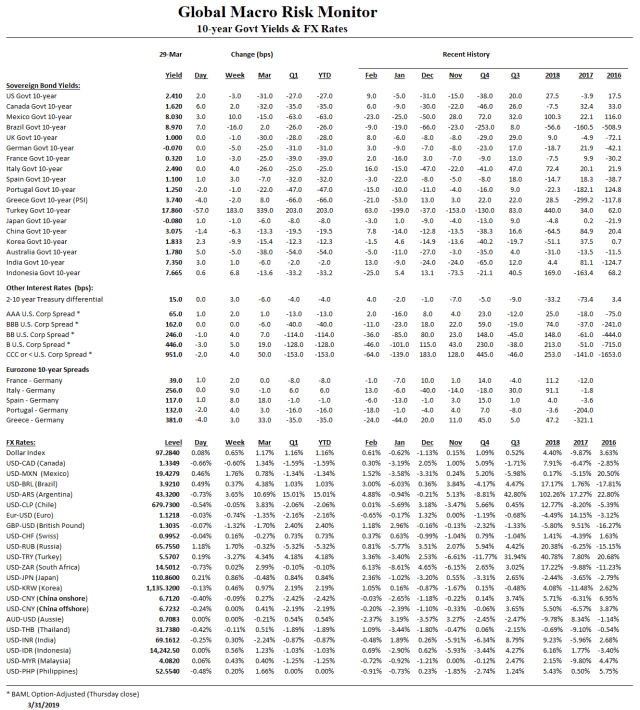
Global Risk Monitor – March 29

We will be phasing out free rider access to the Global Risk Monitor during our website overhaul scheduled to take place over the next month. Contribute by clicking on donate widget on the right-hand side of the website.   

RM_1

RM_2

Posted in Daily Risk Monitor, Uncategorized | Tagged , , , , , | Leave a comment

BFTP: On Brexit

BFTP = Blast From The Past

BREXIT ain’ gonna happen.  The political extremes on both ends have “woke” the sleepy and complacent middle, women, and the young – GMM, October 19, 2019

The March 29th exit date has come and gone.  A second referendum is the only alternative and inevitable, in our opinion.  The Brexiteers are already in the streets as we expected. Buying cable on panic and the political instability for the long march to a mid-to-high 1.40 handle.


Posted in Brexit, Uncategorized | Tagged , | Leave a comment

IMF Analysis Of Nafta 2.0 = Potemkin Trade Deal

Summary

  • IMF published a working paper on NAFTA 2.0 or the USMCA on March 26th
  • The trade deal still needs Congressional approval
  • The impact on GDP is negligible and the effects are relatively small at the aggregate level
  • Trade is reduced between all three nations with trade deficits in the U.S. and Canda rising slightly
  • Real wages in Mexico decline slightly and are unaffected in Canada and the U.S.
  • Automobile and parts production will be incentivized to move out of North America
  • Consumers will pay higher vehicle prices and resulting in lower demand and production
  • In other words, the deal sucks and is, at best, Potemkin, which confirmed our suspicions when it was announced.

The IMF goes deep on NAFTA 2.0 and confirms our initial conclusions from October,

More Potemkin than real beef.  Or, as they say in Texas, “big hat, no cattle.”

At first glance, with our limited information,  our conclusions are the negotiations were a huge waste of time, energy, and diplomatic capital resulting in a nugacity of a new agreement.   High drama all for naught, in our opinion.  – GMM, October 1st

IMF Conclusions

IMF economists’ main conclusions on Nafta 2.0 (see the full report here ):

  1. At the aggregate level, effects of the agreement  are relatively small
  2. Reduces trade among the three North American partners by more than US$4 billion (0.4 percent) while offering members a combined welfare gain of US$538 million
  3. Trade deficits will widen slightly in Canada ($36 million) and the United States ($275 million) but that of Mexico improves modestly
  4. Effects on real GDP are negligible
  5. Most of the benefits will come from trade facilitation measures that modernize and integrate customs procedures to further reduce trade costs and border inefficiencies
  6. Changes in trade flows will lead to structural changes in the composition of production across North America
  7. Some sectors benefit from greater trade integration while others
    experience declines in output and job losses
  8. Changes in industrial structure that result from changing trade flows prompt employees to move from contracting to expanding sectors
  9. Real wages for skilled and unskilled workers in Mexico decline slightly but wages are unaffected in Canada and the United States
  10. Tighter rules of origin in the auto sector and the labor value content
    requirement will not achieve their desired outcomes and lead to a decline in the production of vehicles and parts in all three North-American countries, with shifts toward greater sourcing of both vehicles and parts from outside of the region
  11. Consumers will face higher vehicle prices and respond with lower demanded quantities

 True to form for the Art of the Deal – little gain, lots of pain. 

Potemkin Mexico Canada Deal


Posted in Mexico, Trade War, Uncategorized | Tagged , , | 10 Comments

Permabulls For The Long Run


Dow_Box_Digits

I once heard the late, great financial economist Stephen Ross speak at a Lehman Brothers bond conference in Sun Valley, Idaho.  He opened his presentation with a short story about how investors would approach him and ask, “if you’re so smart, why aren’t you rich?”  He said his reply was always, “if you’re so rich, why aren’t you smart?”  Touché!

The same Socratic logic can be applied to the permabulls, who have the probabilities on their side.  The U.S. stock market likes to go up.

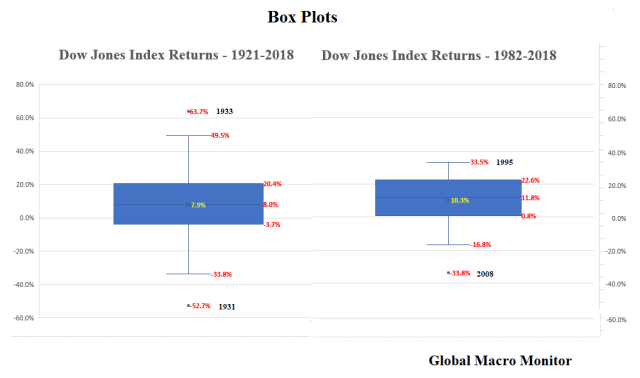
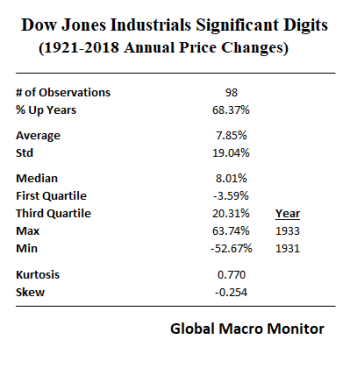
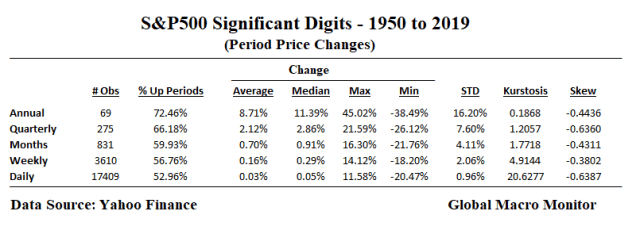
For example, the Dow has generated positive returns 68 percent of the years since 1921, and the S&P more than 72 percent since 1951.

Moreover, it doesn’t take much intellectual gravitas to proclaim stocks are in a “structural bull market.”  Take a look at any long-term chart, as in more than 40 years, to see that any major stock index has moved from the lower left to upper right.  The stock market, by definition, is a perpetual structural bull market.  Innovation, growth and inflation have always, over the long-term, trumped fear.

Who in their right mind would consistently bet against a permabull, even if their message never changes — “the stock market will be up this year”  — if the empirical probability of being correct is 70 percent?  Someone headed for bankruptcy, that’s who.  Permabulls for the long run!

Shorter Time Horizons

The above argument weakens significantly in shorter timeframes as the binary stock market return converges toward a random bet on a daily basis.  The S&P Significant Digits table below illustrates this as the index generates positive daily returns only 53 percent of the time, 57 percent weekly, 60 percent monthly, and 66 percent on a quarterly basis.
S&P_Significant Digits

The data also show return distributions have more of a negative skew and a higher kurtosis — fatter or longer tails — the shorter the timeframe.   That is one major factor why short-term traders have a higher risk of ruin than long-term investors.

Stock Market Annual Streaks

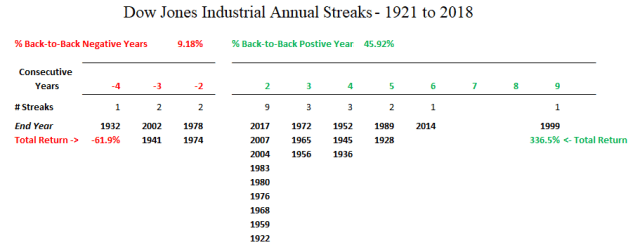
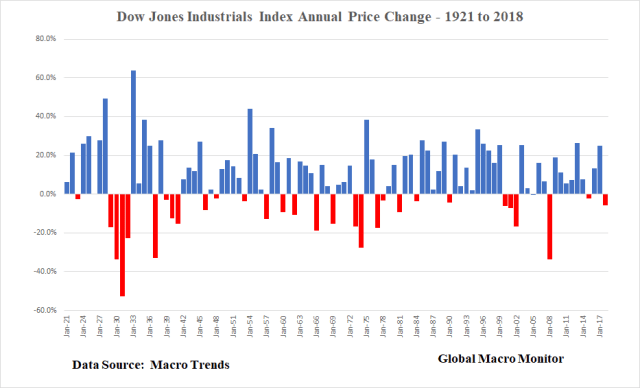
We were extremely surprised by the results of how rare back-to-back down years is for the Dow Jones Industrials.  Only nine times since 1921 has the Dow had a down year after suffering a negative return the prior year, which includes two 3-year and one 4-year steak.  The worst of which was the four consecutive down years at the start of the Depression, where the Hoover administration experienced a negative stock market every year in office, as the Dow lost 62 percent of its value.

Keeping with our theme,  “the stock market likes socialism,”  or government (or the Fed) bailout/interventions,  the best year in the Dow was in 1933 after FDR took power and began to implement the New Deal.   The 36 percent 3-year moving average of annual returns in 1936 topped the second highest level of 1997 by almost 1000 bps. 

Of the 98 years of Dow returns we looked at since 1921, 46 percent generated back-to-back positive years, with the longest streak, the 9-year bull market ending in 1999,  which lifted the Dow by 337 percent.  The streak ended with the bursting of the dot.com bubble in Q1 2000, which then resulted in three straight down years in the Dow.   

Thus, given the above data, after a down year,  such as 2018, there is about a 90 percent empirical probability the Dow will generate a positive return in the next year, which implies annual returns are not independent.  Rather stunning odds, nonetheless. 
 

Dow_Box_Streaks


Upshot

So what about 2019?

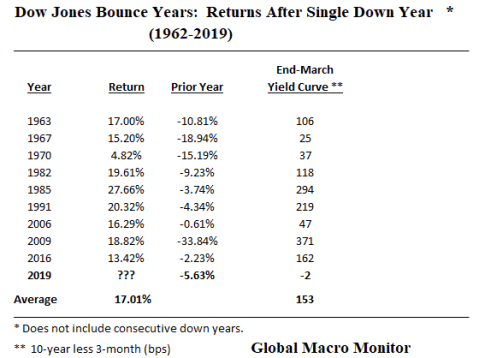
We don’t know and can’t say with any certainty, but given how rare it is for back-to-back down years,  the higher probability bet would be for a Dow higher than where it started the year.   Moreover,  the average return for bounce years suggests the Dow, up 9.4 percent year-to-date, has around another 10 percent to go.

The big caveat, and the uncharted water Mr. Market currently finds itself is the shape of the yield curve.  Though there are four trading days left in the month, 2019 could be the first bounce year since 1960 (our start year) where the yield curve is negative at the end of March.
Dow_Box_Dow Bounce


Conclusion

Considering and internalizing the above data, it would then behoove investors to always keep timeframes long-term.  The financial media, including this blog, is rendered mostly noise and, at best, entertainment for long-term investors.

There are a few times in history, however, – we count five – where reducing risk was a smart move, which allowed investors to reinvest at a significantly lower price without the risk of being left behind in a V bottom bounce.  Those times to sell were in the 1910s, 1929, late 1960s, Q1 2000, and 2007, most of which were known at the time to be a period of historically high and extended valuations but justified by the mass and social media as a “this time is different” situation.

We are not even sure most even see what we perceive or they choose to ignore it, surrendering to the all the rage passive investing, which, ironically, is based on the very analysis in this post.

Given the current combination of historically high market valuations, the high levels of sovereign and corporate debt, record-high budget deficits, the shifting geopolitical tectonic plates, the end of the post-War era and Pax Americana,  and the extreme wealth and income disparities,  we sense today is one of those times.  That is why we are and will continue to take money off the table in this rally, which we suspect will be the blow off before another historic Big Dipper,  that is a 40 plus percent bear market.

The global monetary authorities will then likely kick into full monetization mode with new regimes, such as a “People’s QE”, which directly finance consumption and other schemes to finance infrastructure investment, for example.   Our brothers and sisters in the MMT crowd will finally have their day and the people will suffer the consequential inflation and stagflation as confidence in the currency plummets, and money demand collapses.   This may take some time to play out but we are fairly confident, play out it will.

The deflatiionistas will, for sure, win the next few battles but, we are almost certain, will lose the war.

We are also cognizant our scenario contradicts the historical data and, as always, we reserve the right to be wrong.  Like us,  investors should always have a Plan B, whatever their strategy,  in the event they are wrong.

Stay tuned.
Dow_Box_Times Series


Dow_Box_Plots

Dow_Box_Definitiions


Posted in Equities, Uncategorized | Tagged , | 15 Comments