Third Quarter Review – September 29

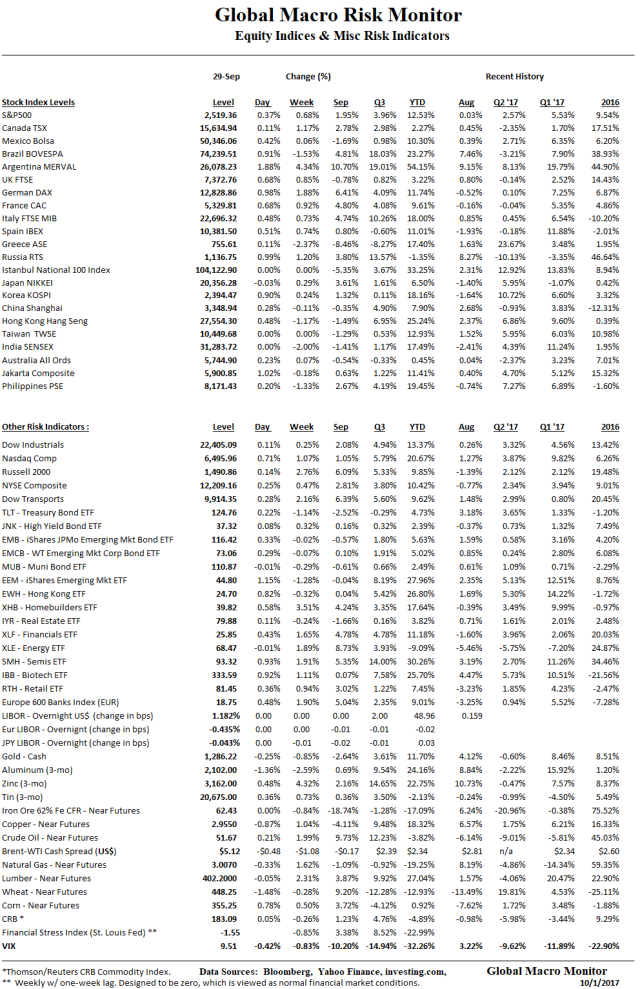
Global Stock Indices

Global stock markets performed well in the Q3, especially the emerging markets.  Capital is flying into the sector.  Argentina looked unstoppable up almost 20 percent in the quarter with another 4 percent increase last week, and now up over 50 percent on the year.   Guess this is the time to start selling at least for trade to reload lower.

Greece down on profit taking and IMF noise.


Quarterly_Stocks

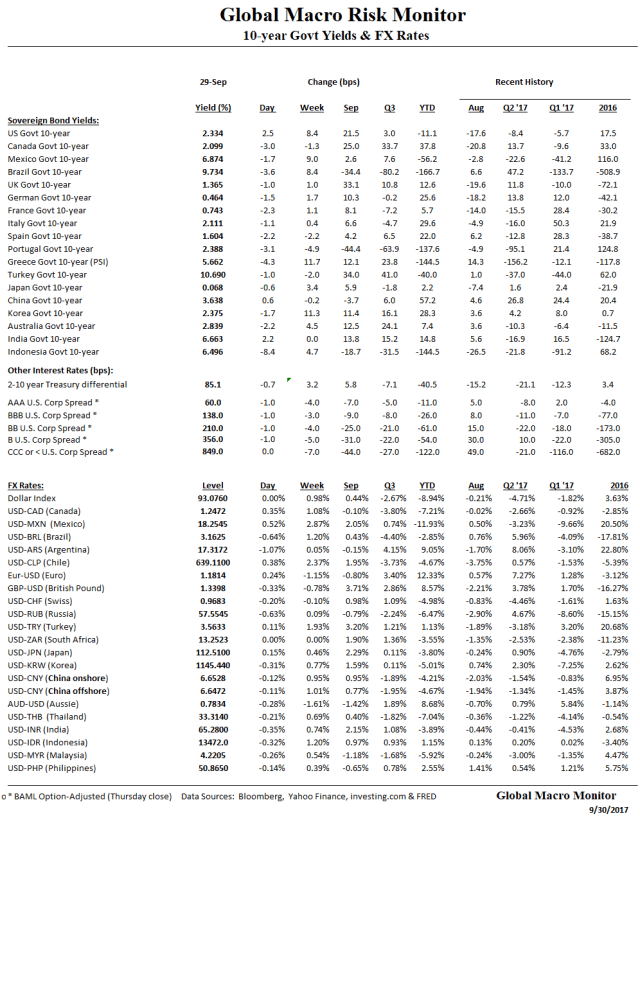
Global 10-year Bond Yields

Yield chasers continued to commit capital to the high-yielding emerging markets such as Brazil and Indonesia.  Portugal came in big on recapturing of its investment grade rating.

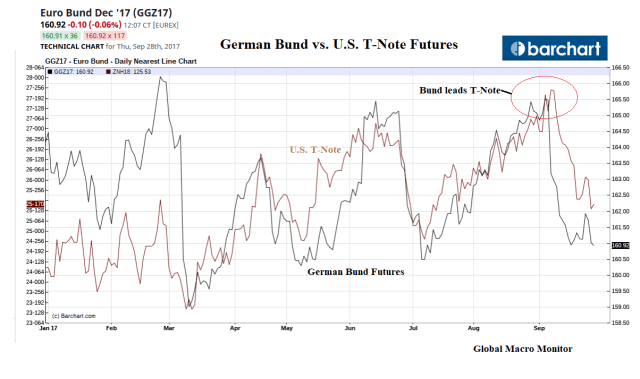
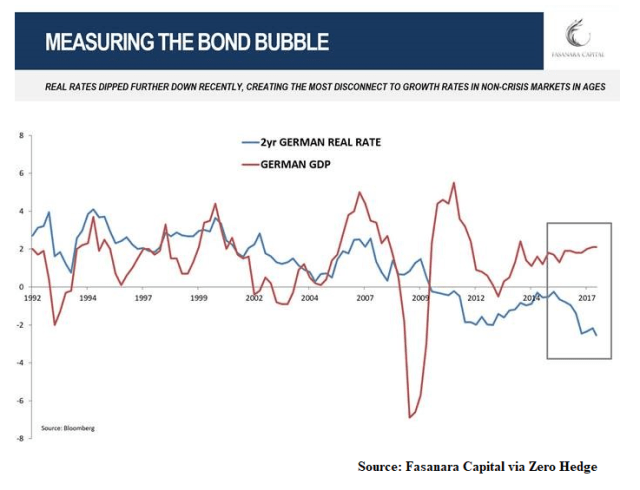
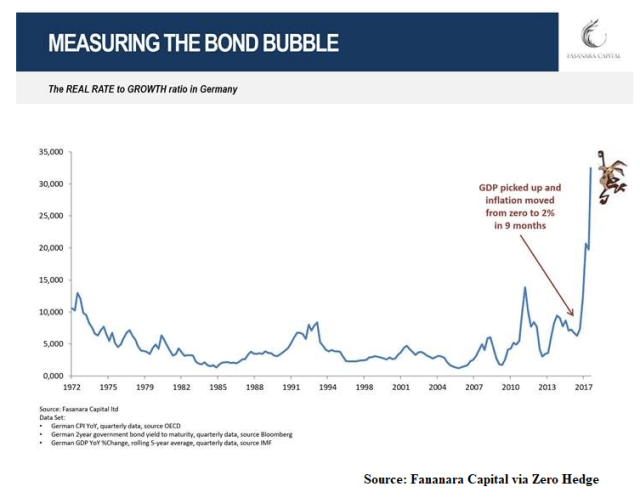
Global bond yields on the rise in the past few weeks.  We are expecting a taper tantrum in Europe and a significant rise in European yields this month.   That trade is dependent on how the situation in Spain unfolds.
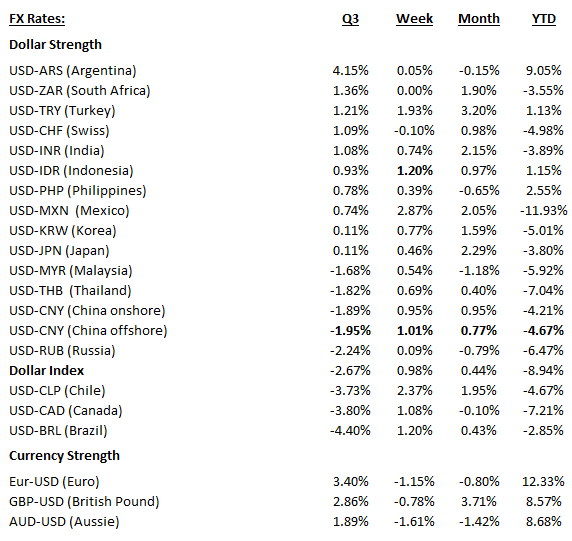
Quarterly_Bonds

Global Currencies

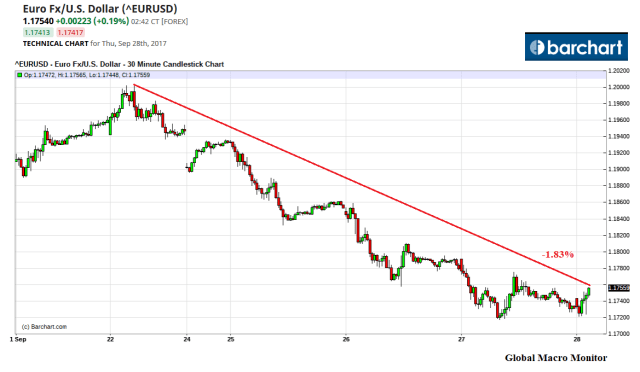
The Argentina peso was the weakest currency for the quarter and, in part, explains the country’s big equity gains.  China showed strength but was weaker for the month of September.  The dollar index was down almost 3 percent but looks like it has put in a bottom and has been stronger the past few weeks.   Catalonia should give the dollar a further boost.
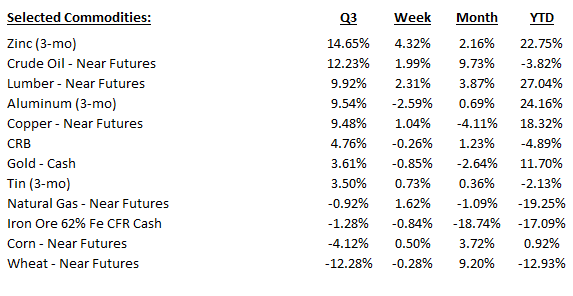
Quarterly_Currencies

Select Commodities

Zinc up big in Q3 and after a few weeks of selling ended the month strong. Crude trading better based on the perception than demand is growing and the OPEC and U.S shale obsession seems to have waned for the moment. Grains continue to trade poorly.

Quarterly_Commodities

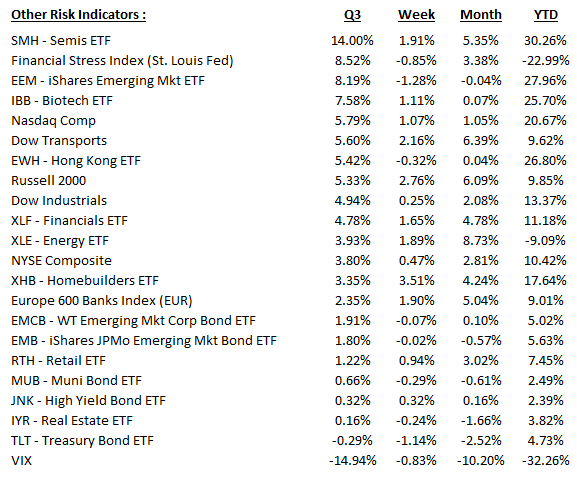
Other Risk Indicators

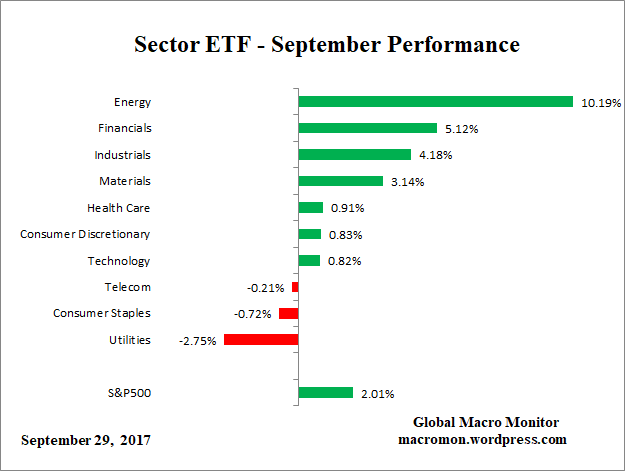
U.S. semiconductors rocked the free world in the Q3 along with the rest of the tech sector.  The Stress Index came off the lows but remains below zero, which constitutes normal financial conditions. A negative number connotes very favorable financial conditions. The index has been declining (favorable) over the past few weeks, however.

Quarterly_Other

On The Radar

We are expecting a sharp trap door sell-off in the risk markets in October triggered by a myriad of potential events, including a bond market temper tantrum in Europe,  a China economic or political shock coming out of the 19th Party Congress beginning on the 18th,  severely overbought markets, geopolitical shocks, and others.

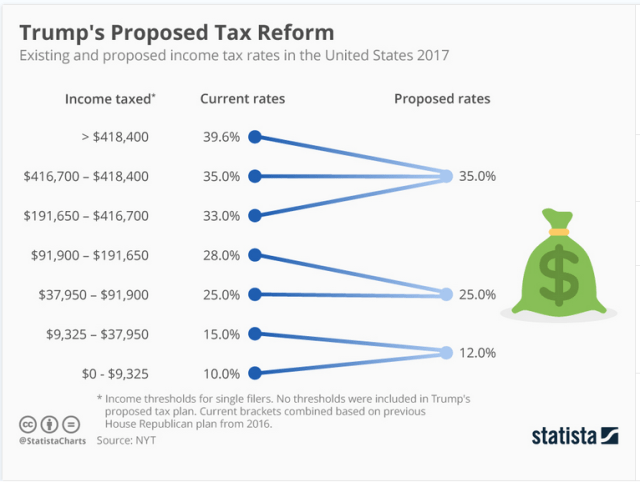
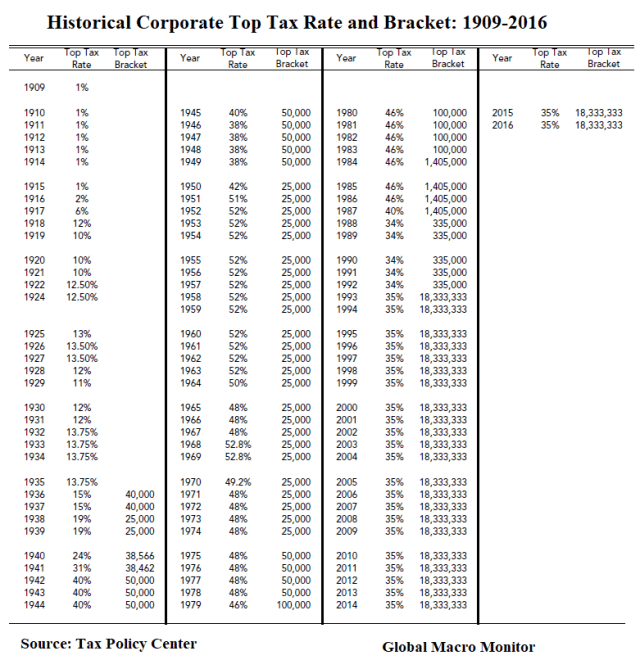
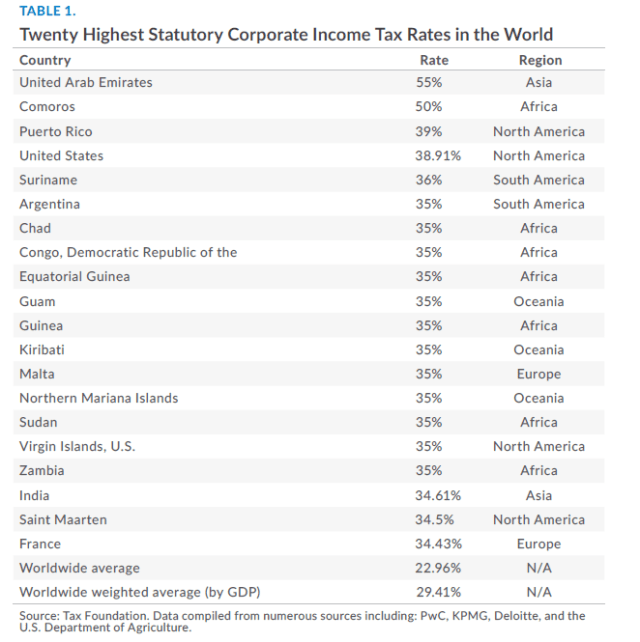
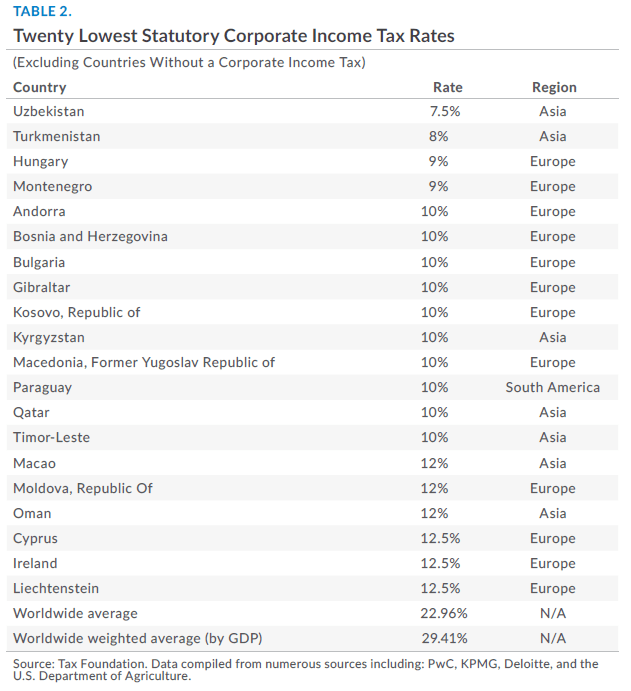
We are watching the fallout from the Catalonia vote, politics in China, progress on the Trump tax reform deal,  the continued sell-off in global bond markets.   Looking for emerging markets to cool off, which are way overbought.


Key Charts

Quarterly_Charts_1

.

Quarterly_Charts_2

.

Quarterly_Charts_3.png

.

Quarterly_Charts_6

.

Quarterly_Charts_5

.

Quarterly_Charts_4

Posted in Uncategorized | 1 Comment

Sector ETF Performance – September 29

SectorETF_DaySectorETF_WeekSectorETF_MonthSectorETF_QSectorETF_YTD

Posted in Sector ETF Peformance, Uncategorized | Tagged , | Leave a comment

GMM At The Movies: Darkest Hour

This looks sooooo good.   Coming to a theatre near you on November 22.

“You cannot reason with a tiger when your head is in its mouth” – “Winnie” – FDR’s nickname for Winston Churchill

.

Churchill was a fan of a drink, in particular Champagne. He said of it: “I could not live without Champagne. In victory I deserve it. In defeat I need it.” – Express

Posted in Movies, Uncategorized | Tagged , , | Leave a comment

Global Risk Monitor – September 29

RiskMon_1

.

RiskMon_2

Posted in Daily Risk Monitor, Uncategorized | Tagged , , , , , | Leave a comment

What’s The Matter With Inflation?

What’s The Matter Kansas  inflation?

The divergence of official inflation as measured by the government versus inflation realized by the consumer and businesses has never been greater, in our opinion.   Go ask anybody on the street in America and Europe if they think “doing life or business”  is getting  more expensive. 

We have some thoughts on what is the matter with the inflation data:

  1. Defining inflation – what is your definition of inflation?  What are we trying to measure?  The prices in a  consumer basket of goods and services?   Wages?  Asset prices?
  2. Measurement problems – the official measurement procedures seem archaic given the advent of big data in the past few years.   Even Bloomberg is out with a recent piece warning the Fed about low-balling inflation due to measurement errors.

    Low-Balling Inflation Puts the Fed at Risk

    Beware of any metric that doesn’t fully reflect housing prices.

    The U.S. has an inflation problem. It has nothing to do with inflation being too high or too low. Unlike the raging inflation of the 1970s, it doesn’t need to be solved with a lengthy and painful recession. Instead, it is a problem of measurement because the cost of housing — the single biggest expense for many Americans — isn’t explicitly included in the inflation data. 

    …Recent research from the Bank for International Settlements finds that the transmission mechanism for monetary policy has shifted. In their paper “Monetary Policy Transmission and Trade-Offs in the United States: Old and New,” Boris Hofmann and Gert Peersman concluded that changes in monetary policy — rate hikes or rate cuts — are being filtered into the economy increasingly through housing prices and less so via businesses raising prices as in years past. So even though the Federal Reserve’s policies are causing those prices to rise, they aren’t registering in the form of higher overall inflation.

    ..This creates a troublesome landscape for executing monetary policy. The Fed is wedded to a 2 percent annual inflation target without being able to get a reliable read on whether it is accomplishing that goal.
    Bloomberg, September 28

  3. Shrinkflation – companies are finding ways to raise prices without raising prices.  Paying the same price for, say, a bag of M&Ms with now only 20 candies compared to last year’s 32 candies is inflation in price per unit.   This should be adjusted for in the government stats, but we doubt they capture all of it.  Even if they try, it is unlikely they can keep up with the reality of the gazillion prices in just the domestic the economy.           Inflation_2
  4. Over massaging the datahedonic price adjustments by the BLS is total B.S..  The government economists make quality adjustments to prices.   Alan Greenspan used to use the analogy of eye surgery when explaining hedonics.   Let us paraphrase Greenie to make our point:   Historically,  eye surgery would cost you $100 in current dollars but was done with a hacksaw.  Today, eye surgery is done with laser technology and costs $10,000.  Adjusting for the quality of today’s surgery, the price has not increased.   Seasonal adjustments?   We would love to buy at some of those seasonally adjusted prices.  We call bullshit.

We could go on and on and on about the many problems with how inflation is defined and measured.

In The Government’s Interest To Keep Inflation Data Low

Keep it in perspective, comrades, the government has an interest in keeping the inflation data low.   The U.S. policymakers changed how housing is calculated in the CPI after the big inflation of the 1970’s.  Remember,  social security payments have cost of living adjustments (COLAs) linked to inflation.   Imagine if inflation breaks out with all the boomers joining the SS ranks?  Big problem.

The government’s interest in keeping inflation low is even greater now given the high debt load that most developed countries are carrying.

Nasty Feedback Loop If “Inflation” Picks Up

Ponder the ugly feedback loop:  “Inflation”  increases, interest rates rise, which increases interest payments on the Yuuge national debt.   The larger budget deficit alone is inflationary, but, in the future it is likely to be monetized.   This will accelerate inflation as inflationary expectations increase.   Nasty spiral.

Monetary policymakers know the downside of a ugly debt deflation and makes them understandably cautious about raising interest rates even though they are sowing the seeds of the deflation they fear most as they blow more and more asset bubbles, which all will inevitably burst.   Coming out of the Great Recession they suffer from “recency bias.”

It seems we now live in a type of Hegelian dialectic progression of deflation/inflation with the synthesis being asset bubbles, which immediately sow the seeds for another round of deflation/inflation.   Comrades!

Furthermore,  real wages decline if real-world prices are rising regardless of how inflation is being measured,  correctly or incorrectly.   It may explain, in part,  the punk economic recovery and the rise of populism.   That is real wages are lower than what is currently measured.

Fake News

So, when we see headline inflation defined as low, or the words lowflation, we think, and hate to say it, “Fake News!”

The markets should see through the inflation data but don’t care as they are having too much fun making money.

Euroflation

Nevertheless,  our friends at Focus Economics are out with a great infographic on inflation in the ‘zone, which we thought you should see.


Inflation_1.png


Posted in Inflation/Deflation, Uncategorized | Tagged , , | 25 Comments

COTD: President Trump’s Proposed Tax Reform

Individual income tax makes up around 49 percent of the Unites States tax revenue, the single biggest position, according to inside.gov. Trump wants to simplify the tax code by bringing the number of income tax rates from now seven down to three (35, 25, 12 percent). The plan didn’t name specific income thresholds, but the New York Times consulted plans by the House Republicans from 2016 to see how the new brackets could shape up.

Some observers have argued that Trump’s tax plan would one-sidedly profit the rich. Indeed, bringing down the tax ceiling from almost 40 to 35 percent would profit the biggest earners. In the lower middle income bracket ($37,950 to $91,900) there wouldn’t be any movement (25 percent). This contradicts Trump’s assertion that he would aim for tax cuts for the middle class. Finally, lowest income bracket taxes would hike 2 percentage points.  – statista

Tax Reform_Statista

Posted in Budget Deficit, Uncategorized | Tagged , | 3 Comments

Corporate Tax Rates and Tax Receipts

Here are some interesting data on the U.S. corporate tax rate throughout the last hundred years and a chart of federal tax receipts on corporate income as a percent of GDP.  We gathered the data from the Tax Policy Center and FRED.

Key Observations:

On Rates:

  • The corporate tax rate usually quoted is for the top bracket;
  • The corporate tax rate began to climb rapidly in 1940;
  • President Truman raised the rate from 38 % to 52 % from 1949 to 1952;
  • The tax rate peaked under Johnson/Nixon at 52.8 %;
  • President Reagan did not cut the corporate tax rate until the Tax Reform Act of 1986 (1395 pages) phasing it in over two years, reducing it from 46 % to 34 % in 1988.
  • During President Clinton’s first year in office, 1993, the corporate rate was raised to 35 percent where it has remained until today.
  • President Trump’s plan to reduce the rate to 20 percent puts it back to where it hasn’t been since 1939.

Federal Corporate Tax Receipts:

  • Corporate tax receipts peaked in 1942 at 7.52 % of GDP with a rate of 40 %;
  • Corporate tax receipts bottomed after the dot.com bust in 2002 at 1.38 % of GDP;
  • It appears that corporate tax receipts experienced a structural change in the early 1980’s and have been in the 40-year range between 1.38 % and 2.88 % irrespective of the corporate tax rate and more economically dependent. We suspect it is globalization.

We have also added a couple charts of the highest corporate tax rate countries and the lowest coming to us via the Tax Foundation.   They note the U.S. effective corporate tax rate is among the highest in the world,

The United States has the fourth highest statutory corporate income tax rate among the 202 jurisdictions surveyed. The U.S. rate of 38.91 percent (comprised of the federal statutory rate of 35 percent plus an average of the corporate income taxes levied by individual states) ranks only behind the United Arab Emirates (55 percent),Comoros (50 percent), and Puerto Rico (39 percent). Comparatively, the average tax rate of the 202 jurisdictions surveyed is 22.96 percent, or 29.41 percent weighted by GDP.  –  Tax Foundation

Corporate Taxes_Table

Corporate Taxes_Chart

Corporate Taxes_Highest

Corporate Taxes_L

Posted in Fiscal Policy | Tagged , | Leave a comment

Bunds Wagging Treasuries

Take a look at the comparison chart of the nearest Bund and U.S. 10-year T-Note futures.

Contrary to popular belief, this latest bond market sell-off was led by the German Bund and not U.S. Treasuries, flopping due to the current market narrative of a hawkish Fed, though it is a factor.

Global central banks x/ Japan are talking tough, and Europe is in a Yuuuuge bond market bubble, with the ECB way behind the curve.  That is the market where maximum bondholder nervousness lives, in our opinion.

We wonder if there are any Bunds around to trade?

The chart clearly shows the Bund peaking on September 5th versus the September 7th peak of the U.S. 10-year Treasury.

Bund_T-Note

Monitor European Sovereigns

Traders and investors should closely monitor the European bond market because that is where the bubble is and the ECB is way behind the curve given Europe’s improving economic fundamentals.


Bond Bubble_1_Sep19

Bond Bubble_2_Sep19

We think a spike in interest rates (which may be the one currently underway) emanating from Europe which spreads to the U.S., though not as acute, is the most likely trigger for an October sell-off in the global risk markets.

Equity markets are getting super lathered up over an event a long way off and has, at best, a 50/50 chance of getting through Congress.  Tax reform.

Yet event risk is legion and ubiquitous.  Any number of events, aside from an interest rate spike, could trigger the correction we are looking for.

Watch 62 basis points on the Bund yield, the 52-week high, which is now only a chip shot away.

Mr. October on deck and ready to celebrate commiserate the 30th anniversary on the 19th day of the month of, well, you know.

Stay tuned.

Posted in Bonds, Uncategorized | Tagged , , | Leave a comment

Schäuble Out As German FinMin

In our Sunday night post,  Merkel Retains Power, Far Right Moves To Bundestag, we asked:

Will the Greens demand the current German Finance Minister, Wolfgang Schäuble, step down? — Global Macro Monitor, September 24

This morning the headline on Politco.eu reads,

‘It’s over’: end of the Schäuble era – Poltico.eu

Germany_It's over


Not getting much buzz in the U.S. but this is  big news.

Sound likes Merkel is trying to woo the Free Democratic Party (FDP) into a coalition government and dangling the Finance Ministry as the carrot.  We hear the FDP wants the Finance portfolio.

If the liberals [FDP] succeed in taking over the finance ministry, they’re unlikely to abandon Schäuble’s parsimony. Like Schäuble, FDP leaders are champions of budget discipline and take a skeptical view of plans put forth by French President Emmanuel Macron, such as a substantial eurozone budget. – Politico.eu

Recall Germany’s concerns that a euro area fiscal union morphing into a transfer union.

How could Germany, with a budget surplus last year of 0.8 percent of GDP and the public debt of 68.3 percent of GDP, accept a fiscal union with Spain running the euro area’s largest budget deficit of 4.5 percent of GDP and a public debt of 100 percent of GDP?  – CNBC, May 14

If the Green Party gets the Finance Ministry it will be good news for Greece, the rest of Southern Europe and the anti-austerians.

Merkel has asked Schäuble, 75, to become speaker of the parliament, which is sure to become much rowdier with the arrival of the Alternative für Deutschland (AfD), the first far-right party represented in Bundestag.  The AfD won 94 seats in the house by securing 12.6 percent of the vote on Sunday.

Markets

The euro has been hammered since the election and it looks like the European bond market temper tantrum is underway, as we suspected.

The soon to come European bond market temper tantrum is the external shock we expect to ignite a decent sell-off in global risk markets in October.   There are other events, such as an economic or policy shock coming out of China’s 19th National Congress of the Communist Party, that can also rock the markets.

Don’t discount a potential big macro swan coming out of Washington either.

We are not looking for a bear market, but a decent size flash-type crash that may last a few days or a few weeks, which can be bought.   Everyone is waiting to pounce — until volatility spikes and fear takes over.   It should be fast and furious, especially with the rise of the buy the dipper algos and trading ‘bots.
 – Global Macro Monitor, September 20

Euro sovereign weakness spilling into an already weak U.S. bond market, adding to the hawkish Feds speak, we believe will lead to a decent sell-off in risk assets sometime soon.  The 10-year U.S. yield is up almost 30 bps since September 7th.

Another 10 bps higher in the 10-year Bund yield will break resistence and  the European bond sell-off  could gather some momo.   Watch this space.

U.S. Tax Reform

U.S. stocks getting all lathered up over tax reform especially small caps as tax cuts affect small caps disproportionately positive.   “Harder than health care” is the word on the street in Washington about passing a tax reform bill.   The lobbyists bring out the big weapons and money during tax reform.  Budget hawks want offsets, which will take away the goodies from many special interests.

The Republicans are in their hurry-up offense as they smell a wave election coming in 2018 and they will soon be out of power.

It is starting to get interesting.

Mr. October on deck.   Stay tuned.

Gerrmany_Euro

Gerrmany_Bund

Posted in Uncategorized | Leave a comment

The Emerging Markets 30-30 Club

Demographics are destiny and increasingly becoming  the defining narrative of the global economy.   Japan’s aging population is blamed for much of the country’s economic woes.   Doomsters predict economic Armageddon as the world goes gray.

We put together a nice data dump for you to decide.   We also look at the relationship between investment, the median age of a country, and the IMF’s 2017-20 GDP forecast for the world’s economies.

EM_3030_Age

The 30-30 Club

Just as major league baseball has an elite 30-30 club – where a player hits over 30 home runs and steals over 30 bases in one year – we have constructed our own  30-30 club for the global economy.     We filtered countries by median age, those under 30 years; and by investment as percent of GDP, those who averaged over 30 percent of GDP from 2014-2016.

Our 30-30 club,  in theory, should experience higher growth than other economies.  A younger population equates to a growing labor force, and higher investment should lead to higher productivity growth —  both,  the secret sauce of a dynamic economy and main factors in traditional growth models.  Human capital, or education and training,  and innovation, tougher to measure, are also additional necessary factors for dynamic economic growth.

This post is just a cursory analysis that could be the topic of many Ph.D. dissertations.  We thought about running some multiple regressions, but you do not pay us enough.

By the way,  Mike Trout was the last major league ballplayer to hit over 30 home runs and steal more than 30 bases in 2012.

G20

Let us first have a look at the G20 data for a reference point to compare the later data.

The G20 median age is almost eight years older than the world’s median age.  The EU is old.   Japan and Germany are the two oldest countries in the world.

The G20 investment to GDP ratio average was around 25 percent for 2014-16 .  Median forecasted growth is 1.9 percent for the 2017-2020 period.

Blasé!  Except for the outliers, especially India and Indonesia.

EM_3030_G20_Table

EM_G20_Chart

The chart shows the relationship between GDP growth and median age.   The trend line illustrates that older populations tend to grow slower than younger ones.

Yep.  It is a simplistic analysis,  other variables should be controlled for, and a better analysis would include multiple multi-variate regressions.      Grab your checkbook blockchain and send us some Bitcoin if you want us to go deeper.

Emerging Markets 30-30 Club

Only 28 out of  our 170 country sample made the cut. Both the average and median gwowth forecasts are almost 1 pecennt above the world’s.  Not that impressive but we will take it.  Saudi. Suriname, and Algeria’s flattish growth really punk the average and median.

It is no surprise that relatively small emerging markets dominate the 30-30 club except for India, Indonesia, and Saudi.    Very similar to the fact growth in the equity markets is found in the small cap stocks.


EM_3030_3030_Table

EM_3030_3030_Chart

The chart is interesting in that as the median age approaches 30 the deviation from the trend line gets larger.  We have to think about that for awhile.

Nevertheless,  not a tight fit but still the sign is correct – a negative relationship.  Younger countries,  even in our 30-30 club,  tend to grow faster than older countries.

The World Chart

We threw in the chart of the entire sample.  As expected the relationship is much tighter.

Moreover, the converse is true with the world chart:  as the median age increases country GDP growth converges at lower levels.    Younger economies have a much more broader dispersion of economic performance.

EM_3030_World_Chart

Upshot

It’s obvious.   All other things remaining equal — and they never do — you know where the growth is going to be and where the capital is going to be flowing over the next several years.

Need to nomalize valuations first,  however.


Posted in Demographics, Economics, Uncategorized | Tagged , , , , | 1 Comment