The Fed tightens on Wednesday and bonds rally. What the hay?
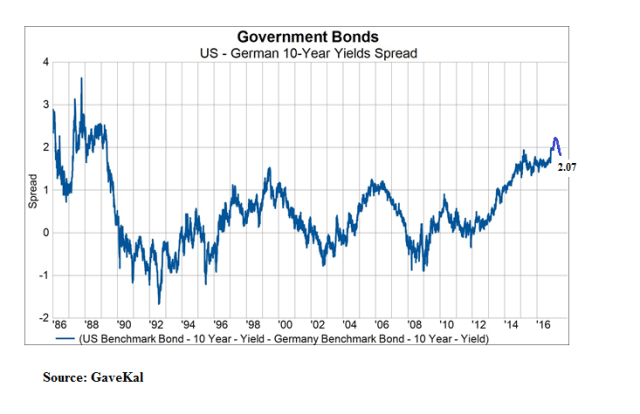
GaveKal, Jeff Gundlach, and Jim Bianco nailed it in that every spec and their mother are/were short 10-year Treasuries.
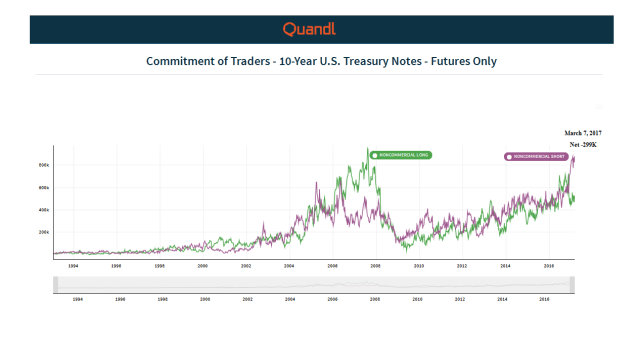 Source: Quandl (see here for interactive chart)
But this is only a small part of the story: The global bond markets are broken.
There are no signals, there is no noise. Trying to infer any sense of economic or financial information from bond yields is futile.
QE Distortion
The intervention into the bond markets by central banks through quantitative easing (QE) in the big four sovereign bond markets – U.S., Japan, Eurozone, and UK – has created a structural shortage of risk-free instruments and distorted the most important price in the world — the yield on 10-year hard currency sovereign bonds.
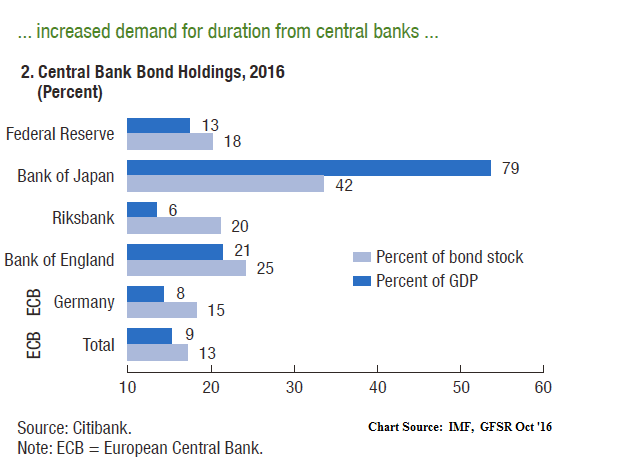
Furthermore, past QE in the U.S, coupled with the recycling of foreign capital flows back into the U.S. bond market, has, in particular, created an acute structural shortage of longer-term Treasury securities. The totality of short positions of the fast money in both the cash and derivatives market are probably a much larger proportion of the effective float of longer-term marketable Treasury securities than what the market currently perceives. Hence the stickiness of U.S. bond yields.
Fed and Foreign Ownership of the U.S. Yield Curve
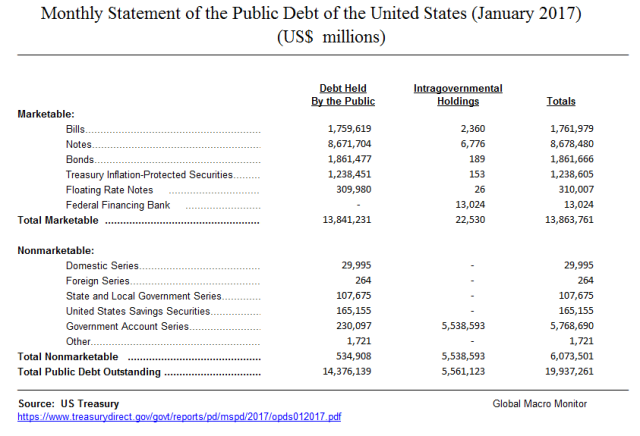
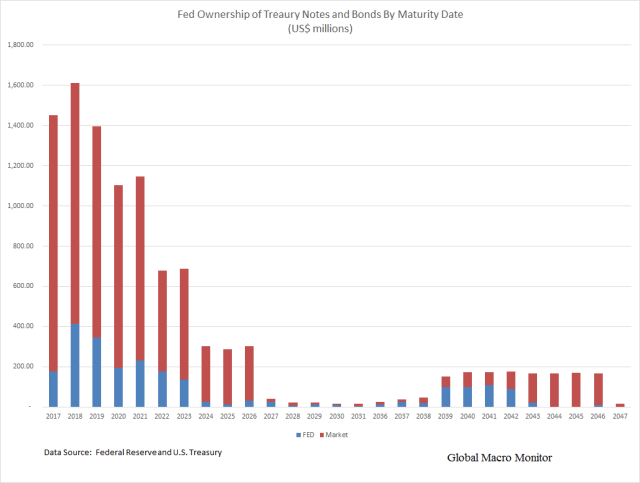
The table and chart below illustrate just how small the actual float of longer-term marketable U.S. Treasury securities is available to traders and investors. The data show the Fed owns about 35 percent of Treasury securities with maturities 10-years or longer. Note the data only include notes and bonds and excludes T-Bills.
The Fed’s holdings combined with foreign ownership of longer maturities — more than 1-year — exceeds 80 percent of marketable Treasuries outstanding. The Fed combined with just foreign official holdings, mainly, foreign central banks, is 65 percent of maturities longer than 1-year. Thus, almost 2/3rds of tradeable Treasuries longer than 1-year are held by entities with no sensitivity to market forces.
Note, the Treasury International Capital (TIC) data does not break down foreign holdings by year of maturity, only by short-term and long-term – that is, greater than 1-year.
.
 .
.
 .
.
Foreign Holding of Treasuries
We hear a lot these days about a 1994 bond market debacle. We lived through that bond bear and it wasn’t fun. However, the microstructure of the Treasury market is entirely different today than it was back then.
First, the Fed did not hold long-term Treasuries. Second, foreign holdings of Treasuries were only about 15 percent of the outstanding debt versus around 50 percent today and everybody, including, Ross Perot, who said the trade was “a no brainer”, were levered long riding the yield curve – short short-term, long long-term.
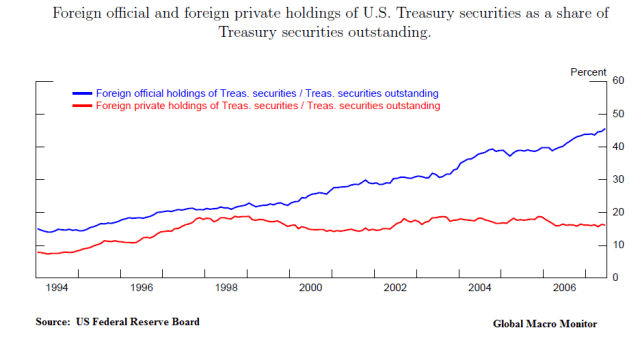 Foreign inflows, mainly the result of the recycling of U.S. current account deficits, resulted in Alan Greenspan’s bond market conundrum and the Fed losing control of the yield curve just prior to the 2007-08 financial crisis.
In this environment, long-term interest rates have trended lower in recent months even as the Federal Reserve has raised the level of the target federal funds rate by 150 basis points. This development contrasts with most experience, which suggests that, other things being equal, increasing short-term interest rates are normally accompanied by a rise in longer-term yields.
…In the current episode, however, the more-distant forward rates declined at the same time that short-term rates were rising. Indeed, the tenth-year tranche, which yielded 6-1/2 percent last June, is now at about 5-1/4 percent. During the same period, comparable real forward rates derived from quotes on Treasury inflation-indexed debt fell significantly as well, suggesting that only a portion of the decline in nominal forward rates in distant tranches is attributable to a drop in long-term inflation expectations. – Alan Greenspan, Feb 2005
A paper published by the Federal Reserve Board (FRB) in 2012 estimated the impact on interest rates of the capital flow recycling into the U.S. bond market,
We find that a $100 billion increase in foreign official inflows into U.S. Treasury notes and bonds lowers the 5-year yield by roughly 40 to 60 basis points in the short run. However, our VAR analysis shows that in the long-run, when we allow foreign private investors to react to the effects induced by a shock to foreign official holdings, the estimated effect is roughly -20 basis points per $100 billion. Putting these results into context, between 1995 and 2010 China acquired roughly $1.1 trillion in U.S. Treasury notes and bonds. A literal interpretation of our long-run estimates suggests that if China had not accumulated any foreign exchange reserves during this period, and therefore not acquired these $1.1 trillion in Treasuries, all else equal, the 5-year Treasury yield would have been roughly 2 percentage points higher by 2010. This effect is large enough to have implications for the effectiveness of monetary policy. – FRB
Extrapolating the above analysis to the current stock of foreign official Treasury holdings of around $4 trillion leads to nonsensical results, such as the 5-year yield should be 800 basis points higher than it is today. Obviously, the analysis should truncate the dependent variable – 5-year note yield — and ceteris paribus (other things being equal) does not hold in the real world.
But we should not miss the article’s main point that market interest rates would be much higher if not for foreign central bank interventions into their FX markets and the recycling of those reserves back into the Treasury market. We take the above analysis seriously but not literally and wonder if the Trump Administration considers it when they rail on “so-called” currency manipulators.
The Yield Curve During Monetary Tightening
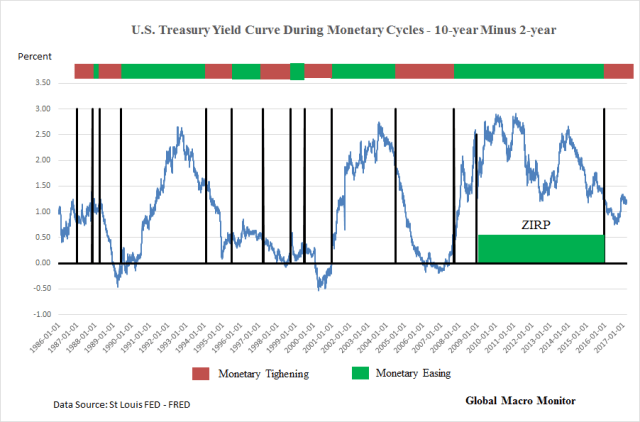
We have looked at the data and constructed some charts that show that in monetary tightening cycles in the U.S. the yield curve (10-2 years) usually flattens.
.
 .
.
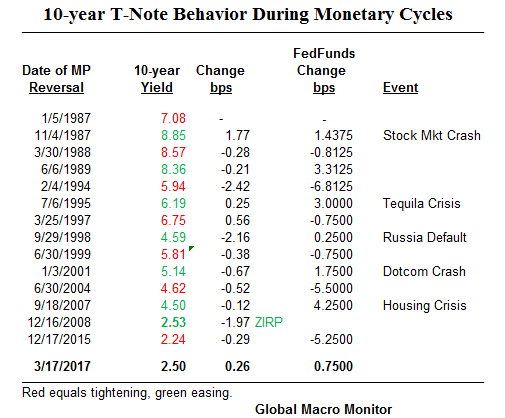
In only two of the past six tightenings did the 10-year bond rise in yield from the day of the first tightening to the day of the first easing. This is entirely possible due to the fact the Fed often “tightens until something breaks” and the bond market front runs the expected easing cycle.
During the 2004-07 tightening cycle, the era of the Greenspan bond market conundrum, for example, the 10-year yield managed to rise only a maximum of 64 bps during the entire cycle from a beginning yield of 4.62 percent to a cycle high yield of 5.26 percent. This as Greenspan raised the fed funds rate by 4.25 percent, from 1.0 percent to 5.25 percent.
Was the market forecasting the coming financial crisis? Hardly.
Alan Greenspan blames the Fed’s loss of control of the yield curve, mainly due to the recycling of capital flows by foreign central banks, as a major cause of the housing bubble. Notice the importance of the 10-year yield on the allocation of resources and on how its distortion can be at the root of financial and economic bubbles.
This Time Is Different
Those dreaded words, “this time is different.” We should warn readers that this time is truly different, however. When the Fed first raised interest rates in December 2015, for example, the 10-year yield was at 2.24 percent and more than 50-75 percent lower than at the beginning of any other monetary tightening cycle over the past 30 years. There are many “unprecedents” in this cycle and therefore more uncertainty.
 .
.
Forecasting With The Yield Curve
Given the technical distortion of the bond market, we find it kind of silly with statements such as “what is the bond market telling us?” Nothing!
There is no price discovery. Given the intervention and distortion to bond yields caused by the Fed and foreign central banks, who knows what the right interest rate is for longer-term Treasury securities.
We will never forget the words of a prominent market strategist when rates were super depressed.
“ We’re in a depression. That is what the bond market is telling us.”
Even at the Friday close, we hear equity traders are worried about why the 10-year yield is so low and fell after Wednesday’s Fed tightening.
Information Feedback Loops
One of just many dangers of the lack of price discovery in the bond market is the potential formation of positive feedback loops, where other markets fail to discount these distortions and act accordingly. That is, for example, the equity markets sell off because they freak out interest rates are declining when they should be rising. Or the private sector fails to invest in CapX as they wrongly anticipate an economic downturn because of falling or excessively low bond yields. Their actions thus become a self-fulfilling prophecy.
A flatter than normal yield curve could also adversely affect bank lending. Look at how financial stocks have been underperforming recently as the yield curve has flattened about 7 bps this year.
Conclusion
Welcome to Bond Market Conundrum 2.0.
Asset prices are artificially elevated and foreign exchange rates are distorted due to the repression of the risk-free interest rates because of lack of supply. Capital has been misallocated and the Fed has once again lost control of the yield curve simply by the very fact it owns the yield curve.
Monetary policymakers probably won’t regain control of the yield curve until they begin to reduce their balance sheets and the supply/demand balance moves closer to equilibrium.
That’s when we suspect everybody and their mother will front run the central bank selling and we will have the real bond market debacle some in the market have been expecting. Will or can that day ever come? We don’t know.
Of course, governments could go on a tax cut/spending binge and increase the primary supply of government bonds. Possible but doubtful and a longer term story, if any.
Until then? We still believe bonds are in a slow bleed bear market, which will see fits of massive nutcracking short covering, as interest rates slowly drift higher.
Remember, there are no signals, there is no noise. Here’s to hoping the markets understand that.
A Few Caveats
The data points presented above should be taken as rough, but good, approximations. The dates of each source of data may differ and the same is true for the different data sources.
Furthermore, we may be entirely wrong in our conclusions.
Abraham Lincoln used to tell a story as a young Illinois circuit court lawyer when trying to convince the jury to render a verdict in his favor.
The story goes that Lawyer Lincoln was worried he had not convinced the jury during the closing argument of a civil case against a railroad. The jurors had gone to lunch to deliberate. Lincoln followed them and interrupted their dessert with a story about a farmer’s son gripped by panic,
“Pa, Pa, the hired man and sis are in the hay mow and she’s lifting up her skirt and he’s letting down his pants and they’re afixin’ to pee on the hay.” “Son, you got your facts absolutely right, but you’re drawing the wrong conclusion.”
The jury ruled in Lincoln’s favor.
Similarly, when looking at data and charts — the facts — we often draw the wrong conclusion about future direction.
Stay tuned.
Data Appendix