

(click here if table is not observable)
(click here if table is not observable)
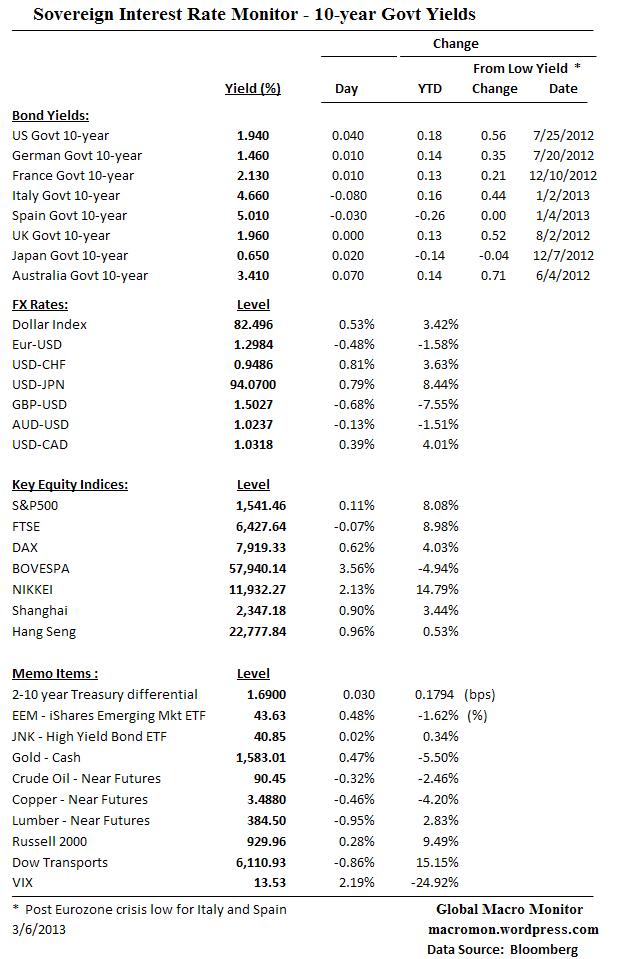
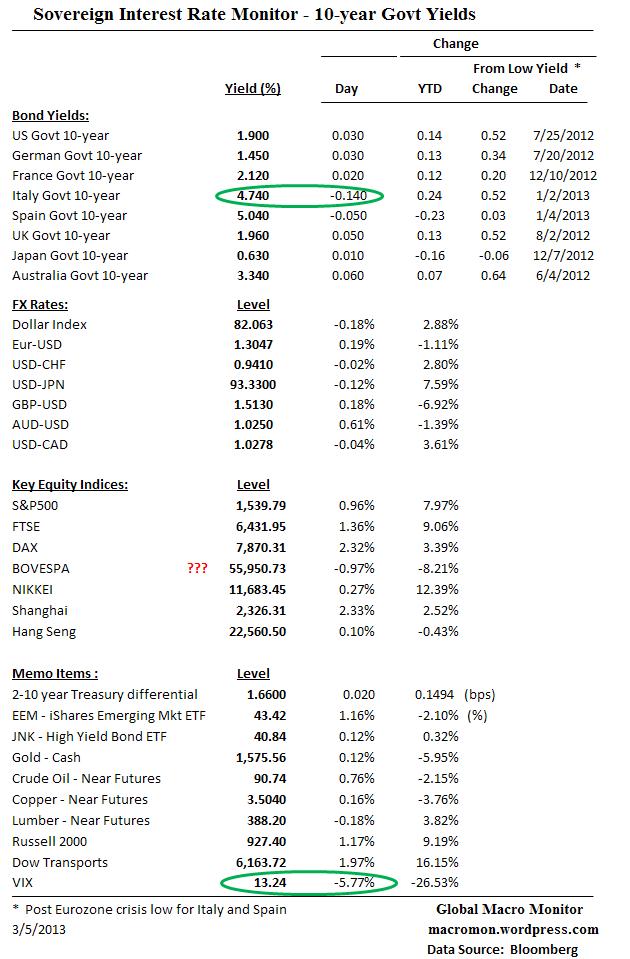
ECB president, Mario Draghi, spoke in this morning’s press conference about how contagion has been contained in the eurozone bond markets since the Italian elections. The data are in and he is right.
The markets had closed before the election results were announced on Monday February 25th . After blowing out the next day, periphery 10-year sovereign spreads to the German bund have come in with Italy now only 18 bps wider since the election, Spain 21 bps tighter, Portugal 17 bps tighter, and Greece 5 bps wider. Contained, indeed!

(click here if table and video are not observable)
 (click here if table is not observable)
Good insight.
Rachel Sanderson, Milan correspondent, talks to Italy’s business leaders about the country’s inconclusive election results and the structural changes they hope to see implemented once a new government is elected.
In depth: Italy elections 2013
http://www.ft.com/indepth/italy-elect…
(click here if video is not observable)
(click here if table is not observable)
(click here if video is not observable)
In 1990 Brad De Long, Andrei Scheifer, Larry Summers, and Robert Waldmann published, Noise Trader Risk in Financial Markets, in the Journal of Political Economy. The piece made the distinction between short-term traders with long-term investors and concluded that their different time horizons created price volatility allowing “noise traders” to sometimes capture “higher expected returns than rational investors. “ It had a tremendous influence on how we view markets and is applicable, in our opinion, in explaining the current character of today’s U.S. stock market.
We see the underlying drift higher in U.S. stocks caused by two groups of investors: 1) those who comfortably long with a bias toward dividend and defensive stocks and refuse to be shaken out on macro noise and small sell-offs. Their current bias restricts real supply; and 2) underinvested long-term money, which is using any sell-off as a buying opportunity thus providing the underlying bid or demand to the market.
The two fundamentals factors driving these two investor groups are: 1) the continuation of the Fed’s super loose monetary policy – zero interest rates and quantitative easing; and 2) and positive U.S. economic data, which will continue to support earnings. Any expected change in these two fundamental forces would motivate selling, in our opinion.
The fast money crowd, or noise traders, buy, sell, and short based on macro headlines, technical indicators, and inter-market correlations, among other things. Their time horizons and pain threshold are very limited. If their trades are not confirmed by real selling from the investor class they rush to unload/cover their positions. The noise traders can move the market around 20-30 S&P points but are very impatient unless confirmed by the investor class.
Thus a a strange market.
Commodities are not confirming the run up in U.S. stocks, which can be interpreted as either bearish or bullish. On the bearish side, sluggish commodities reflect slowing global growth and a China that may or may not be in trouble. The bulls, however, argue that lower commodities improve economic fundamentals, such as profits and real income, and the fact that commodities are no longer working is motivating and allowing money to flow into stocks (ditto for Apple, by the way).
The trade used to be if the S&P500 was rallying, get long beta in the form of emerging markets. Not this year. Take a look at the graph of year-to-date returns of the S&P500 and the BRICs.

Furthermore, the dollar has broken out of a very narrow 6-month trading range. Recent stock rallies and “risk on” moves have usually been associated with a weaker dollar. Bulls now argue that dollar strength reflects global capital flows wanting a piece of the REALTIVELY positive U.S. story. No doubt the stronger dollar will be headwind for profits, but earnings season is a month out.
 This is a different market with a different character and not the “risk on” rally of the past few years. Given the Fed’s $85 billion per month asset purchase program what’s past may not be prologue.
The danger in our view is that it breeds complacency, but that’s how we see it. Could be wrong and therefore we maintain our flexibility.
(click here if charts are not observable)

(click here if table is not observable)
“…A typical apartment in Shanghai cost about 45x the average resident’s annual salary.” – Leslie Stahl
In case you missed 60 Minutes tonight here is a very interesting piece on what drives and what plagues China. This is a must view, folks.
The McSwans (macro swans, which drove volatility over the past few years) appear to be resurfacing with Italy’s election and China’s attempt to curb its real estate bubble. Most Chinese property stocks are limit down (-10 percent) in trading today as the government steps up its pressure to curb real estate speculation.
China’s economy has become the second largest in the world, but its rapid growth may have created the largest housing bubble in history. Lesley Stahl reports.
(click here if video is not observable)
The Relative Strength Index (RSI) is a momentum oscillator that measures the speed and change of price moves. The RSI moves between zero and 100 and is considered overbought with a reading above 70 and oversold when below 30. Note the RSI can sustain an overbought (oversold) reading in a strong up (down) trend.
Click chart to enlarge.

(click here if chart is not observable)

