Global Trend Indicators

(click here if tables are not observable)

Posted in Global Trend Indicators | Tagged , , , , , , , | 1 Comment

Chart of the Day: Italy Sliding

(click here if chart is not observable)

Posted in Black Swan Watch, Chart of the Day, Charts, Economics, Euro, PIIGS | Tagged , | 3 Comments

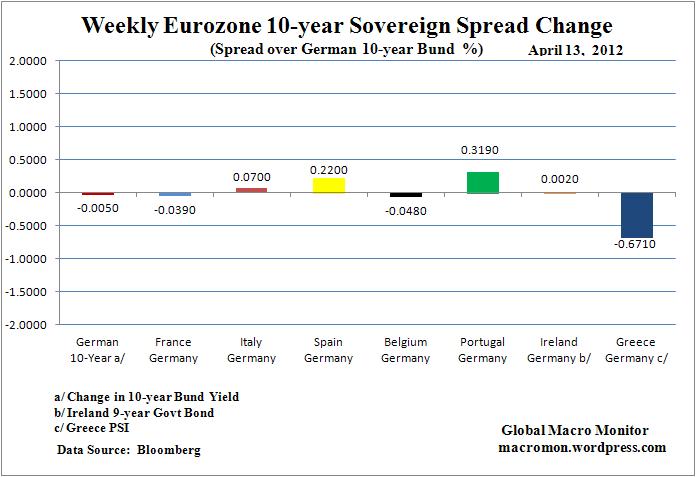
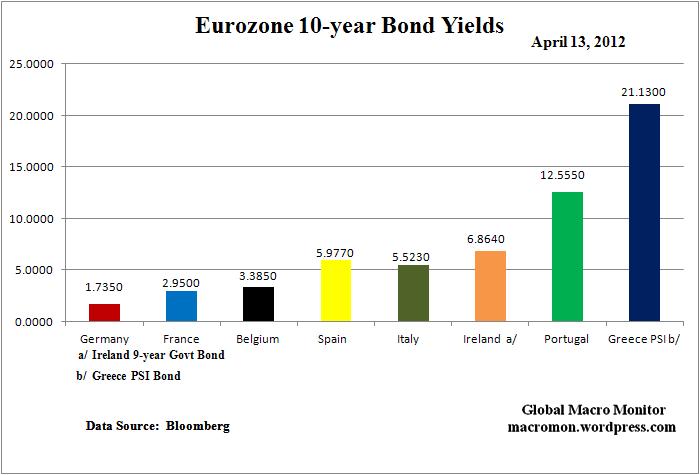
Weekly Eurozone Watch

(click here if charts are not observable)

Posted in Weekly Eurozone Watch | Tagged , , , , , , , , , | Leave a comment

Is the correction over, Mr. Fibonacci?

Wow!  Who said this business was easy?

After clear breaks of their short-term uptrend and 50-day moving averages,  the major U.S. equity indices have staged a powerful two day rally off their Tuesday intraday lows.   Many were caught off guard as almost all indicators were signalling and flashing an intermediate term correction was in the works.  Copper’s break  made it too easy to sell equities.

After a nice two day bounce, stocks have retraced almost 50 percent of the correction which began after the April 2nd highs on the S&P500 and Dow; and the March 27th highs on the Nasdaq and Russell 2000.    The table below shows that all four indices closed just shy of the key 50 percent retracement level.

So is that it?   We, like everyone else, have no idea.

The indices need to close above their .618 retracement level, which is less than a 1 percent move x/ the Russell, before sounding the all clear, in our book.   The seasonals are set to deteriorate,  the anesthesia from LTRO2  is starting to wear off as European sovereign spreads are blowing out again, French and Greek elections loom,  and the nature of China’s landing is still far from certain.

Love to find out who started the rumor that China was going to print 9 + percent GDP growth, which helped get the market all lathered up this morning.   Must of had a bad copper position they needed to unload.

JP MO on deck.

(click here if table and chart is not observable)

Posted in China, Equities, Technical Analysis | Tagged , , , , , | 4 Comments

TR50: The 50 Most Innovative Companies (31-35)

Here are 31-35 of MIT’s Technology Review’s 50 Most Innovative Companies in 2011.  We’re posting in increments of five every few days as not to overwhelm you with info and required reading.

Click here for 1-5 of TR’s most innovative companies of 2011;
Click here for 6-10 of TR’s most innovative companies of 2011;
Click here for 11-15 of TR’s most innovative companies of 2011;
Click here for 16-20 of TR’s most innovative companies of 2011.
Click here for 21-25 of TR’s most innovative companies of 2011.
Click here for 26-30 of TR’s most innovative companies of 2011.

Technology Review uses the following criteria to choose the most innovative companies,

What is a TR50 company?   It is a business whose innovations force other businesses to alter their strategic course. TR50 members are nominated by Technology Review’s editors, who look for companies that over the last year have demonstrated original and valuable technology, are bringing that technology to market at a significant scale, and are clearly influencing their competitors.

31)  PatientsLikeMe
Why:
Online social connections and shared data offer a new way to improve the understanding and treatment of disease.
Key innovation:
Published a peer-reviewed study, based on data volunteered by site users, that countered the results of a clinical trial assessing the effects of lithium on ALS, or Lou Gehrig’s disease.

32)   Qualcomm
Why:
The Mirasol display for mobile devices provides full color even in bright sunlight and uses a fraction as much power as today’s phone and tablet displays.
Key innovation:
Technology modeled on a butterfly’s wing creates a bright image by reflecting and amplifying particular wavelengths of ambient light.

33)  Roche
Why:
 Its new drugs target genetic mutations in cancer cells.
Key innovation: 
Developed a lung-cancer drug and a diagnostic test for the mutation that makes some cancers susceptible to the drug.

34)  Safaricom
Why:
Has deployed mobile health services over Kenya’s cellular network.
Key innovation:
Through cell phones, the company offers ­services such as first-aid recommendations for subscribers.

35)  Sakti3
Why:
Its high-energy batteries, which will first appear in consumer devices, could make electric cars cheaper and improve their range.
Key innovation:
Making batteries without the flammable liquid found in conventional electric-car batteries means they can store more energy.

TR – (1-5)
TR – (6-10)
TR – (11-15)
TR – (16-20)
TR – (21-25)
TR – (26-30)

Posted in Innovation, Technology | Tagged , , , , , , , , | Leave a comment

Stratfor: The International Shale Gas Industry

As natural gas prices hit record lows in the U.S.,  Stratfor provides an excellent overview on the current state of the shale gas industry and its future.

Natural gas prices have now plunged so low there isn’t a significant player in the market who is even drilling for unassociated natural gas.  What new supplies are coming on line are almost wholly associated natural gas produced as part of shale oil development efforts…Stratfor sources in the industry estimate that upwards of 40 percent of total natural gas production in the United States is now, in essence, a waste product…

The upshot?   Buy Australia natural gas industry,  sell Russia.

(click here if charts and video are not observable)

Posted in Commodities, Crude Oil, Geopolitical | Tagged , , , , | Leave a comment

Sovereign Debt Holdings By Type of Investor

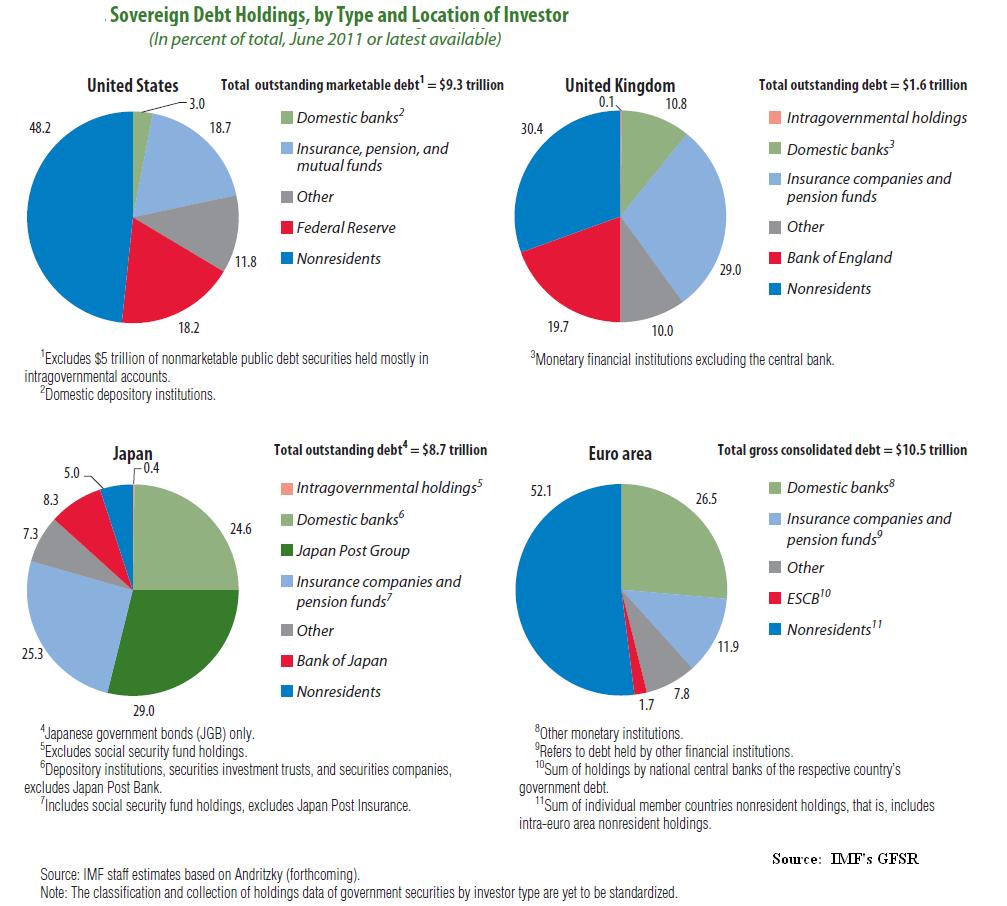
The International Monetary Fund (IMF)  is out with an update of their Global Financial Stability Report, which includes the following graphic of sovereign debt holders of the big three issuers and the Euro area.   The IMF notes,

…In the United States, foreign investors have dominated the market for U.S. Treasuries in view of its large size and depth and its high perceived degree of safety. However, post crisis monetary stabilization efforts increased the prominence of the Federal Reserve as a holder of government debt.

In Europe and Japan, domestic banks have played an important role as sovereign debt investors, in each case accounting for about 25 percent of outstanding sovereign debt (Figure 3.6).  In the United Kingdom, insurance companies and pension funds have been traditional holders of government securities, although the Bank of England and foreign investors assumed a more prominent role after the global financial crisis.

Click on graphic to enlarge and for better resolution.

(click here if graphic is not observable)

Posted in Black Swan Watch, Sovereign Debt, Sovereign Risk | Tagged , , , , , , | 1 Comment

Depression in the European Periphery

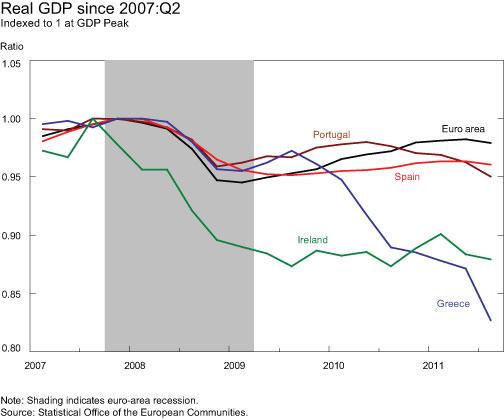
Nice chart and analysis from the New York Fed’s blog,

The chart also shows that the current economic situation is much weaker in several euro-area periphery countries. The recession in Greece has yet to end, and real GDP is now more than 17 percent below its prior peak. While a recovery recently appeared to be under way in Ireland, real growth is still 12 percent below peak. Portugal’s economic contraction during 2008-09 was less severe than that for the euro area. However, Portugal’s recovery faltered in mid-2010, and the economy has been contracting since then. Spain also experienced a milder recession than the euro area, but its recovery began later and has been progressing at a slower pace, leaving it around 4 percent below peak.

(click here if chart is not observable)

Posted in Black Swan Watch, Euro, PIIGS, Sovereign Debt, Sovereign Risk | Tagged , , , , | 1 Comment

TR50: The 50 Most Innovative Companies (26-30)

Here are 26-30 of MIT’s Technology Review’s 50 Most Innovative Companies in 2011.  We’re posting in increments of five every few days as not to overwhelm you with info and required reading.

Click here for 1-5 of TR’s most innovative companies of 2011;
Click here for 6-10 of TR’s most innovative companies of 2011;
Click here for 11-15 of TR’s most innovative companies of 2011;
Click here for 16-20 of TR’s most innovative companies of 2011.
Click here for 21-25 of TR’s most innovative companies of 2011.

Technology Review uses the following criteria to choose the most innovative companies,

What is a TR50 company?   It is a business whose innovations force other businesses to alter their strategic course. TR50 members are nominated by Technology Review’s editors, who look for companies that over the last year have demonstrated original and valuable technology, are bringing that technology to market at a significant scale, and are clearly influencing their competitors.

26)   Life Technologies
Why:
 Lowering the cost of DNA sequencing opens the door to more genetically targeted treatments and diagnostics.
Key innovation:
 Its benchtop sequencer can sequence a human genome in one day, at a cost of just $1,000 per genome.

27)  Nicira
Why:
By using virtual computer networks rather than hardwired systems to connect cloud servers, it could make the cloud more secure and reliable.
Key innovation:
Its software takes over the functions of network hardware, resulting in a distributed system of components that can swiftly respond to changes in workload.

28)   OnLive
Why:
Allows users to access applications too powerful for their hardware to support.
Key innovation:
Its video streaming technology minimizes lag so that applications running on a server appear to be running locally.

29)   Organovo
Why:
Its three-dimensional artificial tissue structures can be used for drug testing and are likely to find therapeutic applications.
Key innovation:
A printing process methodically deposits layers of cells and gel material to build up new tissues.

30)   Palantir Technologies
Why: Its software can extract common threads from mountains of data, potentially yielding leads for intelligence agencies and police forces.
Key innovation:
The software, which can begin analyzing a new data set without extensive preparation, can handle many different types of input, including data from military operations and financial transactions.

TR – (1-5)
TR – (6-10)
TR – (11-15)
TR – (16-20)
TR – (21-25)

Posted in Innovation, Technology | Tagged , , , , , , , , | Leave a comment

Tough Day in Euroland

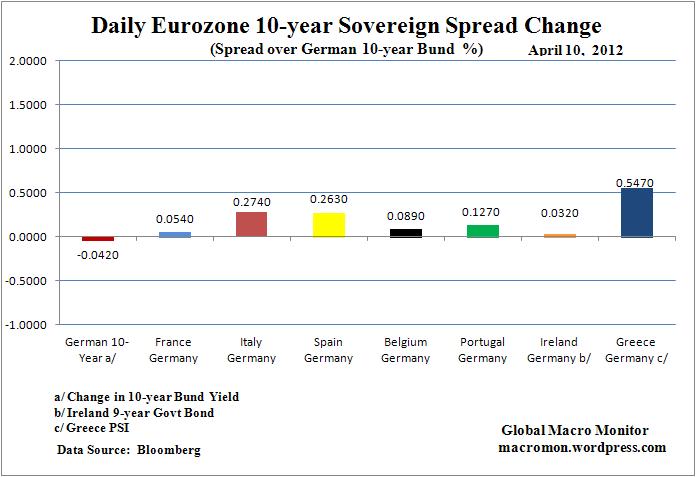
Europe came back from its long Easter weekend and took a nasty spanking.

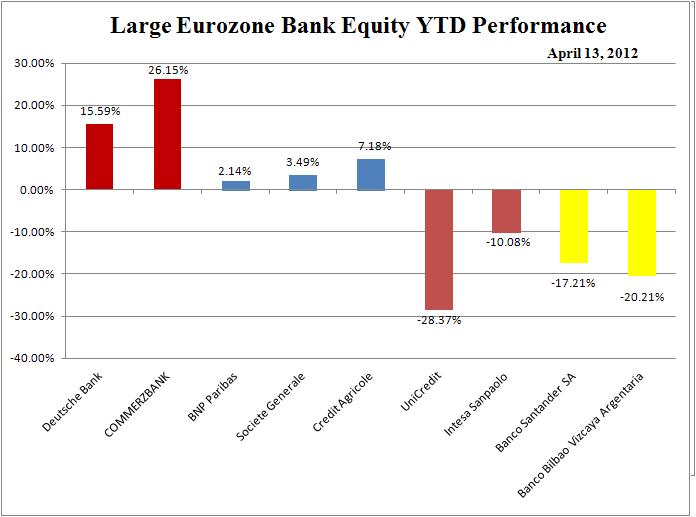
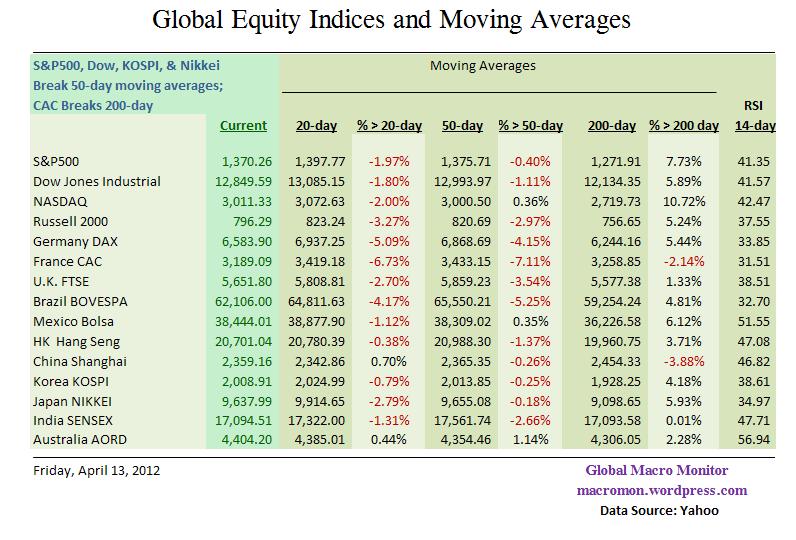
Spain’s sovereign spread over German bunds blew out 26.3 bps and is within 40 bps of its November high, while Italy moved 27.4 bps wider.   The large eurozone banks got thumped (see chart), the CAC 40 broke its 200-day moving average, and the German DAX was down more 2 1/2 percent.

Alcoa on deck.

(click here if charts are not observable)

Posted in Black Swan Watch, Equities, Euro, Eurozone Sovereign Spreads, German Bund, Sovereign Debt, Sovereign Risk | Tagged , , , , , | Leave a comment