Ruchir Sharma: Breakout Nations and the Commodity Bubble

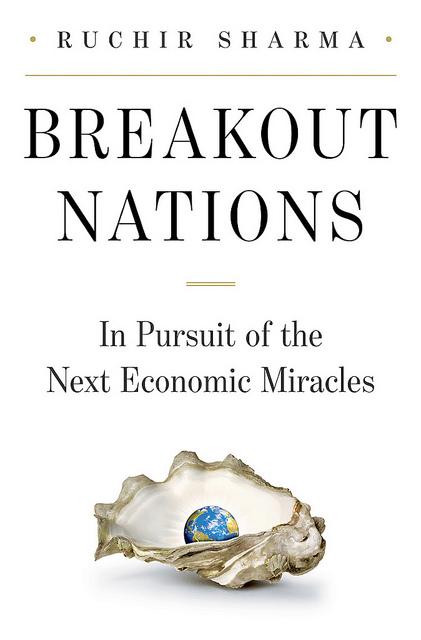
This CNBC Fast Money interview with Ruchir Sharma is a must view.  His newly published book, Breakout Nations, also looks like a must read and is in definitely on our reading list.

Sharma also has a good piece in The Atlantic.  Here’s an excerpt,

As playwright Arthur Miller once observed, “An era can be said to end when its basic illusions are exhausted.” Most of the illusions that defined the last decade — the notion that global growth had moved to a permanently higher plane, the hope that the Fed (or any central bank) could iron out the highs and lows of the business cycle — are indeed spent. Yet one idea still has the power to capture the imagination of the markets: that the inexorable rise of China and other big developing economies will continue to drive a “commodity supercycle,” a prolonged upward rise in the prices of commodities ranging from oil to copper and silver, to textiles, to corn and soybeans. This conviction is the main reason for the optimism about the prospects of the many countries that live off commodity exports, from Brazil to Argentina, and Australia to Canada.

I call this illusion commodity.com, for it is strikingly similar in some ways to the mania for technology stocks that gripped the world in the late 1990s. At the height of the dotcom era, tech stocks comprised 30 percent of all the money invested in global markets. When the bubble finally burst, commodity stocks — energy and materials — rose to replace tech stocks as the investment of choice, and by early 2011 they accounted for 30 percent of the global stock markets. No bubble is a good bubble, and all leave some level of misery in their wakes. But the commodity.com era has had a larger and more negative impact on the global economy than the tech boom did.
We’ve long held that many emerging markets have experienced a very positive terms of trade shock with the rise in commodity prices,  which is masking structural problems that have never been addressed.   Sharma seems to agree.

(click here if video is not observable)

Vodpod videos no longer available.

Posted in BRICs, Commodities, Crude Oil, Uncategorized | Tagged , , , | 6 Comments

Dow Chem CEO: U.S. Can Be An Energy Exporter

CNN Money reports,

NEW YORK (CNNMoney) — The government approved the first ever natural gas export facility in the lower 48 states on Monday, clearing the way for a project that could be a significant job creator.

But critics argue that, just like the Keystone pipeline expansion, building this project will have environmental impacts far beyond the plant itself. They also say it could raise the price of natural gas in the U.S.

(click here if video is not observable)

Vodpod videos no longer available.
Posted in Commodities, Crude Oil, Energy, Uncategorized | Tagged , , , | Leave a comment

Dow First to Regain Footing

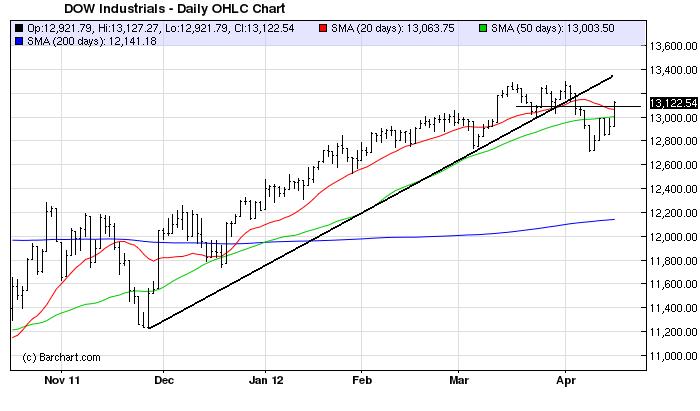
If the Dow can close here, up almost 200 points, it will be the first major U.S. equity index to regain its footing and close above the key .618 fibonacci retracement of the recent correction.  The other indices are just below this key level.

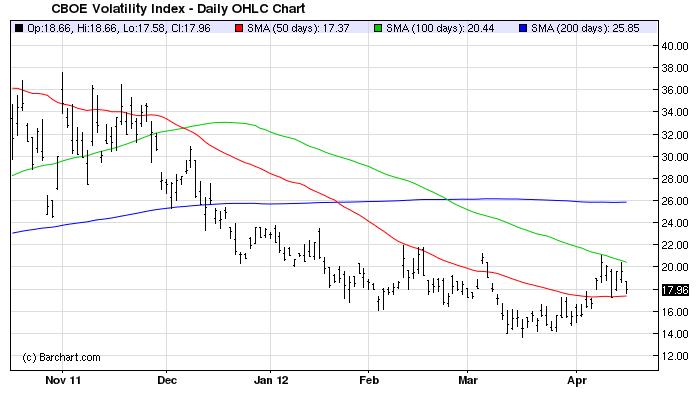
Also note the VIX has traded in a range with its 50-day m.a. as the  lower bound and its 100-day m.a. as the upper bound.   A break below the 50-day would further confirm the correction is coming to a close.

(click here if chart and table are not observable)

Posted in Equities | Tagged , , , | Leave a comment

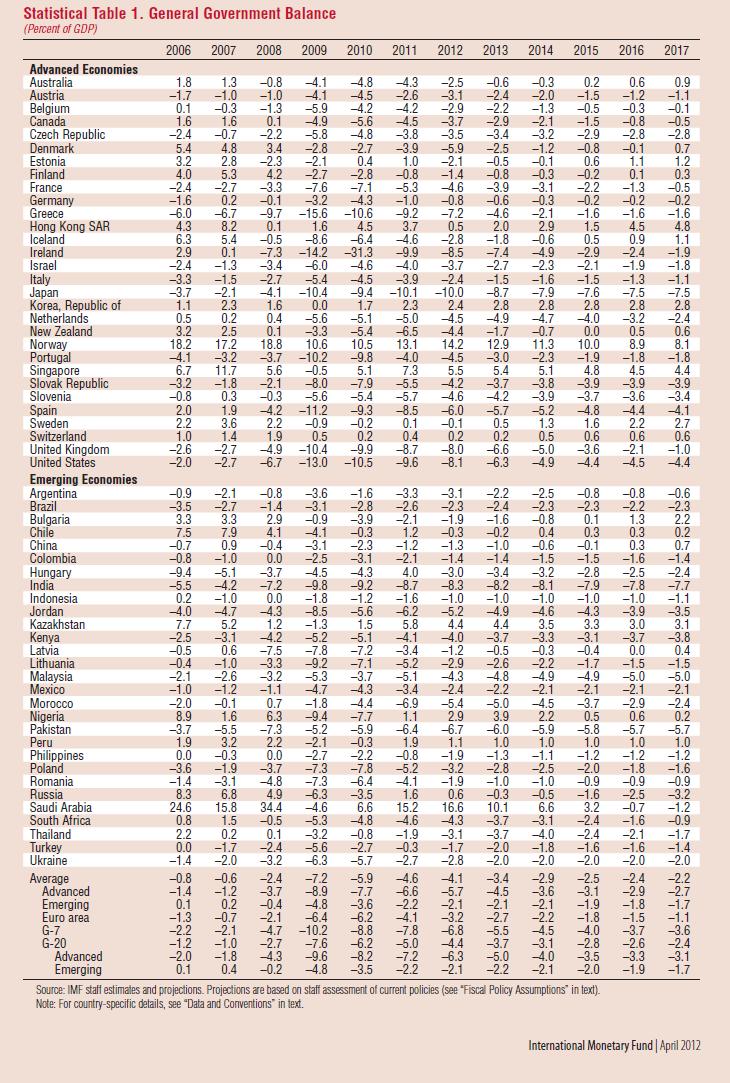
The Fiscal Health of Nations: General Govt Balance

The IMF is out with their Fiscal Monitor today.  Great stats.  Here is a comparison of the fiscal health of the world’s economies.

Contrast Norway and Saudi (both oil exporters) with, say,  the U.S. and Japan.  Italy doesn’t look so bad when compared to other nations, no?

The upshot? This is IMF’s analysis,

Short- and medium-term fiscal indicators. These continue to show a high degree of risk. Despite substantial fiscal consolidation efforts, cyclically adjusted deficits continue to be elevated in many advanced and some emerging economies, and in the short run debt ratios are still rising in many cases. Although conditions are in place for a stabilization of debt ratios in many advanced  economies over the next few years, in some cases countries have little margin for error in fiscal out turns or little space in current policies to absorb growth or interest rate shocks without the debt ratio’s continuing to rise. Debt ratios are decelerating in emerging economies, but remain higher than in the precrisis period. Overall, risks in this area remain broadly unchanged from six months
ago, with both deficits and debt ratios evolving more or less in line with expectations at that time, on average, in both advanced and emerging economies.

We’ll be posting more as we digest the document.  Stay tuned.

Click table to enlarge and for better resolution.

(click here if table is not observable)

Posted in Black Swan Watch, Budget Deficit, Economics, Eurozone Sovereign Spreads, Fiscal Policy, Sovereign Debt, Sovereign Risk | Tagged , , , , , , , , | 2 Comments

TR50: The 50 Most Innovative Companies (36-40)

Here are 36-40 of MIT’s Technology Review’s 50 Most Innovative Companies in 2011.  We’re posting in increments of five every few days as not to overwhelm you with info and required reading.

Click here for 1-5 of TR’s most innovative companies of 2011;
Click here for 6-10 of TR’s most innovative companies of 2011;
Click here for 11-15 of TR’s most innovative companies of 2011;
Click here for 16-20 of TR’s most innovative companies of 2011.
Click here for 21-25 of TR’s most innovative companies of 2011.
Click here for 26-30 of TR’s most innovative companies of 2011.
Click here for 31-35 of TR’s most innovative companies of 2011.

Technology Review uses the following criteria to choose the most innovative companies,

What is a TR50 company?   It is a business whose innovations force other businesses to alter their strategic course. TR50 members are nominated by Technology Review’s editors, who look for companies that over the last year have demonstrated original and valuable technology, are bringing that technology to market at a significant scale, and are clearly influencing their competitors.

36)  Samsung  (A005930:KSC)
Why:
Samsung is an increasingly major player in consumer electronics, from iPhone components to new phones, tablets, and OLED TVs; it was the world’s top seller of smart phones in 2011.
Key innovation:
Tightly integrated design and manufacturing processes result in clever, efficiently produced designs.

37)  Shell     (RDSA:LSE)
Why:
It has learned to exploit oil resources that were previously impractical to tap.
Key innovation:
Has drilled and started production at the world’s deepest offshore well.

38)  Siemens     (SIEX.N:Ger)
Why:
 Its cheaper turbines and installation techniques will make offshore wind plants more affordable.
Key innovation: 
Gearless turbines and streamlined manufacturing lower capital costs and improve reliability.

39)  Siluria   (private)
Why:
Its catalytic process is able to convert cheap and abundant natural gas into ethylene, a commodity chemical used to make plastic.
Key innovation:
Developed a family of catalysts that selectively cause methane to react to form ethylene.

40)  Skybox Imaging     (private)
Why:
Managing natural resources, planning humanitarian ­missions, and assessing construction projects could all become easier thanks to Skybox’s satellites, which will take more frequent images at lower cost.
Key innovation:
Its small satellites cost less to build and launch than traditional ones, and its automated analytic software makes it easier for customers to extract useful information.

TR – (1-5)
TR – (6-10)
TR – (11-15)
TR – (16-20)
TR – (21-25)
TR – (26-30)
TR – (31-35)

Posted in Innovation, Technology | Tagged , , , , , , , , , | Leave a comment

Spanish 10-year Closes Above 6 percent

(click here if chart and video are not observable)

Posted in Black Swan Watch, Euro, Eurozone Sovereign Spreads, PIIGS, Sovereign Debt, Sovereign Risk | Tagged , , | Leave a comment

Apple’s Wild Ride

It’s been a while since we’ve weighed in on Apple.  Well, at least a few weeks since our March 30th post as we wondered out loud if the stock needed to fill its March 14th gap open at $568.

The stock subsequently rocked after our post to make a new high at $644 on April 10th.  That’s what markets do.  They humble you and make it almost impossible to get both direction and timing right simultaneously.

Apple’s stock was down over 4 percent today and has come in almost 10 percent in the past week.  It is still up over 40 percent for the year and almost 60 percent since the latest leg of the rally began on November 23rd,  however.

Where to now?

Longer term,  higher, in our opinion,  but it has had a tremendous run, a lot of good news is priced, everyone that needs to own it probably does, and there are just too many bulls and not enough bears, in our opinion.

Next week’s earnings release will be particularly important to see if the new iPad has been the smash hit that the stock had been pricing.   We’re not as comfortable going into this earnings announcement as we have been in the past and think it’s healthy the stock is selling off prior to earnings, especially after such a huge run.

We did cite some of our anecdotal evidence of the lack of buzz around the release of the new iPad in our recent post,

We were in the local Apple store last Friday and were surprised by the lack of enthusiasm over the new iPad.   Also we noted a couple of customers asking for financing on their new purchases, which Apple does provide — no interest on for 6 months on purchases under $999 and 12 months for over purchases $999.   All anecdotal, but interesting, nonetheless.

If new iPad sales disappoint, we expect the stock to get hammered.   We’re trying to be patient and hoping the market gives us a better price to buy the stock and selling on the earnings release may provide that opportunity.

The chart illustrates the support and potential entry levels we’re watching.

(click here if chart is not observable)

Posted in Apple, Charts, Technical Analysis | Tagged , , , | 1 Comment

Inflation Convergence and Real Earnings

The BLS chart clearly illustrates the convergence of core (x/ food and energy) inflation and all items.   Core inflation is up 2.3 percent y/y, which is a little hot given its recent history.  Here’s the BLS commentary,

The index for all items less food and energy has risen 2.3 percent over the last 12 months. The index for shelter has risen 2.1 percent over the period. The apparel index has risen 4.9 percent, the medical care index has increased 3.5 percent, and the index for new vehicles has risen 2.5 percent.

Also note the decline in real earnings.   The inflation tax is eating away any nominal wage gains and is one reason why aggregate demand and this recovery is relatively weak, in our opinion.   The BLS notes in their Friday release,

Real average hourly earnings for all employees fell 0.1 percent from February 2012 to March 2012, seasonally adjusted, the U.S. Bureau of Labor Statistics reported today. A 0.2 percent increase in the average hourly earnings was more than offset by a 0.3 percent increase in the Consumer Price Index for All Urban Consumers (CPI-U).

Real average weekly earnings fell 0.4 percent over the month due to a 0.3 percent decline in the workweek combined with the decline in real average hourly earnings. Since reaching a peak in October 2010, real average weekly earnings has fallen 1.1 percent.

Real average hourly earnings fell 0.6 percent, seasonally adjusted, from March 2011 to March 2012. The decline in real average hourly earnings combined with a 0.6 percent increase in average weekly hours resulted in unchanged real average weekly earnings over this period.

(click here if charts are not observable)

Posted in Black Swan Watch, Economics, Employment, Inflation/Deflation, Monetary Policy | Tagged , , , , | Leave a comment

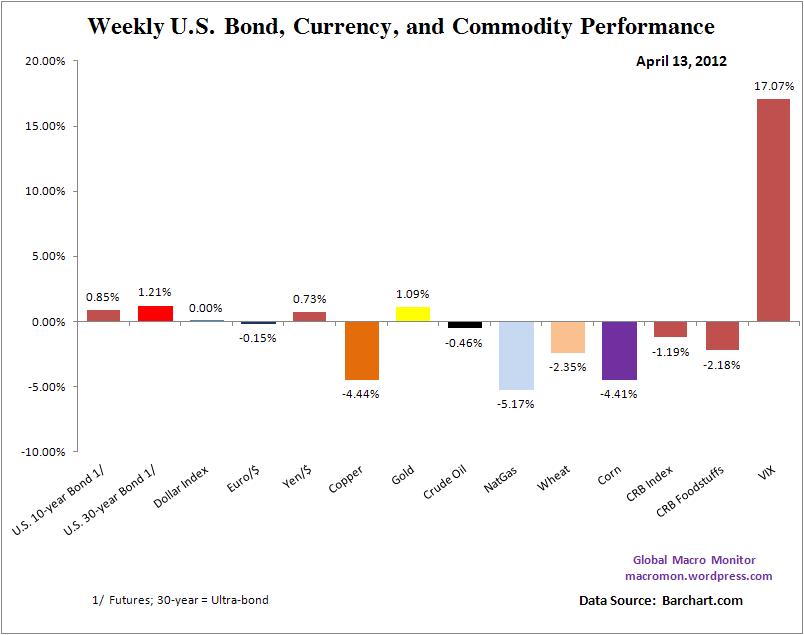
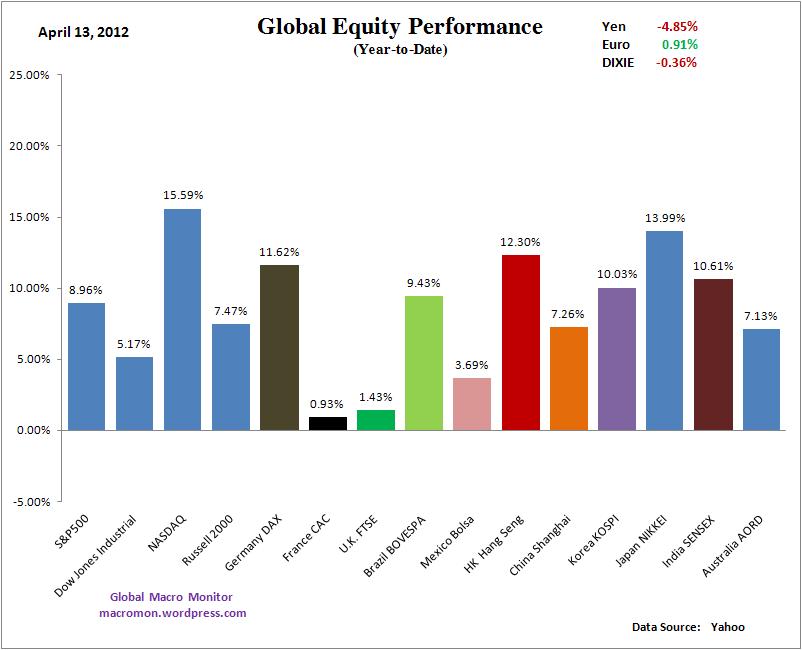
Week in Review

(click here if charts are not observable)

Posted in Week in Review | Tagged , , , , , , , , , | 1 Comment

Chanos on China

(click here if video is not observable)

Vodpod videos no longer available.
Chanos on China, posted with vodpod
Posted in Uncategorized | 2 Comments