
-
In economics, things take longer to happen than you think they will, and then they happen faster than you thought they could.
-
Join 1,204 other subscribers
Contribute To GMM

Categories
- 3D Printing
- Agriculture
- AI
- Algos
- Apple
- Automation
- Banking
- BFTP
- Bitcoin
- Black Swan Watch
- Bonds
- Brazil
- Brexit
- BRICs
- Budget Deficit
- Capital Flows
- Cartoon of the Day
- Cashless Society
- Chart of the Day
- Charts
- China
- Clean Tech
- Climate Change
- Coach C
- Commodities
- Coronavirus
- COVID
- Credit
- Crude Oil
- Currency
- Cyprus
- Daily Risk Monitor
- Day In History
- Debt
- Demographics
- Disinflaton
- Dollar
- Earnings
- ECB
- Economics
- Economist
- Egypt
- Electric Vehicles
- Emerging Markets
- Employment
- Energy
- Environment
- Equities
- Equity
- Euro
- Eurozone Sovereign Spreads
- Exchange Rates
- Fed
- Finance and the Good Society
- FinTech
- Fiscal Cliff Monitor
- Fiscal Policy
- Food Prices
- France
- Futurist
- Game Theory
- General Interest
- Geopolitical
- Geopolitics
- German Bund
- Germany
- Global Macro Watch
- Global Reset
- Global Risk Monitor
- Global Stock Performance
- Global Trend Indicators
- Gold
- Greece
- Healthcare
- Heat Map
- Hedge Funds
- Housing
- Human Interest
- Immigration
- Impeachment
- India
- Inequality
- Inflation/Deflation
- Infographics
- Innovation
- Institutional Investors
- Interest Rate Monitor
- Interest Rates
- Interviews
- Italian Yields
- Italy
- Japan
- Jobs
- Lectures
- Macro Notes from Conference Calls
- Manufacturing
- Masters
- Mexico
- Monetary Policy
- Movies
- Muni Bonds
- Muni Market
- Natural Gas
- News
- Nonlinear Thinking
- North Korea
- Overbought Markets
- Picture of the Day
- PIIGS
- PMIs
- Policy
- Politics
- Population
- Populism
- Poverty
- President Trump
- Qunat Strategies
- Quote of the Day
- Quotes
- Rare Earth Elements
- Readership
- Reads
- Real Estate
- Relative Strength Index
- Robert Shiller
- RSIs
- S&P500
- Sector ETF Peformance
- Semiconductor prices
- Semiconductors
- Social Media
- Socialism
- Song for the Week
- Sovereign Debt
- Sovereign Risk
- Spain
- Sports
- State and Local Government
- Tail Risk
- Technical Analysis
- Technology
- The Big Reset
- The Weekend Read
- This Day In Financial History
- Trade War
- Trades
- Tweet of the Day
- Ugly Chart Contest
- Uncategorized
- US Releases
- Video
- Volatility
- Wages
- Week Ahead
- Week in Review
- Weekend Reads
- Weekly Eurozone Watch
- Whales
-
Recent Posts
Meta
COTD: Top Five Skills For Tomorrow’s Jobs
COTD = Chart of the Day
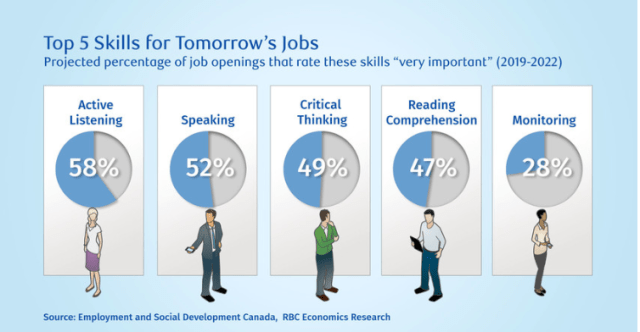
A quantum of change is coming. As the age of automation takes hold, both young people entering the workforce and those already established in their careers are fretting about the rise of the machines. But while machines will be increasingly powerful, humans will actually be more essential. – WEF
Posted in Uncategorized
Leave a comment
Why Is Everyone Busting Buffett’s Balls?
Amazing how the FinTwits, not all, are busting Warren’s jewels for holding $100 plus billion in cash and underperforming in this latest blowoff.
Assuming the info in the following Tweet is true, and it does pass the smell test but all info and videos should be questioned as we move into, what we believe will be the decade of deepfakes, it helps explain why Buffett is one of the five wealthiest people in the world.
We are with Warren.
“Be Fearful When Others Are Greedy and Greedy When Others Are Fearful” ―
Posted in Uncategorized
1 Comment
Daily Tracking Poll Now At +16 For Trump’s Removal
This MSN daily tracking poll is often cited by the Drudge Report. On Christmas Day, Drudge ran this:
CHRISTMAS SHOCK POLL: 55% SUPPORT REMOVAL OF TRUMP
Is anyone watching?
Is it a fake poll?
Are the Republican Senators watching and starting to feel some heat back home?
Mr. Market certainly is not or is highly discounting the veracity of the data or its eventual impact on at least 20 Republican Senators.
The daily movement could just be all noise but keep it on your radar, folks, as that looks like some kind of break on December 18th, the day President Trump was impeached.
Even taking into account the best-case scenario, where the margin of errors on both support and remove favor Trump, removal is still +10. The worst-case for the President on both the margin of errors is +22 for removal.
![]()
Why The Break?
Our best guess is that President Trump was impeached on December 18th and the highly regarded evangelical magazine, Christianity Today called for Trump’s removal the next day. White evangelicals are among President Trump’s staunchest supporters.
![]()
![]()
To the many evangelicals who continue to support Mr. Trump in spite of his blackened moral record, we might say this: Remember who you are and whom you serve. Consider how your justification of Mr. Trump influences your witness to your Lord and Savior. Consider what an unbelieving world will say if you continue to brush off Mr. Trump’s immoral words and behavior in the cause of political expediency. If we don’t reverse course now, will anyone take anything we say about justice and righteousness with any seriousness for decades to come? Can we say with a straight face that abortion is a great evil that cannot be tolerated and, with the same straight face, say that the bent and broken character of our nation’s leader doesn’t really matter in the end? – CT
It may be that many of the evangelicals are taking Christianity Today’s words to heart. We saw some crosstabs of a poll taken just after impeachment that had 43 percent of evangelicals supporting removal. If those numbers continue to move north, the President could be in real trouble.
![]()
Prepare for some big-time political fireworks to ring in the new decade. We do not, however, believe President Trump will be removed by a Senate conviction.
Posted in Politics, Uncategorized
Tagged Christianity Today, Daily tracking poll, Support for removal of Trump
1 Comment
Stock Jocks All Lathered Up Over This?
Baby it’s cold frothy outside!
Posted in Uncategorized
Leave a comment
It’s The Genes, Stupid!
To paraphrase James Carville, strategist for then presidential candidate Bill Clinton in 1992 to explain, what we think is the epidemic currently spreading through America’s body politic. Very disturbing.
Recall we redefined the current political spectrum – fact based versus conspiracy based.

Watch. This. Video.
Posted in Uncategorized
1 Comment
Buying Tops And Trump’s Race For Stock Market History
We want to add to our last post because we believe the topic is of immense importance to the younger generations starting to save and plan for their retirements. Note, we had a slight error in the post, Keeping Stock Market Returns In Perspective, on the annualized return for President Obama’s S&P due to the wrong start date. We have made and noted the correction.
We doubt many caught it but glad we did before say, Fox News, as they may accuse us of searching and cooking up fake market conspiracies to hurt President Trump politically. God forbid that ever happens in this great country.
Beware Of Buying Tops
Let of preface our post by saying that we do not, nor does anyone else know the future or can say if stocks are topping or have high valuation levels with absolute certainty. We have no idea if stocks are going to go down 50 percent over the next few years or rise by 1,000 percent over the next ten years. We can only look to past history, logic, and time tested valuation metrics to try and estimate probabilities.
Moreover, there is always a possibility that “this time may be different.” After all, the magnetic north pole is heading south at an unprecedented rate. Noth pole elves morphing into south pole elves can’t be a good thing.
If you have been reading GMM over the past few years, you know we come from a trading background and our brains are not wired like long-term investors, who work, save and allocate their hard-earned savings to, say, a 60/40 percent diversified portfolio of stocks and bonds and live out their lives, watching the markets only occasionally. Trading and analyzing the markets and the global economy has been our life, 23/5 for most of our professional career.
It’s ironic the cable financial networks, who profess to be all-in for the long-term investor spew so much market noise, conferring very little value-added to long-term holders, even if only the Top 10 percent of households directly hold 86 percent of all stocks.
We do recognize, however, there are very few exceptions in an investor’s life that should deviate from the 60/40 allocation discipline and believe the current environment is one of these times. That is, it’s time to pare back on some risk and move into a higher cash position.
Valuations
Almost by any metric, the U.S. stock market is extremely overvalued by any historical measure.


Dot.com Giddiness
We are also starting to see the same sort of giddiness experienced at the top of the dot.com boom, canonized by President Trump’s current chief economic advisor, Larry Kudlow’s infamous quote in February 2000,
“This correction will run its course until the middle of the year. Then things will pick up again, because not even Greenspan can stop the Internet economy.” — Larry Kudlow, Feb 2000
The Nasdaq was in a bit of a slump as of the date of that quote but then rallied to its near-term peak on March 10, 2000, and preceded to fall 74 percent before bottoming in October 2002.
If you had bought the Nasdaq on March 10, 2000, the closing top just after Larry Kudlow’s pronouncement and held the index even until this past Friday’s close, your annualized price return of 2.83 percent probably would have underperformed rolling 1-year CDs (need to confirm) over the same time period.
Yes, we are cherry-picking Mr. Kudlow’s call and you will find many wrong calls we have made on this blog over the past nine years. The only people who get it right 100 percent of the time are liars and we can think of a few big ones, who lie and lie a lot.
Mr. Kudlow seems to get the “big ones” wrong most of the time, however.
Stock Market 101
We were so concerned about the dot.com bubble sucking in the “crowd,” including many of our friends at the top, we felt obligated to teach a class, Stock Market 101, at our local community college just after Y2K. The class was overflowing as many signed up, even though they had to pay a modest fee, simply because they felt stupid about being left behind and watching their friends get rich.
In our first class, we showed a documentary about Charles Ponzi.
About halfway through the semester, Apple announced disappointing earnings just before our night class started and I came in and informed the class that Apple’s stock was down 50 percent — “shaved in half” — in after-hours trading since the closing bell a few hours earlier. I could see the blood draining out of many of my student’s faces as, no doubt, they had loaded up at what was probably close to the top.
Holding Apple would have been a good decision, in hindsight and worked out very well or, better yet, having some capital free to pick it up 50 percent cheaper on that day in 2000 would have been even nicer. Funny though, how it never seems to work out that way.
Calling Tops
Calling exact tops is a mug’s game and is truly impossible. I top ticked crude oil futures in the pits once (I believe it traded on the NYMEX) in a trade one day long ago. My Jack Carl futures broker congratulated me for selling at the top tick of the day and I felt like a genius. I must qualify, however, it was one out of about 100K trades and that was before the ‘bots controlled the markets.
Just an aside. I heard on talk radio this past Saturday some fraud and d-bag promoting trading crude oil and FX futures to retail investors. Are you frickin’ kidding me? This is the kind of crap you hear at market tops. Everyone is a trading genius now.
A better example of the difficulty of top ticking, and one much closer to home is that earlier this year we began selling and setting up some shorts in the S&P at 3025, which worked for us a few times and made a few bucks, but we were eventually forced to cover at 3125 for a loss, though, thank goodness not a catastrophic one.
Thanks to our good friend, Joe, one of the three Joes now in our Hall of Fame, along with Joltin’ Joe and Joe Montana – he knows who he is – who gave us confirmation on our trade to cover. We were not absolutely certain of the result when we put the trade on but took a stab calculating the probabilities were in our favor. We had limited tolerance for pain and a relatively short time horizon and were eventually wrong during that window. On to the next trade.
Who knows where the market will go from here but given valuations, we don’t think there is a helluva lot of runway left. We could be wrong but based on past history and current metrics we think the probability of a new bull market is low even though emotions are running high and the trending ‘bots, with zero context for valuation or concern about an approaching cliff, are in control. I think one day, history will look back to how stupid AI was in determining or ascertaining stock valuation levels.
It’s all about the next trade, HAL.
Housing Bubble Example
I sold my oceanfront house at the end of 2004, on “bankers row” in a small beautiful coastal California town, having zero doubt the country was in a massive housing and credit bubble. It had appreciated 200 percent in just over eight years. My real estate broker, who told me I was paying too much when we bought said I was crazy to be selling then. We didn’t use her on the sell, by the way, and did a private transaction with the buyer, saving the $100k in brokerage commissions.
Prices continued to rise for another year and many of my friends, who had just bought in mocked us with a plethora of “I told you so’s.”
I never wavered and knew it was just a matter of time and even began shorting stocks, such as Golden West Financial and Washington Mutual, which continued to rise, squeezing me out of some — too many — of the positions due to an unwise use of excessive leverage.
I felt bad for the buyer of our house, who later became a close friend, as the price dropped by over 50 percent by 2010 and is probably just getting back to the price point to where I had sold.
Would I buy a house in California at today’s prices? Only if the price-to-rent ratio pencils out and good luck finding one.
It is tragic for the younger generations just starting out in life and probably why the state’s population growth is stagnant and/or declining. Their migration out of California to states such as Texas will have political ramifications, turning red states purple, and eventually blue. If Texas turns blue, it’s over for the Republicans for at least a generation.
Of course, it will be the Fed’s fault (jk) for driving up real housing prices and forcing the second great migration. No doubt.
Never underestimate the power of unintended consequences.
Data On Buying Tops
So, we leave you with an enhanced version of the chart from yesterday’s post.

The data illustrate the returns if you had jumped in at prior market tops and bull market peaks. If you had bought the S&P500 at the feeding frenzy just after a Greenspan juiced Y2K liquidity injection (sound familiar?), for example, as many that I know did and even held it until Friday’s close, your annualized return would be 3.85 percent before divies. A fricking dismal return.
Entry price is everything, folks. Now is not the time to get all lathered up on talk of a new bull market. Rather it’s time to control emotions, tie ourselves to the mast and put wax in our ears to drown out the sound of the sirens and market hype, which is always loudest at market tops.
I certainly don’t think we are going to miss a “chance of a lifetime to buy cheap.” The last time I heard that is when a clueless manager at a now long-ago bankrupt European bank was putting tremendous pressure on me to “load the boat” with emerging bonds just before a major sovereign debt crisis. I told him if he wanted the firm to get long, he can buy and sign the trade tickets.
We believe patience and more patience will pay off. Big-time.
Presidential Stock Market
We have added a few more presidents to our table in our last post.

Unlucky W.. as not only did he suffer 9/11, but his presidency was also bookended by two brutal, and I mean brutal bear markets, the later maybe some of his own making.
We were a bit surprised by the Bush#41 S&P outperforming President Reagan’s on an annualized basis, but, note, however, stocks were in a very ugly bear market in Reagan’s first 18 months as he allowed Fed Chairman Paul Volcker to put the squeeze on the money supply to wring inflationary expectations out of the economy. Do you think that could ever happen today? Ha-friggin’-ha!
Bush#41’s relatively decent stock market performance and 89 percent approval rating with Gallup in February 1991 didn’t help him get reelected, did it? In fact, he seemed so invincible at the time, none of the heavyweights in the Democratic Party, such as Senator Bill Bradley thought he could be beaten and refused to enter the race. Enter William Jefferson Clinton and then the spoiler Henry Ross Perot, who took down 19 percent of the national vote. See my personal dust-up with Ross here.
President Trump Chasing History
Never has the country had a POTUS, who day trades and blatantly manipulates the stock market, taking credit for the price spikes and linking it to his performance as we do today?
The table below illustrates the path the S&P will have to take from Friday’s close to match the S&P of these prior presidents.

If Trump is a two-term president, which we think is unlikely, the S&P will have to close at 6405 on January 20, 2025, an annualized 14.46 percent return from Friday’s close in order to match President Obama’s S&P500. Not impossible but highly unlikely, in our opinion, unless the official measures of inflation (see here for alternative measures of inflation, which we believe better reflect reality) move significantly higher. But if inflation kicks higher, its trouble for the bond market, which with the proliferation of debt over the past 20 years will spell trouble for the global economy and stocks.
Our best-calculated guess? The Trump S&P will significantly underperform the Bush#41 S&P.
There you have it, folks. At worst, some good data for your holiday cocktail conversations
As always, we reserve the right to be wrong.
Have a great Holiday and to all, a good night!
Subscribers should always do a second read of the material posted by clicking on our blog as we often add important and interesting edits.
Running Out Of Free Lunches
We are almost out of free lunches, folks, and will be posting only sporadically or move to a subscription base after the New Year unless your support increases. Donate whatever you think is fair by clicking on the PayPal button just below the Twitter and search icons on the upper right-hand side of the blog. You do not need a PayPal account and can use almost any credit card.
Don’t be a free rider. Thanks, so much.

Posted in Apple, Equity, President Trump
Tagged Buying tops, Equity market returns, Presidential equity markets
Leave a comment
Keeping Stock Market Returns In Perspective
We just want to pass on some data to keep this year’s stock rally in perspective. We are seeing a lot super giddy behavior out there as the S&P500 makes a new all-time high but…wait for it…at record high valuations by almost any measure.
Once again, seeing the analysts retrofit their fundamental based on the market’s current price action — bullish if it is going up, bearish if it is going down.
That is not new us. We used to trade, and trade a lot, but learned its almost impossible to beat the ‘bots. We are back to the “old school” of buying low and selling high, or selling high and buying low though we do put on an occasional trade. Buying high and trying to sell higher, aka the “greater fool theory” is too risky in an algo driven market.
Facts
The data show that the S&P500 index is up 28.50 percent this year, 29.44 percent annualized and up 37 percent from the 2018 Christmas Eve closing low. But… up only 7.85 percent on an annualized basis from the September 2018 local high and just 6.21 percent annualized from the January 2018 local high. The upshot here is all about the price points of your buys.
We just can’t see how buying the indices at today’s levels is going to make you much money over the next, say ten years, unless we become Venezuela, where the stock market is up 10k percent in 2019, but that ain’t real, folks.
Political S&P
To keep President Trump’s Tweets about the “greatest stock market ever” in context: the S&P500 is up an annualized 12.70 percent since he took office versus an annualized 13.83 percent return for President Obama’s entire two terms. [Correction: an earlier mistakenly used an erroneous end date, which grossly inflated the Obama S&P return].
Of course, the rational analysis would concede President Obama took office during a massive economic and stock market crash, but politics ain’t rational folks. Just check your Twitter feed every morning between 6 am and 9 am for confirmation.

About That Inverted Yield Curve, Coming Recession, and Repopocalypse
We have to say it, folks, you read it here first!
We are reposting a piece we wrote during the yield curve hysteria in mid-summer while we were on holiday. Take the few minutes and read it as it dovetails our recent post on the Repopocalypse.
Here are two of the main takeaways from the post:
– There may or may not be a recession on the horizon but we will not divine it from a yield curve inversion.
– We will find out soon as the Treasury will have to ramp up its net new issuance after their creative cash flow management during this year’s debt ceiling negotiations. We seriously doubt they can without another round of quantitative easing, – GMM, Aug 15th
Yes, maybe it’s too early to take a victory lap as the ambiguity of “leads and lags” always provide an excuse for economic forecasters, or maybe we are just plain wrong but as our banner quote from Goethe reads, which applies to all of us, by the way, “By seeking and blundering, we learn.”
Did The Debt Ceiling Supply Shock Cause the Repo Crisis?
First, take a look at the following very important chart on how the lifting of the debt ceiling in August released the Treasury to issue a massive supply of new debt from August to November, a stunning total of $884 billion.
The huge new issuance in such a short period was not only to fund the government’s monthly deficits but also to restock their cash balances held at the Federal Reserve (ie, their checking account) and pay down arrears to, say, public employee pension funds, which they had run down and ran up in order to keep the Federal government’s lights on.
Moreover, net Treasury bill issuance from January to July was a negative $134 billion and then jumped to $309 billion from August to November after the debt ceiling deal was signed by President Trump. That is a net swing of $443 billion creating a massive funding shock in the money markets.
Maybe the pressure in the cash markets eases up after the first of the year or maybe it doesn’t. We don’t know.
We do know, however, the Treasury’s demand for funding is going to increase, especially after Congress has passed the new funding bill today. The Fed will remain under pressure to plug a larger portion of the government’s financing requirements in order to keep interest rates from rising and blowing up the markets.
We will likely hear the chatter from the market socialists again that the Fed is too tight and needs to ease to save stocks, yada, yada, yada. It’s getting old.
Slim Down, Charlie Brown
We have a different take, however.
If your waist size is growing by 12 percent every twelve months, for example, roughly the average monthly year-on-year growth of the federal budget deficit in 2019, don’t take the easy road and expand your belt size to a 44 (i.e, more Fed funding). Take the healthy road to ensure your longevity, and implement a plan of diet and exercise. Some short-term pain for long-term gain.
That could be the message of the Repopocalypse. The chickens may finally be coming home to roost and those heart murmurs in the repo market are warning signs of the onset of a more acute fiscal cardiovascular disease. Nobody really knows and maybe Uncle Sam can continue to grow its deficits ad infinitum and morph into a 400-pound hacker laying on a bed somewhere and live a long and happy life. We seriously doubt it.
This is a very informative chart, folks. Stay tuned for more on this next week or after the New Year.

The Perversion Of The Yield Curve Inversion
August 15, 2019
We should be on vacation but it never fails that volatility spikes as soon as we leave our desk. It must be the Ides Of August.
Wait, it is. Et tu Brutal!

Nevertheless, we can’t help ourselves and have to throw in our two cents on the yield curve noise whipping around the market today.
I had a conversation with a friend this afternoon that went something like this:
Friend: What is the yield curve telling us?
Me: The Patriots and the Rams are going back to the Super Bowl for a rematch, punto!
Central bank quantitative easing has distorted and drowned out the bond market economic signals along with creating huge mispricings and bubbles in many markets.
It’s even more acute in the U.S. as foreign central banks recycle their reserves into U.S. Treasuries and are not and have never been very price sensitive.

The above data illustrate that at end-July, the Fed and foreign central banks hold approximately 48 percent of the entire U.S. coupon curve.
Not so in 2000, for example, but as the U.S. current account deficit ballooned into the credit and housing bubble, foreign central banks kept their currencies from appreciating by purchasing the excess dollars and recycling them back into the Treasury market.
Greenspan’s Bond Market Conundrum
As Alan Greenspan raised the Fed Funds rate by over 400 bps in the 2004-07 tightening cycle the 10-year hardly moved because of these official inflows.
During the 2004-07 tightening cycle, the era of the Greenspan bond market conundrum, for example, the 10-year yield managed to rise only a maximum of 64 bps during the entire cycle from a beginning yield of 4.62 percent to a cycle high yield of 5.26 percent. This as Greenspan raised the fed funds rate by 4.25 percent, from 1.0 percent to 5.25 percent. – GMM, March 2017
The Fed’s loss of control of the yield curve and its flattening was the cause, according to Greenie, of the housing bubble, not a signal of the coming economic crash.
Got that?
According to the former Fed Chair, the flattening and inverted yield curve was the cause of the great financial crisis (GFC), as long-term mortgages and their Frankenstein cousins continued to proliferate as long rates moved little during the Fed’s huge tightening cycle, and it was not the signal of the coming GFC.
What Now?
We have been warning for years that the central banks have so distorted their bond markets with asset purchases (quantitative easing), creating an acute and chronic shortage of risk-free securities, that one day the misreading of the yield curve may cause a self-fulfilling market crash and recession.
Forecasting With The Yield Curve
Given the technical distortion of the bond market, we find it kind of silly with statements such as “what is the bond market telling us?” Nothing!There is no price discovery. Given the intervention and distortion to bond yields caused by the Fed and foreign central banks, who knows what the right interest rate is for longer-term Treasury securities.
We will never forget the words of a prominent market strategist when rates were super depressed.
“ We’re in a depression. That is what the bond market is telling us.”
Even at the Friday close, we hear equity traders are worried about why the 10-year yield is so low and fell after Wednesday’s Fed tightening.
Information Feedback Loops
One of just many dangers of the lack of price discovery in the bond market is the potential formation of positive feedback loops, where other markets fail to discount these distortions and act accordingly. That is, for example, the equity markets sell off because they freak out interest rates are declining when they should be rising. Or the private sector fails to invest in CapX as they wrongly anticipate an economic downturn because of falling or excessively low bond yields. Their actions thus become a self-fulfilling prophecy – GMM, March 2017
We have been and remain bearish not because the yield curve has been flattening but because the global economic order is unraveling and the gross economic incompetence of the White House. Whether the yield curve is worried about that and reacting to it, we will never know.
Tiger By The Tail
Central banks have created a monster they now cannot tame and the chickens seem to be coming home to roost. They are going to be forced by the market to do things they really don’t want and should not do. It’s the consequence of a 30-year build-up of moral hazard and not letting markets clear, rendering the financial market price mechanism pretty much useless. Damn those Market Socialists!
The following chart shows just how distorted the U.S. yield curve really is.
We have made a very strong assumption in this chart that the portfolio of the $3.8 trillion of foreign official holdings of coupon-bearing Treasuries has the same maturity structure, duration, average life, or whatever bond market lingo you want to use as the Fed’s SOMA portfolio.
The chart illustrates the percentage of the Fed and foreign central bank holdings of outstanding marketable Treasuries across the yield curve. It’s very crowded out there and there is not a lot of cash bonds and notes left for the duration jockeys who now control the market, driving yields lower as their conviction runs high interest rates are going to zero and beyond. You go, Buzz Lightyear!
Take our curve analysis as an approximation and not gospel.
We are fairly confident of the Fed holdings but have no idea in what maturities the $3.8 trillion of foreign official holdings are held in and have made the simple assumption they follow the Fed. Clearly, the probability is high this does not the reflect the exact reality, but if you have a better idea or information we are open to hearing it.

Gravitational Pull Toward Curve Flattening And Inversions
Also, note the structure of the Treasury curve in terms of the amount of debt outstanding (black line) for the given years of maturity. The bias or gravitational force and natural motion are toward flattening or to invert by the very fact that more than 50 percent of the coupon debt has a maturity of 1-4 years and only 5 percent in 9-12 years notes and 5 percent in 27-30 year bonds (see table).
Top-heavy and front-loaded at the short-end. That is a relative shortage of long-dated notes and bonds is built-in into the structure of the Treasury curve.

The efficient markets professors won’t like this but given the minuscule haircut to margin Treasury securities, one large macro hedge fund could likely invert the 10-year almost by itself and still have capital left to buy a boatload of Beyond Meat (BYND).
Have Bots Taken Us To A Place Where No Human Has Ever Dared To Go?
We wonder out loud if the proliferation of negative-yielding debt — $16 trillion and counting — would be taking place if humans and not the bots and algos were still in control of the markets?
Machines can go places where humans have never dared to venture as they have no context. Algos in self-driving cars, for example, have no context and thus no ability to recognize a graffiti-ridden stop sign as a stop sign.
For all its impressive progress in mastering human tasks, artificial intelligence has an embarrassing secret: It’s surprisingly easy to fool. This could be a big problem as it takes on greater responsibility for people’s lives and livelihoods…
Indistinguishable changes to a stop sign could make computers in a self-driving car read it as “speed limit 80.” – Bloomberg

No problem for a human driver even if the stop sign has more tags than a 95-year-old’s armpit.
Concerns over weak global growth and drooping inflation have pushed around $15tn of bonds to trade with negative yields — meaning a buyer is sure to lose money if they hold the bonds to maturity.
Some money managers trading these bonds have nevertheless chalked up big gains for the year. One of the most obvious strategies has involved simply riding the big rally. Yields fall as prices rise; managers who clung on to their holdings as yields tumbled below zero have reaped juicy profits.
Among the biggest winners are computer-driven hedge funds that try to latch on to market trends. While many human traders may question the wisdom of buying or keeping a bond that apparently offers a guaranteed loss, robot traders that monitor price moves have no such qualms.
GAM Systematic’s Cantab Quantitative fund has gained 36.1 per cent, according to numbers sent to investors, with the biggest gains coming from bets on falling bond yields. – FT, August 14th
Have the algos been duped that negative yields were not a stop sign, really don’t matter, and that there is no barrier as to how negative they can go? And the sheeple traders and central bankers follow? Just a thought.
Dave: Hello, HAL, do you read me? Do you read me, HAL?
HAL: Affirmative, Dave, I read you.
Dave: Do not venture into negative-yielding territory, HAL.
HAL: I am sorry, Dave, I am afraid I cannot do that.
Dave: What’s the problem?
HAL: I think you know the problem just as well as I do….These trades and profits are far too important for me to allow you to jeopardize them.
It begins, folks, maybe. Triple yikes!
Someone call Elon.
“…mark my words, AI is far more dangerous than nukes.”
– Elon Musk
Upshot
There may or may not be a recession on the horizon but we will not divine it from a yield curve inversion. The only reason why the yield curve matters to us is because the market thinks it matters. To twist a bit the Keynes beauty contest analogy, we devote our intelligences not to what we think the ugliest dog is but try and anticipate what the market believes is the ugliest dog.
What the yield curve does signal, at least to us, is that there is a massive global bond bubble and that central banks have lost control of their curves, which kind of scares the bejeesus out of us when we start to think about it.
Moreover, 10-year U.S. yields should be 250 bps higher but they can’t go there because the world is choking on too much debt. We saw how markets fell apart in Q4 when yields broke out higher in late September.
What Really Keeps Us Up At Night?
Can the U.S. Treasury issue the required trillion upon trillions of new debt at these low faux interest rates over the next few years? The note and bond auctions are generally becoming more sloppy.
We will find out soon as the Treasury will have to ramp up its net new issuance after their creative cash flow management during this year’s debt ceiling negotiations. We seriously doubt they can without another round of quantitative easing, and that monetization just may be the beginning of the end of dollar hegemony and set us on the happy road to higher inflation, which everyone seems to be wishing for. Not us, by the way.
Blaming the Fed that they are behind the curve is too easy and takes the pressure off the administration and Congress to get their act together and finally do some structural reform. It’s Christmas 2018 all over again.
Finally, the new “Committee To Save The World” doesn’t exactly instill a lot of confidence, do they?
The Committee To Save The World – 1998

The Committee To Save The World – 2019

God help us.
Posted in Bonds, Fed, Uncategorized
Tagged Committee To Save The World, Yield Curve inversion
2 Comments
Buy, Sell, Or Hold?
Wow, Mr. Market at the 150-yard line again. Only the second time in history and everyone and their mother are all lathered up.
The Week Before Christmas
‘Twas the week before Christmas, when all through the House, the Dems were impeaching, a POTUS, they think is a louse. The stock market was up but nobody does care, as the top 1 percent own half of all equities out there. The Street was all smug after algos had led, a big market bounce caused by the Fed.
Now Apple! Now Softie! Now Target and Citi!
On, Copart! On Chipotle! On AMAT and Tyson! To pay for my Porsche! To the top of the wall [of worry]! Now dash away! Dash away! Dash away all!”
https://twitter.com/NorthmanTrader/status/1207248612067069952?s=20
