The S&P500 could not hold the 50-day moving average today, setting, yet again, a nice bull trap to hang out the MoMo crowd. Seeing a lot more traps, both bull and bear, these days. It is the result of the increasing dominance of machine trading. They are above our human emotions. Smug, don’t you think?
We wrote in our recent Week In Review post,
- S&P500 generated a very rare back-to-back bear trap (broke and closed above 200-day) days on Thursday and Friday. It has occured only 0.76% of the trading days since 1962
What a market.
Back-to-back bear traps followed by today’s bull trap. Three traps, three days in a row.
Bull Traps In This Correction
Since the March 2009 low in the S&P500, there have only been 128 bull traps, as defined by the cash S&P piercing the 50-day moving average in an intraday move only to close back through it. This example of a bull trap has occurred only 5.58 percent of the 2,293 (corrected) trading days since the 2009 low.
During the correction that began on January 29th, there have already been 8 bull traps, or 11.59 percent of the the 69 trading days.
Pennant Forming
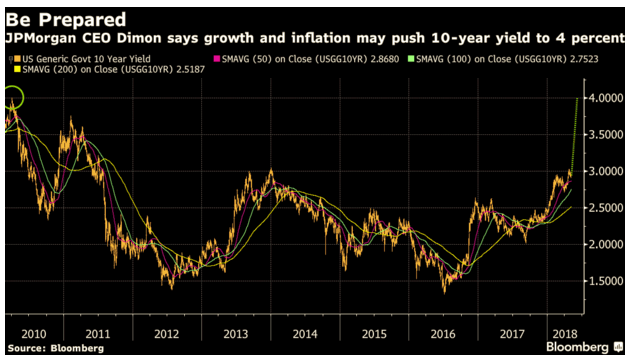
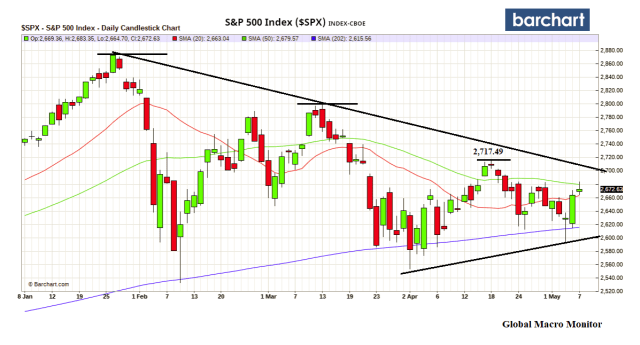
It looks like a pennant is forming here, which is bullish if you ignore rising interest rates and oil prices, tighter money, rising inflation, and geopolitics. Macro traders cannot adhere solely to technical patterns but must consider them. Just another arrow in the global quiver.
Upshot
We believe most of the positive earnings and macro news are pretty much priced, and the markets have not fully discounted the risk of a negative outcome in any one of the macro swans that are looming and flying around out there. The economic locomotive is running near full speed and close to overheating, and unless policymakers create a new economic bullet train, this seems to be “as good as it gets.”
Moreover, we find it ridiculous the market catapults 100 S&P points in a few days because the Oracle of Omaha is accumulating Apple shares. Mr. Market does what Mr. Market does, listens to who it listens to.
Warren, Charlie, and Bill dropped a big duce on Bitcoin over the weekend, and though it did retreat from $10k, the sell-off was tame for Bitcoin standards.
Warren, a Hall of Famer, in our book, but doesn’t seem to fair so well when he and Charlie venture into large cap tech, however.
IBM was always a curiosity for Buffett followers. He’d spent years telling them that technology companies were outside his area of expertise then plowed more than $10 billion into the company in 2011.
Flawed Valuation
Back then, Buffett’s investment was a huge vote of confidence for the aging computer-services firm and its leadership. But things soon went south. IBM struggled with declining sales, forcing Buffett to defend the pick. For awhile, he even added some to his holdings.
Last year, however, he’d had enough. Just before Berkshire’s annual meeting in May, he acknowledged that his valuation had been flawed and that he’d begun to cut back on the investment. – Bloomberg, February 2018
Fan Of AAPL Innovation, Not APPL Financial Engineering
We were Apple’s biggest fan early in the decade. See here.
Can’t buy the stock here, however, because of the following chart and until the dark cloud of our trade spat with China looks to be clearing. May trade it but taking it down as a medium-term investment (1-12 months) is a big no no in our house.
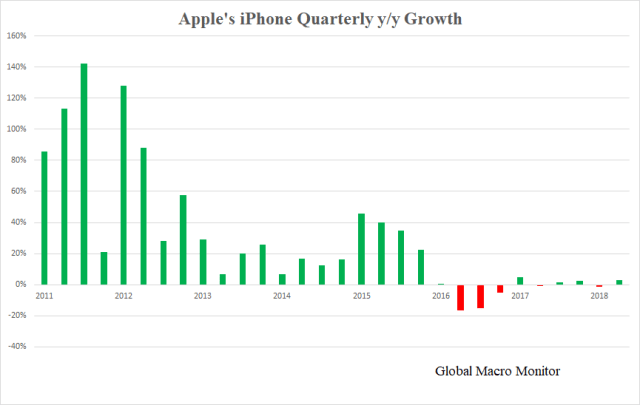
The Oracle is probably going to be right long-term on Apple.
Sooner or later the company will come up with another world changing gadget. Until then, financial engineering just doesn’t tickle our fancy nor does it help Main Street or the economy. Of course, we will always entertain a trading opportunity.
Moreover, Apple has become just too large. The company’s annual revenues exceed the GDPs of Greece and Peru, and 75 percent of the world’s country GDPs.
Senior management thus has a huge revenue nut to cover, and must wake up the first day of every year and begin their quest to sell enough electronic gadgets in size to surpass the GDP of Ireland. That is a big, big, nut.
Apple is trying to increase recurring revenues. Services now account for about 14 percent of total revenues, or $33 billion over the past four quarters. Not there yet for an almost $1 trillion market cap, however, and, at the end of the day, Apple is still an iPhone company with flat to negative unit sales growth over the past two years.
What The Stock Bulls Need Now, And Soon
Enough with Apple.
It is imperative the S&P bulls: 1) hold the 20-day moving average at 2,663.04; 2) bust and close above the 50-day at 2,679.56. The slope of the 50-day is now negative and in a downtrend, which, on its own, is bearish, and 3) take out, close , and stay above the recent high at 2,717.49
Relentless Pounding Of The 200-day Moving Average
A lower swing high, that is below 2.717, will almost seal the fate the bears will take out the 200-day sometime very soon. They have been relentlessly pounding the 200-day during this correction.
In bull markets, the 200-day may be tested maybe once or twice over a short period then bounce big and continue the uptrend. Not test it every third day as it seems to be doing recently.
Some believe what doesn’t kill you makes you stronger.
Personal character? Absolutely.
Technical support levels? We don’t think so.
Eventually, the front line will crack, even if it is the robots defending it. And, what if they decide to all retreat at the same time and go offer only, as they did in the flash crash?
When contemplating the constant hammering of the S&P500’s 200-day moving average, think the financial equivalent of Chairman Mao’s “human wave theory.”
“overwhelm the defenders by the sheer weight of numbers” – Wikipedia
Stay frosty, Oscar Mike.