Religious suffering is, at one and the same time, the expression of real suffering and a protest against real suffering. Religion is the sigh of the oppressed creature, the heart of a heartless world, and the soul of soulless conditions. It is the opium of the people. – Karl Marx, A Contribution to the Critique of Hegel’s Philosophy of Right
Social media is becoming the new whipping boy and poster child for all that ills our culture and contributing to its decline.
We added our two cents in a recent post, Why Google Is A Short,
…social media probably generates negative productivity. We read some time ago the average American spends 40 minutes per day playing Farmville. How does planting virtual corn add to the GDP?
Though we are more ambivalent about Google, Facebook is doing some severe psychological damage to an entire generation, including my 15-year daughter. They spend much of their time competing with trophy photos loaded up on Instagram. Never gonna win that game, which leads to increased anxiety and depression for an entire generation.
The Google Short
That brings us to the Google (we are old school and can’t bring ourselves to call it Alphabet) short.
Imagine when a politician has his/her epiphany that all those porn searches they have done over the years on Google are stored somewhere and could be hacked and released to the public? That will ignite a prairie fire of potential legislation, which will spread faster than you can say SNAP. – GMM, Apr 24th
Our Friend Weighs In
We received this email from a very close friend yesterday,
Yesterday I downloaded the data Facebook has stored on me. 407 pages including every message I sent, every like, every picture, on and on. Below I pasted just one of these pages, the list of advertisers who requested all my data. I know nothing about most of these companies and to my knowledge do not use them. Just saying.
Psychological Damage On Children
In 2013, one of my daughters was seeing a therapist to help her work through the psychological complications of her just diagnosed epilepsy. She is in good company – Julius Caesar and Chief Justice Roberts.
The therapist had all the right credentials from all the right institutions, Yale grad, Ph.D. from Stanford. Until I asked her about the damage smartphones are doing to children.
She began to justify, almost saying they were good for kids.
The takeaway quote I recall, she had just attended a seminar and smartphones are good for children, “it is changing their brains.”
No shit. I fired her on the spot.
Moreover, I can’t tell you how many conversations I have had with friends who have trouble with their children’s use of social media.
Nefarious Activity On Social Media
By the way, I came out of that meeting with my daughter’s therapist to find my trading account had lost several thousand dollars as some dickhead ‘bots hacked into AP’s twitter account posting the White House had been bombed and President Obama was injured. Stocks plunged and I was sold out of my long postions by deep out-of-the-money stops.
The FBI and SEC are to launch investigations after more than £90bn was temporarily wiped off the US stock market when hackers broke into the Twitter account of the Associated Press and announced that two bombs had exploded at the White House, injuring Barack Obama. – The Telegraph
I couldn’t figure out what happened to my account as the S&P was right around where it was than before I entered the meeting. Until I looked at the chart.
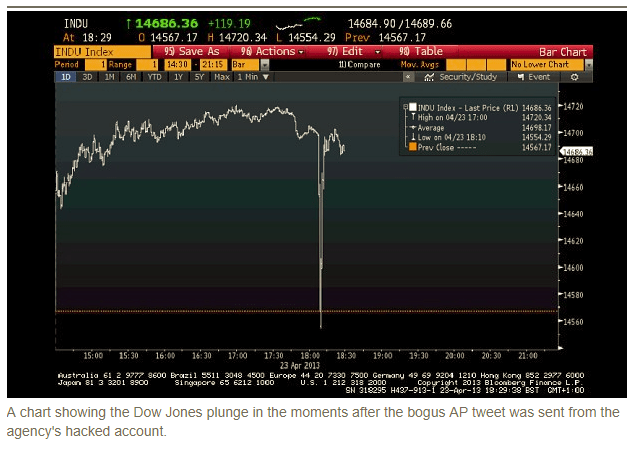
Bastard ‘bots! Hey Twitter can I get my money for your f$@k-up?
We are not as negative on Twitter as much as Facebook but this is just another example of why the government has to take a closer look at social media. Furthermore, and more important, many believe that even the fate of democracy hinges on the future of spam, clickbait, and fake news.
Noah At Bloomberg Opines
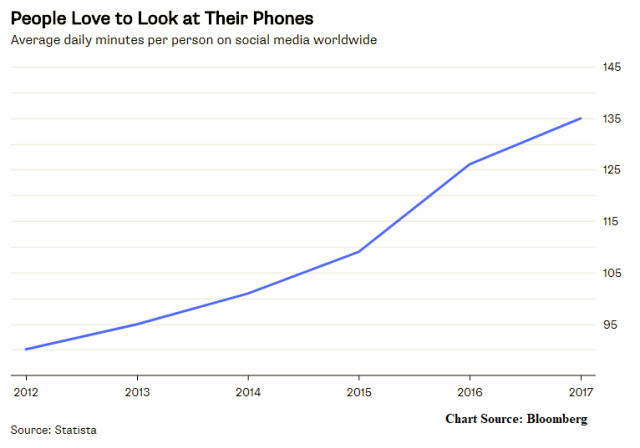
The great Noah Smith of Bloomberg penned a must-read last month, Social Media Looks Like the New Opiate of the Masses, with the subtitle, Researchers have found some troubling parallels with addictive drugs.
Here are the non-wonkish money quotes:
Upshot
Who in their right mind would have thought five years ago we would someday be comparing Facebook use to tobacco addiction?
We are less sanguine than Noah on the future of our social media economy.
More so, not because of the addiction thing, but because of privacy issues. The behemoths will surely adapt their business models to survive. Will you pay $120 per year for Facebook? There is no free lunch, right?
That brings us to investing.
Are the toothless F$%Gs out of the woods? Hardly. It is only two outs in the top of first, in our opinion. The blowback is just getting started.
For the above reasons, a long-term sword of Damocles is hanging over the market and these companies, in particular. Their stocks, which are heavyweights in the indices, will experience fits of volcanic eruptions of existential crises to periods of calm and euphoria. In other words, prepare for a Key Stone Cops chase scene market.
Is Our Social Media Economy Good For The Economy
This is one issue where the president is right-freaking-on. Building a ballroom trumps building a chatroom. It obviously creates real wealth and generates more income.
Think back when GM and Ford dominated the economy. How many secondary jobs were created when a car rolled off the assembly line? Gas stations, tire shops, mechanics, smog inspectors, auto body painters?
They still do with even with imported BMWs (man, German cars are so expensive to repair) but the input multiplier is not as great as it was when the U.S dominated auto manufacturing.
We won’t fix our economic problems by reducing trade, especially with tariffs, but by making auto workers more productive with both human and physical capital investments. Maybe 3-D printed cars will eventually rule the day?
This type of manufacturing is more likely (cannot say with certainty, we have not done the research) to have a much greater jobs multiplier than the social media economy, and is more egalitarian in income and wealth distribution.
We concede the point that the social media jobs multiplier is not zero. For example, vendors of, say, banana flavored condoms can sell their junk over these platforms. But, come on, man!
The Bigs And AI
The one big caveat to our view is that the Facebooks and Googles are big spenders and on the cutting edge of artificial intelligence (AI), which is subsidized by their advertising revenues. Someday they may be big players in the AI/robotic manufacturing displacement that is already here and only surely to accelerate.
But will they have enough time? Uhh……..probably.
Ready for another Rorschach Test? Nah, we won’t torture you again.
Check this video out.
An analogy of what happens to surfers riding a big wave bull market and become too complacent. Wipeout!
They will be fortunate to escape with just a broken back. Can you say bond market?
By the way, my late brother broke his neck body surfing the Wedge in Newport Beach. My younger brother lives less than a few kilometers from Mavericks.
November 8, 2017 – Nazaré, Portugal Professional Big Wave Surfer, Andrew Cotton (UK), suffered a horrific wipeout during a Big Wave Session in Praia do Norte in Portugal, and was taken to the Hospital, after hurting his back. This exclusive footage shows the wave and the moment Cotton is catapulted into the air, and the all aftermath until he is moved to the Ambulance.
Cotton caught a monster wave, and successfully rode it till the end. When the wave closed out, Cotton jumped from his board and was then projected into the air several meters high by the huge white water explosion. After the huge wipeout and after being held down underwater for many seconds, Cotton was hit by another wave on the head before being rescued by his partner professional Big Wave Surfer, Hugo Vau. During the rescue operation, the jetski was flipped by another wave, and both Cotton and Vau had to swim to the beach.
A Medical Team on site promptly attended Andrew Cotton soon as he got to the beach. At this moment cotty was with pain on his back, so they immobilised him as a precautionary measure. He was then taken by Ambulance a few minutes later to the Hospital.
According to filmmaker Pedro Miranda who shot this video, “he broke his back but is stable and recovering good and has no further damage, except being away from the water for maybe 3 months. We all wish him the best and a fast recovery, this was by far the gnarliest wipeout of the Season, stoked that Cotty is recovering”, the filmer said.
Also, Cotton posted a little update from his hospital bed later at night: “Thanks to everyone who helped this morning,” he said. “Everyone was really calm, you guys really saved my back, which unfortunately is broken but definitely could be worse, so thank you.” Andrew Cotton is Britain’s most notorious Big Wave Surfer, one of Nazaré’s first pioneers along with his team mate Garrett McNamara.
Cotton has been consistently surfing giant waves in Nazaré since the beginning 6-7 years ago and was previously nominated for the WSL Big Wave Awards with a wave caught in Nazaré. *
(Update 2018.04.05 – This video has been nominated for “Wipeout of the Year” in the 2017/18 WSL Big Wave Awards) * (Update 2018.04.28 – This video won the “Wipeout of the Year” Award in the 2017/18 WSL Big Wave Awards)
The punk employment data makes us think the economy is running out of labor. Very similar to the dynamics in the housing market.
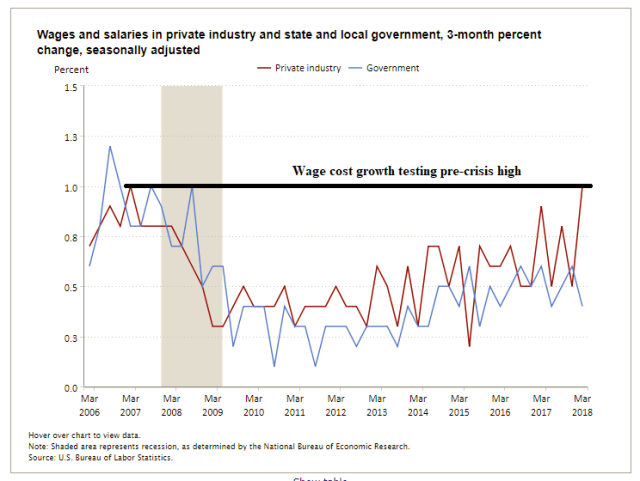
The markets are lathered up about the annual moderate average hourly earnings growth of 2.6 percent. The better measure is the wage component of the Employment Cost Index (ECI), which is growing close to 4 percent on annualized basis, approaching pre-crisis highs.
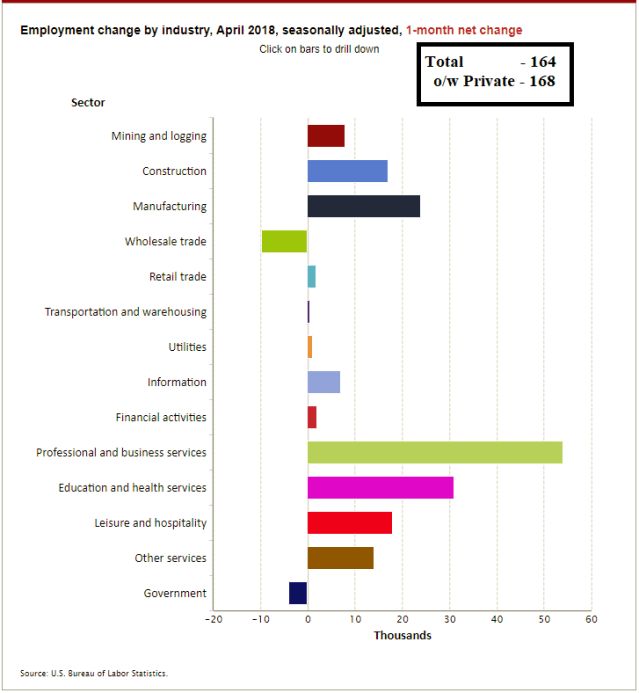
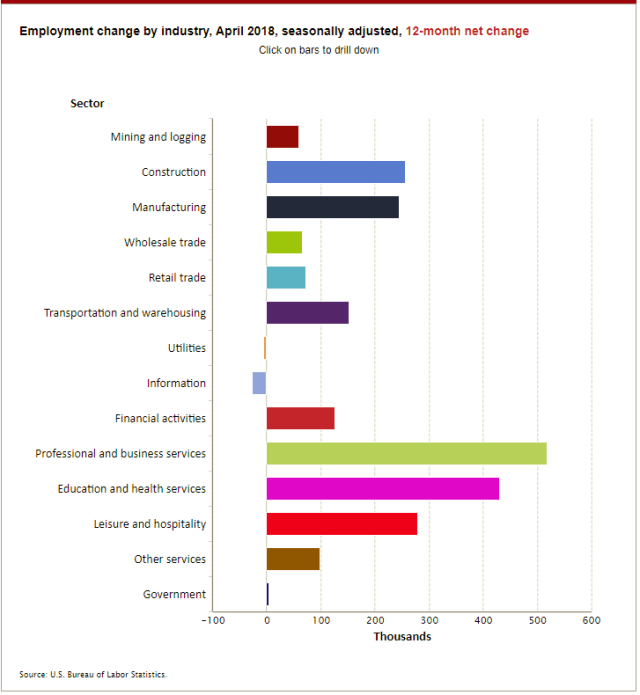
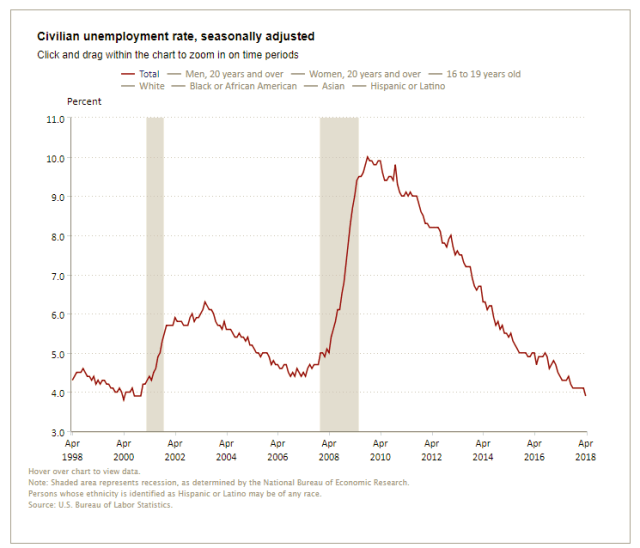
Total nonfarm payroll employment increased by 164,000 in April, and the unemployment rate edged down to 3.9 percent, the U.S. Bureau of Labor Statistics reported today. Job gains occurred in professional and business services, manufacturing, health care, and mining.
…The average workweek for all employees on private nonfarm payrolls was unchanged at 34.5 hours in April. In manufacturing, the workweek increased by 0.2 hour to 41.1 hours, while overtime edged up by 0.1 hour to 3.7 hours. The average workweek for production and nonsupervisory employees on private nonfarm payrolls increased by 0.1 hour to 33.8 hours. (See tables B-2 and B-7.)
In April, average hourly earnings for all employees on private nonfarm payrolls rose by 4 cents to $26.84. Over the year, average hourly earnings have increased by 67 cents, or 2.6 percent. Average hourly earnings of private-sector production and nonsupervisory employees increased by 5 cents to $22.51 in April. (See tables B-3 and B-8.) – BLS

Better Measure of Wage Inflation
We heavily discount the the average hourly earnings in the employment release for several reasons and believe the ECI is a better measure of wage pressures. Note the ECI wage index is running about 3.7 percent on annualized basis and is now back at pre-crisis highs.
The table average hourly wage from today’s employment report is indicative of our suspicions about wage data. The utility industry is the highest paic industry? Come on, man!
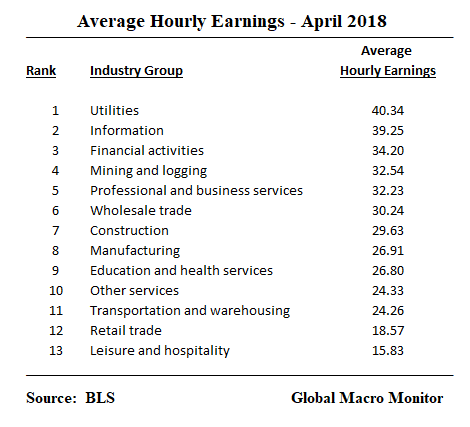
The economic signals in this data are, no doubt, being lost in aggregation and averaging. And who knows how much the BLS massages the data.
Hedonic Adjustments To Wages?
This raises an interesting question. If the BLS makes hedonic adjustments to consumer prices based on changes in quality, shouldn’t they adjust wages based on productivity?
Clayton Kershaw, for example, s the highest paid baseball player with an annual salary of $33 million. The quality of Kershaw’s performance has declined considerably in 2018. as he off to only a 1-4 win/loss record? Shouldn’t the BLS adjust down his salary?
We wonder if hedonic adjustments are made for tickets for sporting events if the home team tanks from first to last place for year-to-year?
Though an extreme example it illustrates why the quality of government data should be suspect, thought through, inspected and discounted to some extent.
Sorry to piss on the parade, folks.
The dude can still bring it.
Down on the Corner. Classic. Epic. Lit!
Must view. Helps to better understand the fraying global realpolitik.
I am with John Fogerty and Creedence on this one,
I see a bad moon a-rising
I see trouble on the wayI hear the voice of rage and ruin
Money quote from video:
“That’s why what happens in Budapest, is unlikely to stay in Budapest.”
eMac better win the day, folks.
Few were surprised when Viktor Orbán and his nationalist Fidesz party swept to their third consecutive victory in Hungary’s election on April 8. But understanding Orbán’s success requires examining his political formula, which has influenced right-wing populists across Europe and has been echoed by many US Republicans, including President Donald Trump.
Keep up to date with PS films by subscribing to our YouTube channel: https://www.youtube.com/project-syndi…
There has been a huge drain of liquidity from the U.S. Treasury market over the past few years, and may signal a structural change to how the United States finances budget deficits.
The government will always find a way to fund itself and will siphon and drain liquidity and buying power from other asset markets. During the past 20 years, the Treasury market has been dominated by foreign and official sector buyers That is changing and may explain why the stock market is trading so poorly even with, what appears, to be stellar earnings.
Read on.
Determination Of The 10-year Yield
There will be many posts to come on this topic as we believe it is the most critical issue investors need to grapple with and get right over the next year.
What is the right price for the U.S. 10-year Treasury yield?
Moreover, how is the yield determined, and how has it been distorted over the past 20 years by central banks, both foreign and the Federal Reserve?
What does the future hold?
Capital Flows
We agree that inflation, growth expectations, and other fundamental factors weigh heavily on determining bond yields but we alway maintain, first, and foremost,
“asset prices are always and everywhere determined by capital flows.”
New Issuance, Foreign, and Fed Flows Into The Treasury Market
The following table illustrates the new issuance of marketable Treasury securities held by the public and net purchases by foreign investors, including central banks, and the Federal Reserve over various periods.
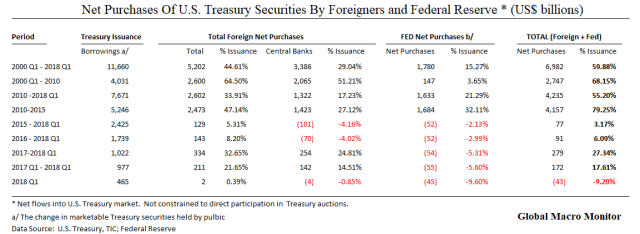
The data show since the beginning of the century, foreign investors, mainly central banks, and the Federal Reserve net purchase of Treasury securities, those which trade in the secondary market, is equivalent to 60 percent of all new marketable debt issued by the Treasury since 2000.
We do not suggest all these purchases were made directly in Treasury auctions, though many of the foreign buys certainly were.
From 2000-2010, foreign central banks were recycling their massive build of foreign exchange reserves back into the Treasury market. During this period, the foreign central banks bought the equivalent of 50 percent of the new issuance. Add foreign private investors and the Fed’s primary open market operations, and the total equated to 70 percent of the debt increase over the period.
Alan Greenspan blames the foreign inflows into the Treasury market during this period for Fed losing control of the yield curve, a major factor and cause of the housing bubble, and not excessively loose monetary policy.
Given the decoupling of monetary policy from long-term mortgage rates, accelerating the path of monetary tightening that the Fed pursued in 2004-2005 could not have “prevented” the housing bubble. – Alan Greenspan, March 2009
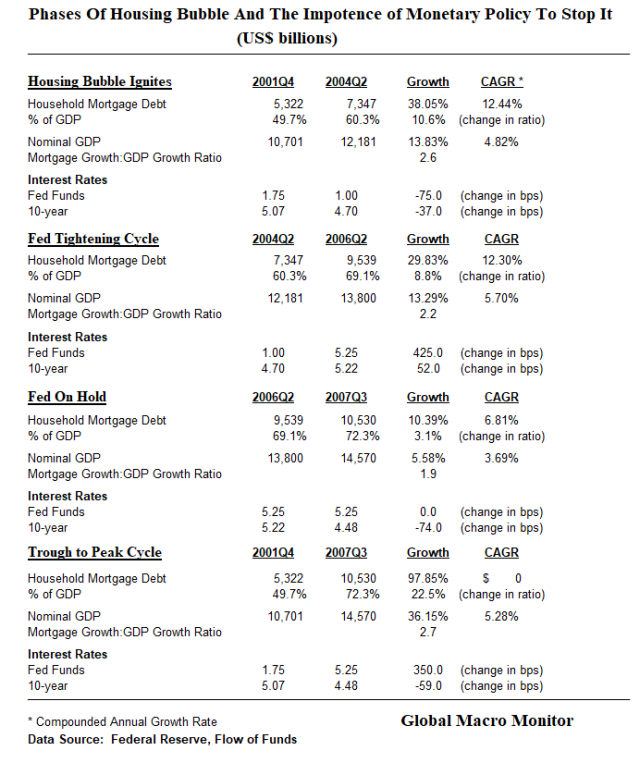
Greenspan raised the Fed Funds rate 425 bps from June 2004 to June 2006 and the 10-year barely budged, rising only 52 bps. More on this later.
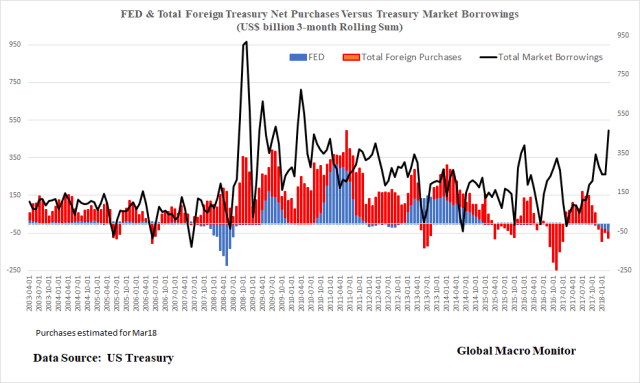
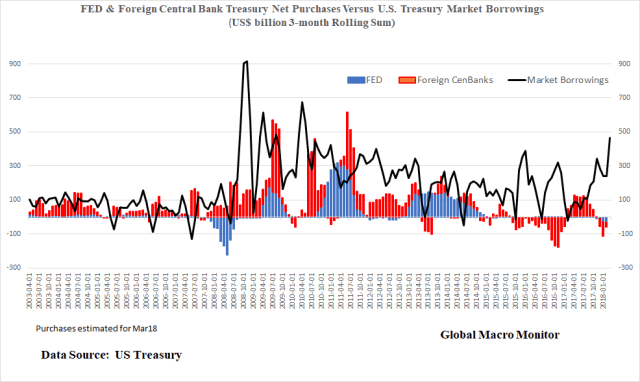
During the Fed’s QE period, 2010-2015, foreign investors and the Fed took down the equivalent of 80 percent of the new debt issuance.
The charts also illustrate that for several of the 3-month rolling periods, net purchases were significantly higher than 100 percent of new supply, distorting not only the 10-year yield, but the valuation of all other asset prices.
Interest rate repression also cause economic distortions, which have political consequences. Most notably, wealth and income disparities.
Rapid Technical Deterioration
Since 2015, flows into the Treasury market have deteriorated markedly, and the timing could not be worse as new Treasury issuance is ballooning with skyrocketing budget deficits.
During the past twelve months, for example, net foreign and Fed flows collapsed to just 17.6 percent of new borrowings. Even worse, the net flows were negative (we estimated March international flows) during the first quarter during a record new issuance of Treasury securities of almost $500 billion.
Can we say, “Gulp”?
Stock Of Outstanding Treasury Securities
Given the rapidly deteriorating technicals and fundamentals — rising inflation –, we believe the 10-year yield should be and will be much higher sometime soon.
That is we are looking for a “super spike” in bond yields, and expect the 10-year to finish the year between 4-5 percent. The term premium, which has been repressed due to all of the above, should begin to normalize.
Why is it taking so long?
Aside from the record shorts and natural inertia of markets, the stock of Treasury securities remains favorable, as the bulk is still held by the Fed and foreign central banks, who are not price sensitive.
Debt Stock Shortage, Debt Flow Surplus
Ironically, there remains an artificial shortage of the stock of Treasuries but now a huge glut in the flow. See here for a must read.
The Bund And JGB Anchor?
Treasuries are at almost record spreads on some maturities vis-à-vis the German bund, and foreigners are on a buying strike as the above data show.
How can an anchor be an anchor if there are no buyers? One asset arbitrage?
It is also not normal for the 10-year to be trading in such a tight range with a record short position in the futures market. The average daily move in the VIX has increased from 0.20 percent in 2016, to 1.37 percent in 2017, and shorts are now hardly spooked by a 500 point flop in the Dow.
Something must be going on beneath the earth’s crust. We have our ideas.
Dollar Strength
The recent dollar strength may be a signal foreigners are getting yield-hungry again, however. We are not so sure the rally has legs.
Market concerns over the political stability in the U.S may trump yield-seeking for the rest of the year.
How Foreign Flows Contributed To The Housing Bubble
We are not going to spend much time here but we are starting coming around to Mr. Greenspan’s reasoning. The lack of response of long-term yields to a 425 bps increase in the Fed Funds rate from 2004-2006 greatly contributed to the housing bubble. The 10-year yield only moved up 52 bps from when the Fed started their tightening to when they paused.
Take a look at the chart.
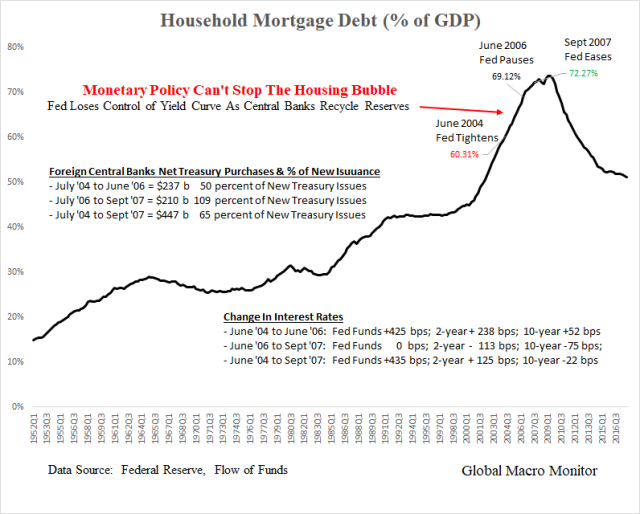
The Fed’s interest rate hikes didn’t even put a dent in the momentum of the housing bubble. Household mortgage debt continued to rise from 60 to 72 percent of GDP from the first interest rate hike before the market collapsed on itself.
Bubbles are hard to pop.
Why Long-Term Yields Didn’t Respond
Simple.
As, always and everywhere, capital flows or the recycling thereof.
The biggest economic event in the past 25 years, in our opinion, is the exchange rate regime shift that took place in the emerging markets in the late 1990’s. These countries now refuse to allow their currencies to appreciate in any significant magnitude as the result of capital inflows.
They learned some hard lessons in the mid-1990’s with Mexican Peso and Asian Financial Crisis, and the Russian Debt Default.
Balance of payments surpluses are now reconciled with dirty float currency regimes, where central banks intermittently intervene if their currency becomes too strong.
The result was a massive build of global currency reserves, much of which were recycled back into the U.S. Treasury market in the mid-2000’s.
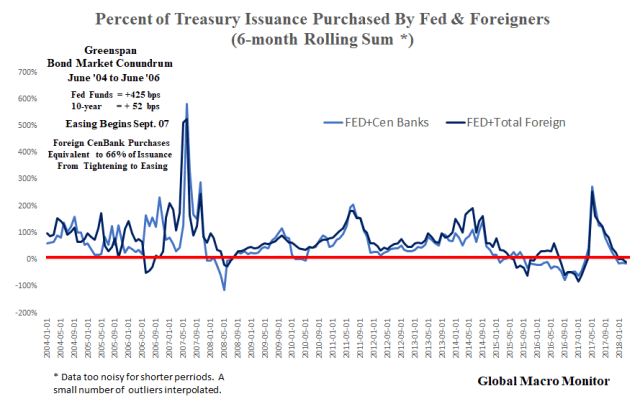
The chart illustrates that foreign central bank net purchases of Treasury securities, alone, were equivalent to the over 66 percent of net Treasury issuance during the Fed 2004-2006 tightening cycle.
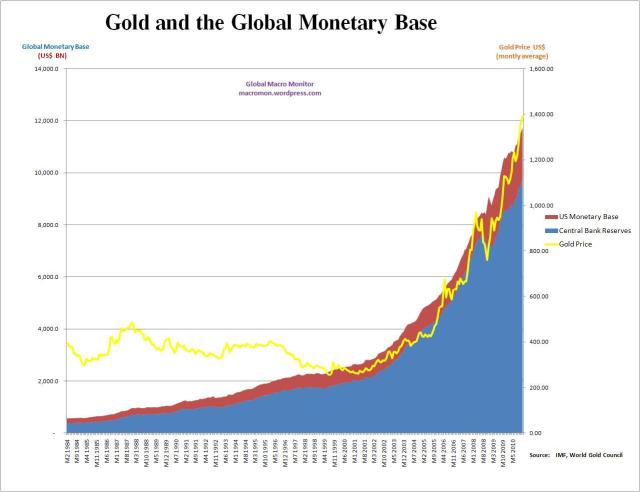
International Reserves Drive Gold
The gold price also ramped with international reserves during this period.
We believe the global monetary base, mainly international reserves, are the main driver of gold. See here.
Reserves have not been growing witness the punk trading range in gold. This may change as the U.S. current account blows out again.
Current Account And Trade Deficits
The Mnuchin crowd are wasting their time in China trying to negotiate lower trade deficits. Trade deficits are the result of macro internal imbalances where investment exceeds savings. See here for another must read.
Introducing trade distortions to artificially lower the external deficit will only accelerate stagflaton, which is already starting to take hold. Then we will all be worse off. See here.
Besides, where is Mr. Mnuchin going to obtain the financing for his proliferating budget deficits if his goal is to run trade surplus or balances with our trading partners?
We are all for better terms of trade and protecting are intellectual property rights, but know and understand thy national income accounting before starting trade wars.
Upshot
We have laid out why we believe, and we could be wrong, long-term yields are unlikely to behave as they did during the last monetary tightening. That is the a further collapse in Treasury term premia and a yield curve inversion until something breaks.
Unless the U.S. blows up its current account again, credit expansion accelerates significantly, creating another blast of capital flows into the emerging markets, to be recycled back to the U.S,, the foreign and Fed financing of the U.S. budget deficit is over. Punto!
We are preparing for a significant move higher in bond yields.
What Is The Right Real Yield?
Do you really think with the deteriorating flows in the bond market, coupled with rising inflation warrants a 0.5 percent real 10-year yield?
Au contraire! We believe a 2-3 percent real yield is closer to fair value.
Tack on another 2.5 percent for inflation, generous as shortages seem to be breaking out everywhere, and that gets the 10-year to at least 4 1/2 percent.
Timing
A little CYA. Yields could be move a little lower, maybe to 2.80 percent (a stretch), given the dollar strength as Europe slows, and shorts get spooked.
Our suspicions, however, it is going to be a hot summer. Higher interest rates and lower stock prices.
If stocks really crack hard, there will be a flight to quality keeping a lid on interest rates, however.
Disclaimer
Now let us add our disclaimer.
Even if all our facts are correct, our conclusions may be completely wrong.
If you have been reading the Global Macro Monitor over the years, you have probably seen it several times.
To illustrate our point, we like to tell the story Abraham Lincoln used to persuade juries when he was an Illinois circuit court lawyer.
The story goes that Lawyer Lincoln was worried he had not convinced the jury during the closing argument of a civil case against a railroad. The jurors had gone to lunch to deliberate. Lincoln followed them and interrupted their dessert with a story about a farmer’s son gripped by panic,
“Pa, Pa, the hired man and sis are in the hay mow and she’s lifting up her skirt and he’s letting down his pants and they’re afixin’ to pee on the hay.” “Son, you got your facts absolutely right, but you’re drawing the wrong conclusion.”
The jury ruled in Lincoln’s favor.
Information received since the Federal Open Market Committee met in March indicates that the labor market has continued to strengthen and that economic activity has been rising at a moderate rate. Job gains have been strong, on average, in recent months, and the unemployment rate has stayed low. Recent data suggest that growth of household spending moderated from its strong fourth-quarter pace, while business fixed investment continued to grow strongly. On a 12-month basis, both overall inflation and inflation for items other than food and energy have moved close to 2 percent. Market-based measures of inflation compensation remain low; survey-based measures of longer-term inflation expectations are little changed, on balance.
Consistent with its statutory mandate, the Committee seeks to foster maximum employment and price stability. The Committee expects that, with further gradual adjustments in the stance of monetary policy, economic activity will expand at a moderate pace in the medium term and labor market conditions will remain strong. Inflation on a 12-month basis is expected to run near the Committee’s symmetric 2 percent objective over the medium term. Risks to the economic outlook appear roughly balanced.
In view of realized and expected labor market conditions and inflation, the Committee decided to maintain the target range for the federal funds rate at 1-1/2 to 1-3/4 percent. The stance of monetary policy remains accommodative, thereby supporting strong labor market conditions and a sustained return to 2 percent inflation.
In determining the timing and size of future adjustments to the target range for the federal funds rate, the Committee will assess realized and expected economic conditions relative to its objectives of maximum employment and 2 percent inflation. This assessment will take into account a wide range of information, including measures of labor market conditions, indicators of inflation pressures and inflation expectations, and readings on financial and international developments. The Committee will carefully monitor actual and expected inflation developments relative to its symmetric inflation goal. The Committee expects that economic conditions will evolve in a manner that will warrant further gradual increases in the federal funds rate; the federal funds rate is likely to remain, for some time, below levels that are expected to prevail in the longer run. However, the actual path of the federal funds rate will depend on the economic outlook as informed by incoming data.
Voting for the FOMC monetary policy action were Jerome H. Powell, Chairman; William C. Dudley, Vice Chairman; Thomas I. Barkin; Raphael W. Bostic; Lael Brainard; Loretta J. Mester; Randal K. Quarles; and John C. Williams.
Yield curve flattening trades will flatten you in the next six months. The march toward 4 percent on the 10-year will continue after record shorts square up positions just a little bit more.
Inflation moving higher.
Moreover, the supply/demand flow in the cash market is the most bearish it has been in almost 30 years. Real interest rates are much too low for such rapidly deteriorating technical conditions. We will expand on this tomorrow with some beautiful charts and data.
Would’t be surprised to see a “super spike” in long-term rates sometime soon.
Sorry, Secretary Mnuchin.
…recently introduced tariffs were reportedly key factors behind greater cost burdens in April. Moreover, the rate of input price inflation accelerated to the sharpest in almost seven years.
…“Warning lights are being flashed in relation to inflation, however, with factories reporting the strongest rise in prices for nearly seven years. Suppliers are hiking prices in response to surging demand, while tariffs and higher oil prices are also exerting upward pressure on costs. With the average price of goods leaving factories rising at the fastest rate since 2011, consumer price inflation looks set to accelerate.” – US PMI, May 1