Great chart from the Visual Capitalist brought to of us from our favorite Polish crude and rude trader, the Skrypecker.
Now you can see why the markets work themselves into a deflationary tizzy when China hits a speed bump.

Great chart from the Visual Capitalist brought to of us from our favorite Polish crude and rude trader, the Skrypecker.
Now you can see why the markets work themselves into a deflationary tizzy when China hits a speed bump.
Given all the noise around the Trump Tariffs, we have updated our ranking of the world’s 2018 Current Account Balances (CAB) by country from largest surplus to biggest deficit, both as a percentage of GDP and in US$ billions, in the ginormous table below. The data are estimates from the October 2017 IMF’s World Economic Outlook database.
However, first, check out the current account balances of the G20. We suspect Germany will be under increasing pressure from the Trump administration to reduce its surplus, which is mainly the result of the country’s high savings rate.
Let us begin with a little primer on how the current account balance is determined.

We posted this in January 2017, before President Trump was inaugurated.
Trump Fiscal Policy and the Current Account Deficit
If President Trump succeeds in implementing his proposed tax cuts and $1 trillion infrastructure spending plans, the U.S. current account deficit, by definition, will, once again, balloon as net public savings will decline and, we believe, will be complemented by a decline in net private savings as business investment and private consumption increases. This is the simple national income identity,
(S-I) + (T-G) = Current Account Balance (Foreign Savings)
(S-I) is the ‘private savings balance’ or the difference between private sector savings (S) and investment (I); (T-G) is the ‘government balance’ or the difference between tax receipts (T) and all government expenditure (G); (X-M) is the difference between exports (X) and imports (M) and is usually called the simple ‘current account balance’. –
President-elect Trump does not like trade deficits, and we suspect he will be perplexed by the continued deterioration of the current account deficit caused by his macro policies. This risks that his administration may implement even greater international trade distortions to try and reduce the trade deficit.
The U.S. current account deficit is indeed deteriorating, not because of unfair trade practices but because of domestic economic imbalances. Somebody call Peter and Wilbur.

Public Savings, Government Budget Deficits, And The Current Account
The following scatter plot attempts to illustrate the relationship between net public savings and the current account. It does not include net private savings, generally a larger factor in the relationship. We have omitted some extreme outliers (45 percent CA surplus, for example). The trend line does shows a clear positive relationship.

Current Account Surplus = Foreign Savings
Finally, the ginormous table on country current account balances.
We have also added the U.S. Treasury holdings of most of the top 20 surplus countries. A country’s current account surplus is simply excess savings shipped abroad, mainly recycled into U.S. Treasury securities, since the dollar is the main reserve currency, which helps to keep interest lows in the United States.
In fact, as of the end of 2017, 36 percent of all marketable Treasury notes and bonds, excluding the Fed’s holdings, were held by 16 of the top 20 current account surplus countries, of which China and Japan hold almost 25 percent.
Given the U.S. high dependence on foreign savings to finance everything from consumption, infrastructure and budget deficits, there will be much macro wrenching and shrinkage of foreign financing if policymakers resort to gimmicks and artificial measures to reduce the trade and current account deficit.
The policymakers should focus more on sustainable policies to increase private and public savings.
Amen.
.

Yes, we believe so.
https://twitter.com/HistoryInPix/status/967915137142280192
Maybe not tomorrow, maybe not next week, but sometime this year the S&P500 will break into bear market territory at 2,298.30, 20 percent off its January 26th high, and 15.76 percent down from today’s close.

Interesting story by Axios about the war between Peter Navarro’s economic nationalist camp and Gary Cohn’s free trader-cohort inside the Oval Office which culminated in Cohn leaving the White House tonight.
The money quote that says it all:
Cohn tried to argue that these tariffs would ruin Trump’s record-setting stock market streak and wipe away benefits of tax reform. But Trump kept saying Cohn was a “globalist” while he himself was an economic nationalist. – Axios
We believe it is going to be difficult to be an economic nationalist when global investors and central banks: 1) hold 1/3rd of U.S. marketable public debt; 2) finance the bulk of the federal budget deficit, and 3) allow the U.S. to run current account deficits ad infinitum “without tears” — i.e., without a currency crisis.
We fear that may be about to change.
The economic nationalist label is going to comeback to haunt President Trump.
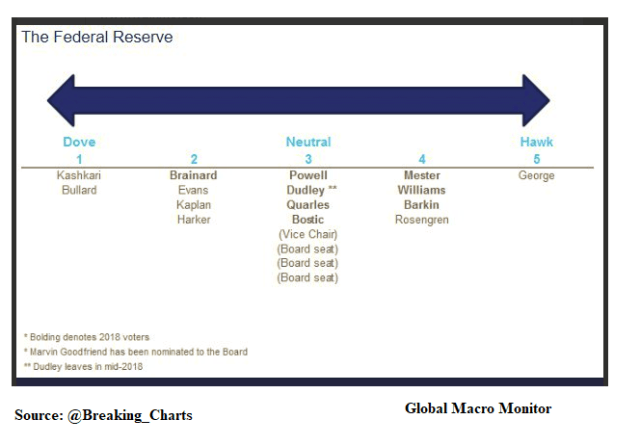
Now that Cohn is out it looks like game on for a new trade war. You never know with Trump, however, but Cohn’s departure is not a good signal.
The British newspaper, City A.M., gives us a hint at how the Europeans may retaliate. Hit the industries in the red states, particularly the home of the Congressional leadership.

Trump Increasingly Viewed As A Paper Tiger
The question now has President Trump painted himself into a corner?
Backing down would only reinforce the growing image that Trump is a bit of policy flake and a Paper Tiger.
I see no evidence that the president’s reputation as a paper tiger has improved at all since the summer. Just this week, as Ponnuru says, Trump floated a new protectionist plan – Ramesh Ponnuru, Bloomberg
Time to back down? Will he? Can he?
President Trump sounding a lot like Tom Petty these daze
.
I Won’t Back Down – Tom Petty
[Verse 3]
Well I know what’s right
I got just one life
In a world that keeps on pushin’ me around
But I stand my ground
And I won’t back down
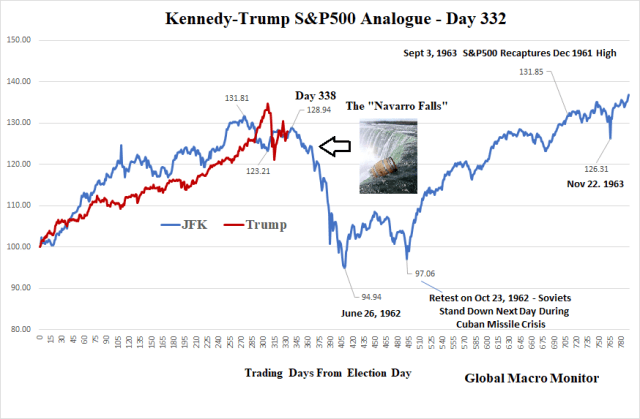
Right on schedule the barrel and catalyst — in the form of Gary Cohn’s resignation — cue up to take stocks over the waterfall.
Let’s call it what it is, “The Niagara Navarro Falls“.

.
Cramer’s Mad Money
Wow, it looks like Jim Cramer was lip synching his cheerleading. They just cut into the Mad Money program and patched in the announcement of Gary Cohn’s resignation.
Market Impact
Dow futures down 300 hundo since the open just eight minutes ago and S&P futures down 30 points.
We suspect foreigners are fast losing confidence in the management of USA, Inc. This could get brutal for the big three: bonds (unless major risk-off triggers flight to quality), the dollar, and stocks.
Now let’s see if the real sellers come out.
Stay tuned.
Buckle up, folks…..
In 1999, I called one of my professors from graduate school who taught monetary theory. Let’s call him Joe.
Here’s a short summary of the conversation:
Me: Professor Joe, can you believe how big this stock market bubble has grown?
Prof Joe: It’s a new economy, [Gregor].
I put down the phone in astonishment. Professor Joe drank the kool-aide.
In hindsight, indeed he was right, but not for the reasons he had concluded.
The economy did change in the 1990’s as is illustrated in the charts below. Not, however, for the reason Wall Street was touting to justify extreme asset valuations.
The New (Wealth Driven Asset) Economy
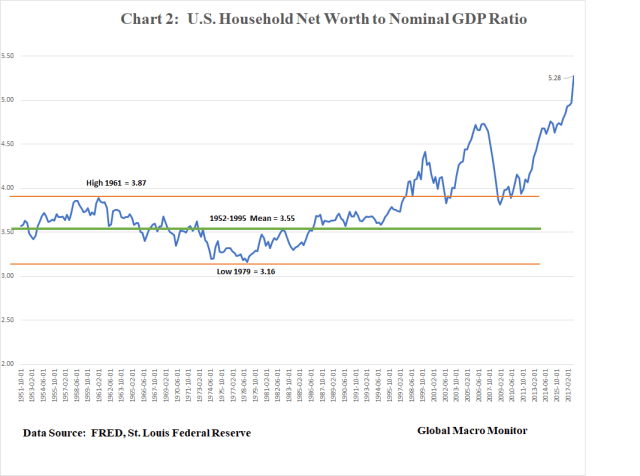
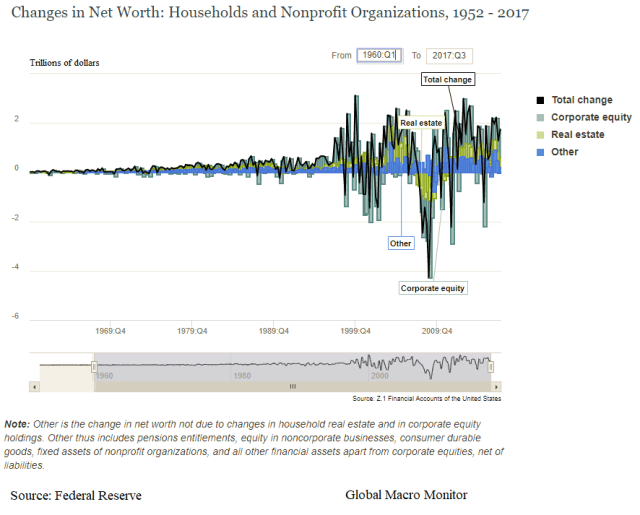
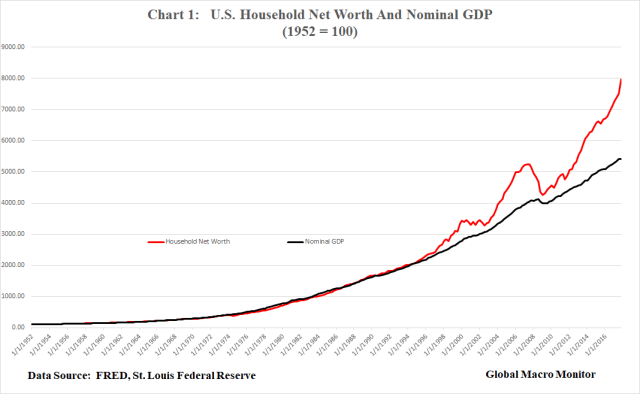
Household net worth, or asset prices, became more volatile and a much bigger driver of economic growth as illustrated in the charts below. The second chart normalizes the data by gross domestic product.
The average change in household net worth on a quarterly basis relative to GDP from 1952 to 1994 was 6.17 percent with a standard deviation of 4.68 percent. Since 1995, the average change has been 5.89 percent, but the standard deviation has more than doubled to 10.21 percent. The similar mean of the two periods most likely reflects the mean reverting nature of asset returns.
Why The Change?
We posted a couple reasons we believe were the cause for this financial and economic structural shift in the mid-90’s:
1) Moral Hazard
First, moral hazard was internalized by traders and investors. Though the “Greenspan put” was born almost a decade earlier after the 1987 stock market crash, the 1994-1995 monetary tightening culminated in the collapse of the Mexican peso and set off the Tequila Crisis in emerging markets. The U.S. government had to step in and bailout Mexico with $50 billion-plus in loans…
Second, the rise of the internet and technological changes fundamentally changed the U.S. economy and its payments system. We do not have time to research the specifics, but we suspect it is reflected in the secular decline in money velocity which peaked in the 1990’s and has fallen ever since with the exception of a small bump just before the credit/bubble popped…
3) Asset Markets Became The Economy
The labor shock caused by the entry of China and Eastern Europe into the global economy contributed to a significant hollowing out the U.S. middle class as policymakers failed to compensate the losers of free trade. They were effectively swept under the rug as globalization took off, corporate profits soared, and consumer prices were held in check with cheap imports. This effect culminated in the 2016 political Black Swan.
Fundamental Shift In Aggregate Demand
It is our contention the decline in the purchasing power of a relatively large swath of Americans, with a relatively high propensity to consume, were crippled and when coupled with the rapid rise in income and wealth inequality aggregate demand has become insufficient to drive economic growth at an adequate pace… – Global Macro Monitor, Feb 5, 2018
If you haven’t seen the post, Start Of A Mean “Mean Reversion” In Stock Values?, run don’t walk to read it.
.
.

Upshot?
Our hypothesis that the economy is becoming more influenced by asset prices and debt, and to a lesser extent by income (which is endogenous) due to a secular stagnation in real wages, is a work in progress.
Moreover, the whole inflation/deflation debate has morphed into a dialectic, which is path dependent on asset prices. Stocks values move up to a critical level (which holders likely believe to be permanent) that stirs the animal spirits and kicks economic growth into gear. Inflation eventually becomes an issue moving interest rates higher. The asset bubble pops, stock values go down, confidence declines, aggregate demand softens and deflation now becomes the headline issue. Wash, rinse, repeat.
In addition, each asset cycle results in greater divergent of valuations from the economy (see charts below) as the wealth disparity increases. The marginal propensity to consume is much higher for middle and working class consumers. As wealth becomes more concentrated at the higher end, aggregate demand weakens on a relative basis and more theoretical wealth is needed to generate the same demand.
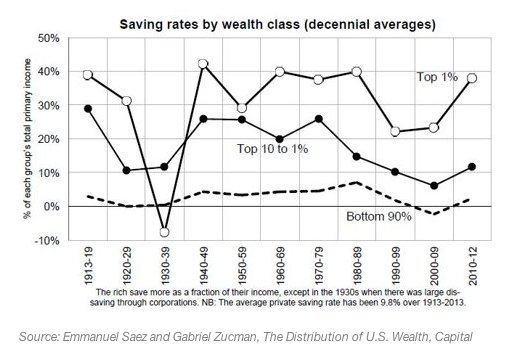
“The wealthy buy Apple stock with their gains, whereas the middle class buy apples.”
We have run some preliminary statistical analysis and regressions and thus far the data do support our priors. Back to you when we complete the analysis.
.
.