Stratfor – Tensions Flare in China-Japan Islands Dispute

Wash, rinse, repeat!

Remember the rare earth retaliation and panic in 2010?  These tensions and the local anxiety over a more assertive China is the best thing that has happened for U.S. diplomatic relations in Asia in a long time.

Let’s hope it’s not “wag the dog” to deflect attention off the bad economy.

(click here if video is not observable)

Posted in China | Tagged , , , | 2 Comments

Apple – The Most Valuable Company Ever!

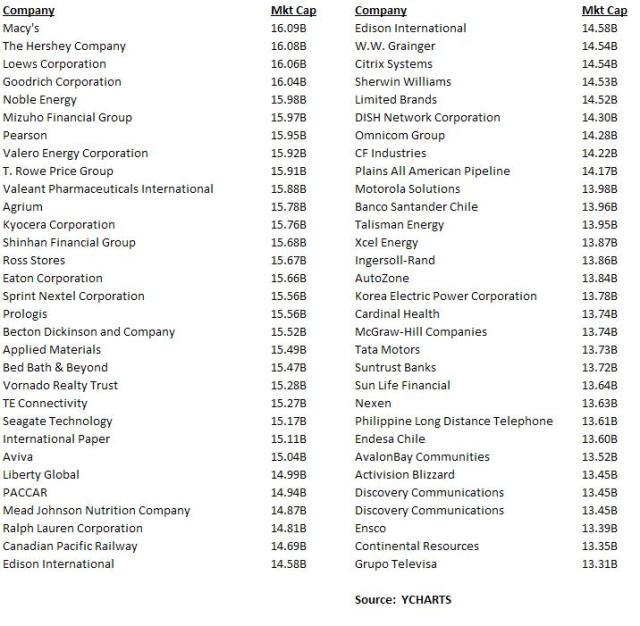
Apple tacked on another cool $16 billion of market value today with its $17 plus move.  That’s big, folks, and larger than the entire market caps of companies such as Valero,  Sprint,  Ralph Lauren,  Korea Electric and Power,  Agilent, Chesapeake Energy, and Humana (see table).   In fact, only about 325 companies have a larger market value than what Apple’s stock created today!

The company  is now priced at $623.5 billion making it the most valuable company ever according to Reuters,

Apple Inc became the most valuable public company of all time on Monday, after its market value climbed beyond $620 billion to surpass a milestone set by Microsoft Corp more than a decade ago.

Apple’s market cap is now 50 percent higher than that of Exxon.

We have loved this stock.   The only thing that makes us nervous longer-term is that Apple has very little recurring revenues and has to get up every morning and sell new iPads and iPhones to meet their nut.

They still have great potential to grab market share and penetrate new markets, such as China, for example.  Furthermore,  Apple does have an incredible track record of reinventing itself.  So, for now, we can kick these worries down the road for another day and enjoy the ride.

(click here if chart and table are not observable)

Posted in Apple | Tagged , | Leave a comment

The Chart That Keeps Us Up At Night

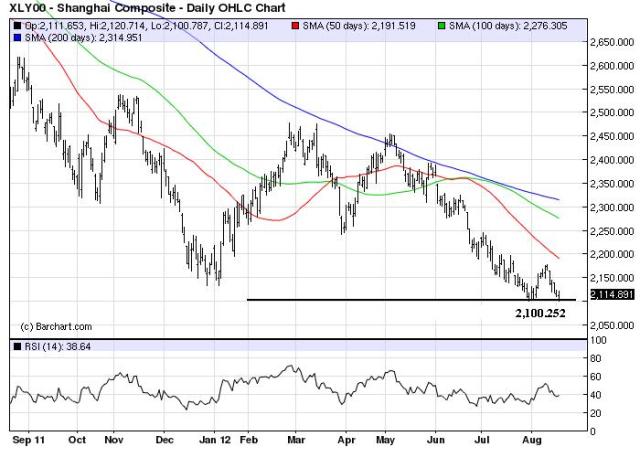
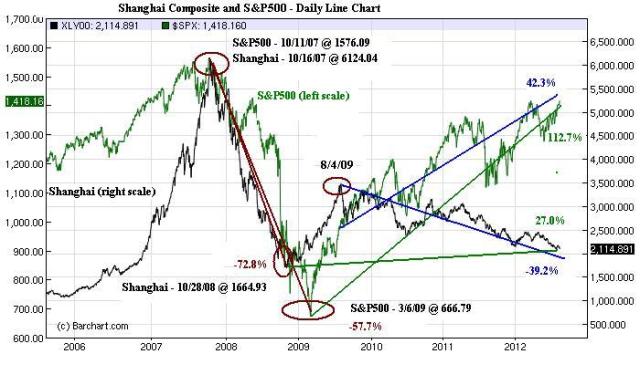
The only major global equity index which we monitor — and it is a big one – that is down for the year is the Shanghai Composite.   The chart looks ugly and ready to break to new lows after its post crash peak of 3,477, way back in August 2009.

The Shanghai is down 39.2 percent from its post crash high while the S&P500 is up 42.3 percent over the same period.   After falling 72.8 percent in a little over a year from its October 2007 peak, the Shanghai is now up a lowly 27 percent from it crash low.  This compares to the S&P500, which fell 57.7 percent from the October 2007 high to the March 2009 low,  and has now recovered 112.7% and continues to move higher.

A stunning divergence of the world’s two largest economies’ stock markets.

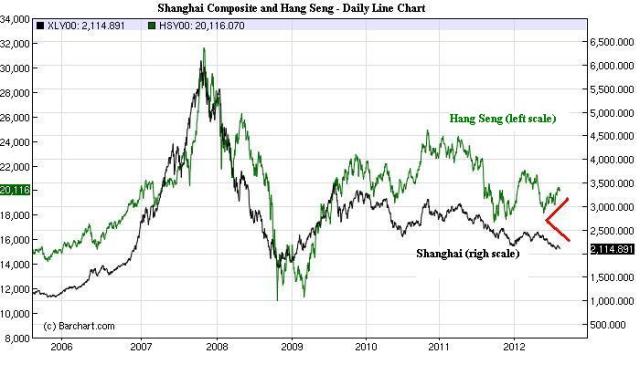
What makes us a little nervous is the Chinese stock market was the first to really collapse after peaking in the fall of 2007  and the first to bottom just a year later.    We can relax a little as such a large and sustained divergence since August 2009 largely dismisses the notion that the Shanghai leads U.S. and global equity markets,  however.   The chart below illustrates even the Hang Seng, one of our favorite indicator species for global risk appetite, has decoupled from the Shanghai.

What does the continued poor performance of the Shanghai signal?   Not sure, but either Chinese stocks are holding a massive fire sale and the Shanghai is setting up for a huge bounce or Air China is crash landing.  And the latter, folks,  ain’t good.

Another 2o percent drop in the Shanghai from current levels and it will be testing the lows of the 2008 crash.  Keep this one one your radar.

(click here if charts are not observable)
Posted in China | Tagged , , , | 16 Comments

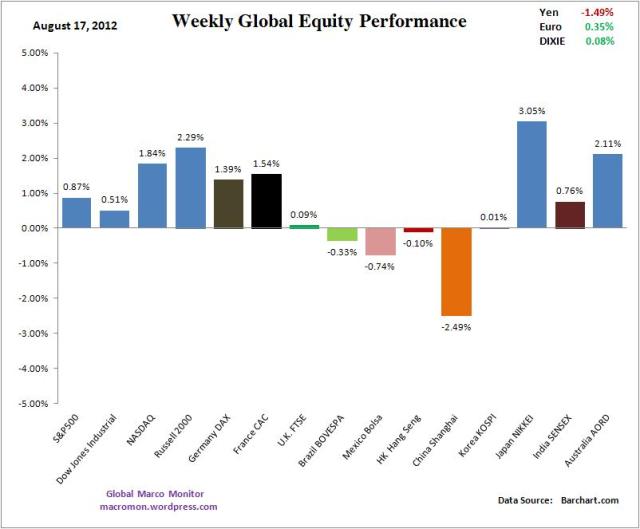
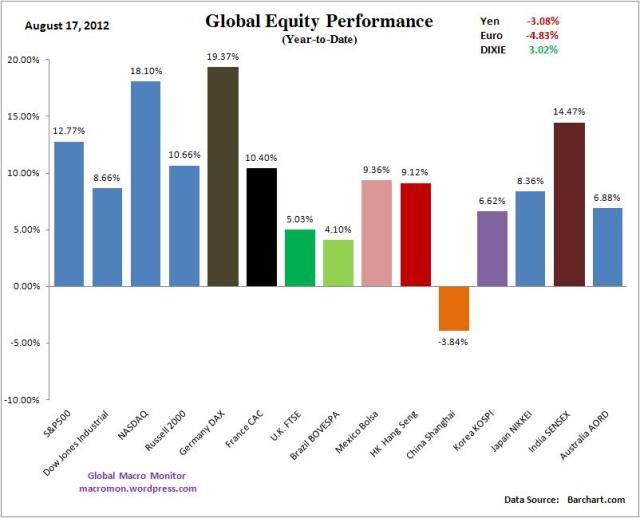
Week in Review

(click here if charts are not observable)

Posted in Week in Review | Tagged , , , , , , , | Leave a comment

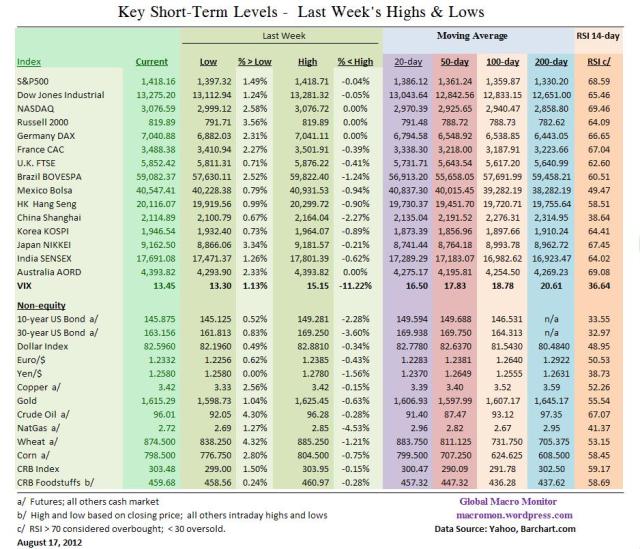
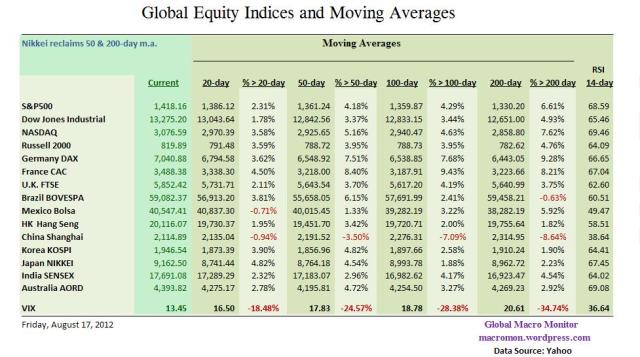
Global Trend Indicators

(click here if tables are not observable)

Posted in Global Trend Indicators | Tagged , , , , , , , , | Leave a comment

Stronger Eurozone Countries Prepare Plan B

(click here if video is not observable)

Posted in Euro, Germany, Italian Yields | Tagged , , , | Leave a comment

Apple Closes At All-Time High

While Facebook got another facial today, closing at an all-time low,  Apple closed up almost $12 at a new all-time high.   It sliced through its old high of $644 like a “hot knife through budder”!

Today’s move now puts the company’s market value at $607 BN.   That’s one big Apple!

Don’t mistake the lack of action in the indices with no action.  The big cap techs, such as Apple and Google, are on the move.   The narrow rally has its risk and should be monitored, however.

(click here if chart is not observable)

Posted in Apple | Tagged , | Leave a comment

Weekly Eurozone Watch – Spreads Tighten, Banks Ramp

Key Data Points
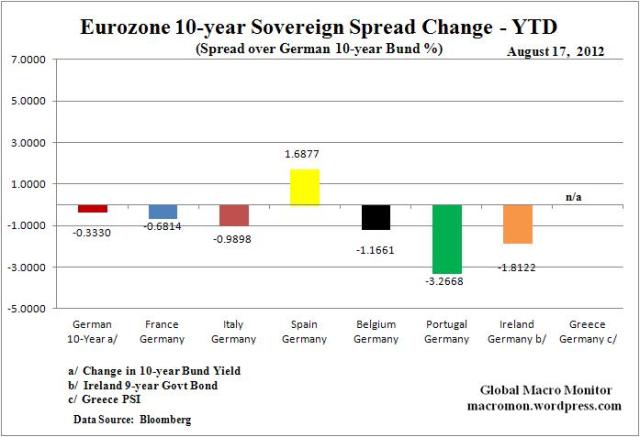
German 10-year bund 11 bps higher;
Italy 10-year 23 bps tighter to the Bund;
Spain 56  bps tighter;
Portugal 33 bps tighter;
Greece 9 bps tighter;
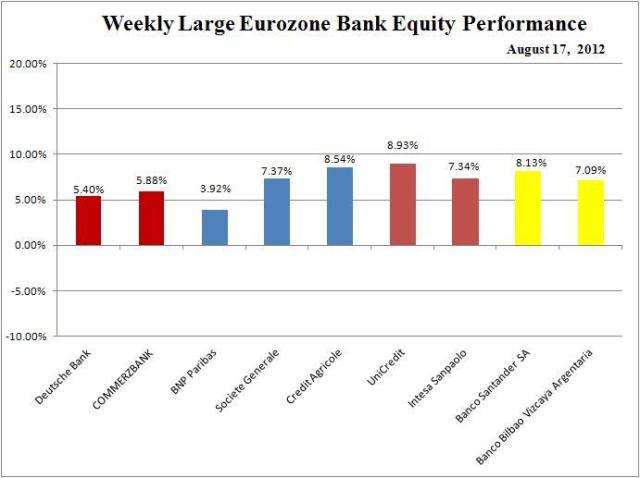
Large Eurozone banks continue to run, up 3-9 percent for the week;
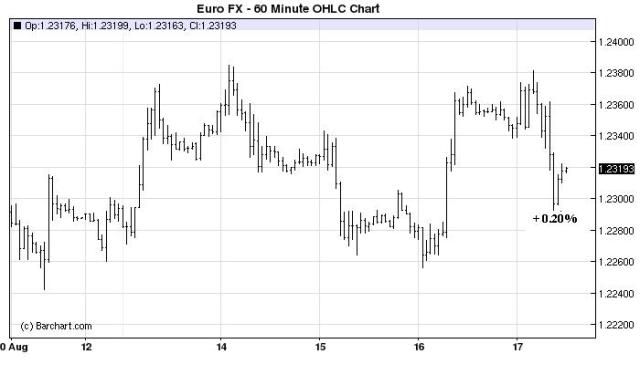
Euro$ up 0.20 percent.

Comment
Merkel returns from holiday and backs ECB’s Draghi on Spain and Italy.  At least that’s the market perception.  Our sense is the debate will be over hard or soft conditionality, which will have political blowback  in both the north and south.

Speaking late Thursday at a news conference in Ottawa with Stephen Harper, the Canadian prime minister, Ms. Merkel backed a statement by Mario Draghi, the president of the E.C.B., that the bank would do whatever it took to preserve the euro.

In contrast to some members of the German Parliament, Ms. Merkel expressed no objections to plans by the E.C.B. to buy bonds to hold down borrowing costs for stricken countries, if certain conditions were met.
– NY Times

Note the significant tightening to the bund in all countries x/ Spain for the year.

(click here if charts are not observable)

Posted in Weekly Eurozone Watch | Tagged , , , , , , , | 5 Comments

China’s Slowing Economic Boat

(click here if video is not observable)

Posted in China | Tagged , , , | Leave a comment

The S&P500’s Stairway to Heaven

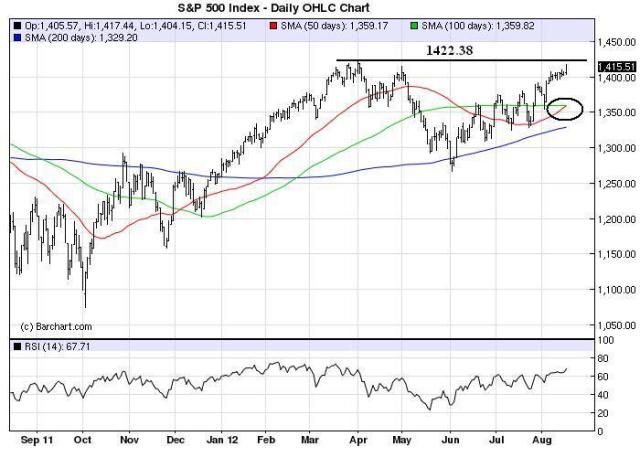
Stunning price action during these low volume dog days of August.   The market keeps marching higher and just won’t go do down to allow the under invested an opportunity to get long.

Ugh! The summer night sweats of a money manager short his/her index!

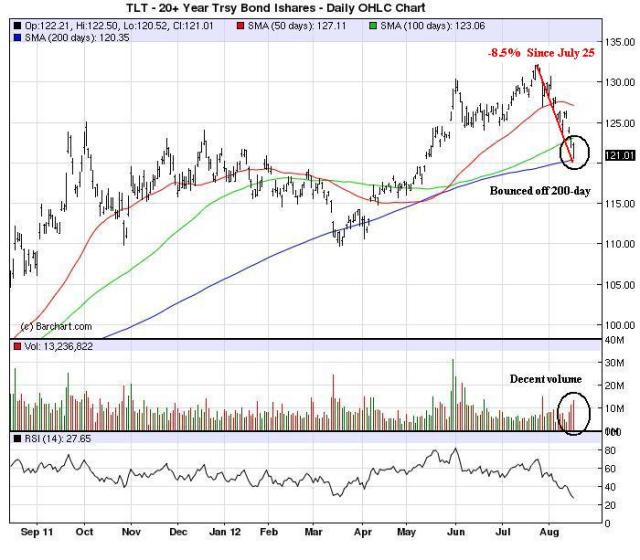
Only 7 points to a new post crash high, which may or may not act as a bit of short-term resistance.   Note the 50-day s.m.a is ready to cross over the 100-day and the bond sell-off, reflecting the flight from the flight to quality and fear trade,  is confirming the rally in big cap stocks.

The 20-year TBond Ishares (TLT) bounced off its 200-day today, but is down 8.5 percent since July 25th.   What’s that about 3 years of yield or coupon?   Markets move fast, are merciless, and love to humble the certain and proud,  mon ami!

Just one more thing.  Everyone, and we meeeeeeean everyone,  wants to sell this market.   And you know what that means.

(click here if charts are not observable)

Posted in Bonds, Equities | Tagged , , , | 4 Comments