Is the Fed Contributing to the Credit/Mortgage Crunch?

One of the smartest hedge fund managers we know spends most of his day locked away in his office analyzing how the market consensus could be wrong.  He hangs with au contraire crowd, breaking bread with contrarians and demands you check your cheerleader pom-poms at the door when visiting his office.   Not that he takes action or trades on all or any of this, but his rigorous discipline of stress testing his perspectives, positions, and the conventional wisdom of the market is a lesson for all of us.

Our hope is the policymakers, especially the Fed, do the same.  The world is experiencing the adverse consequences of negative real interest rates and yet the monetary policy prescription of choice is for more negative real interest rates.

In his September 6th FT piece, Bill Gross writes,

…monetary policy at the zero interest rate bound introduces a new dynamic that may conflict or even reverse standard logic that lower interest rates across the sovereign yield curve are everywhere and always stimulative to economic growth.

This potential paradox arises not just from observation of the Japanese experience over nearly two decades, but from an analysis of our modern-day financial system and its potential inadequacies. Fractional reserve banking, where only a portion of bank deposits are backed by hard cash, as well as unreserved collateral-based lending on overnight repo have allowed for an expansion of credit beyond the bounds of a central banker’s imagination.

Mr. Gross concludes the Fed’s pancaking of the yield curve through Operation Twist will destroy the banking system’s incentive to create credit by reducing the opportunity for banks to leverage a positively sloped yield curve

We add our two cents to the Bond King’s skepticism of current policy using the basic supply and demand curves of microeconomics, or what graduate students call “price theory.’   Recall how we were taught as freshman that rent control creates a shortage of rental apartments and housing when government policy distorts or represses market prices.

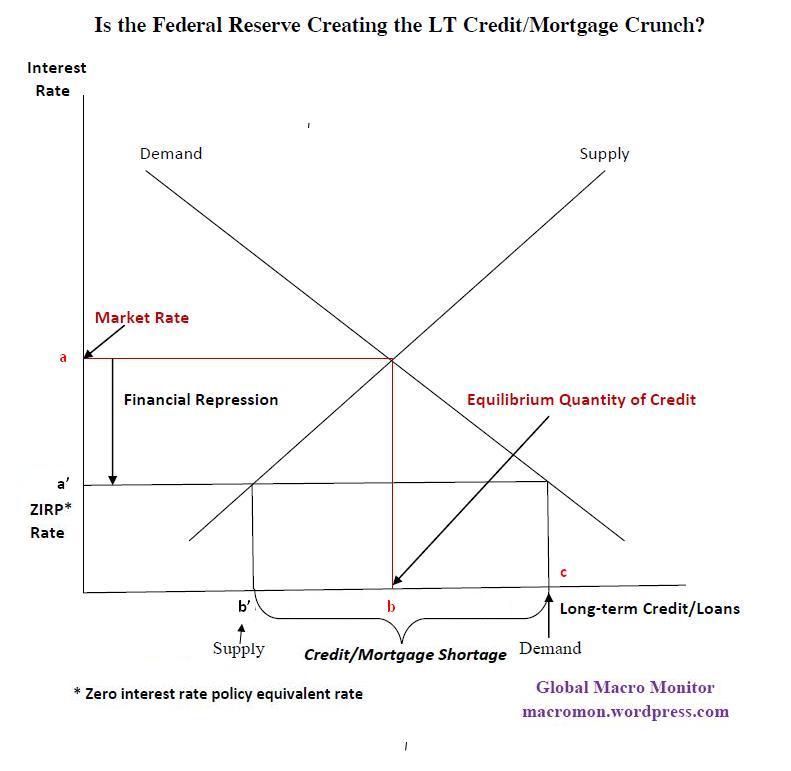
Take a look at the chart below, which should look familiar as it is simple adaptation of the rent control analysis.  The vertical axis shows the interest rate with the horizontal the quantity of loans/credit/mortgages.

It is also important to note demand and supply curves are not observable in the real world.  What we see are prices and quantity.  But like any economic model, supply and demand curves help us understand the underlying dynamics and the factors that determine the prices and quantity/volume which we observe.

The graph shows that points a and b are the equilibrium market clearing interest rate and quantity of long-term credit/loans/mortgages.   The implementation of zero interest rate policy (ZIRP) and Operation Twist represses the rate to point a’.  This reduces the supply of credit/loans/mortgages from point b to b’.

After all, who in the private sector will lend long-term money at such repressed and non-economical interest rates?  Fannie and Freddie?  Yes.  Bill Gross and PIMCO?  We suspect it’s possible for a trade.  Asian investors?  NFW!

Furthermore, demand increases to point c at the repressed interest rate forcing either public sector lenders to expand their balance sheets or the market to ration credit through a tightening of credit standards, higher down payments, or by other means.   This analysis doesn’t even consider the reduced income on savings and the crowding out effect of the federal deficit.  There’s no doubt, in least in our mind, the government is going to get funded first even if the FED has do it alone.

It’s our sense, and we could be wrong, this simple model reflects current reality and one can easily conclude that zero interest rate monetary policy may be what ails the economy and not the prescription that is going to cure it.  We throw it out there to help Mr. Bernanke, at least, consider a contrarian perspective, which, like our friend, will make him a better hedge fund manager.  Maybe he already has. He’s a smart guy and a professor.

(click here if the graph is not observable)


Posted in Black Swan Watch, Bonds, Budget Deficit, Monetary Policy | Tagged , , , | 14 Comments

Disintermediation in China’s Banking System

The consequences of negative real interest rates and financial repression.   We know how this story ends.   Keep this one on your radar.

(click here if video is not observable)

Posted in Black Swan Watch, China, Credit, Inflation/Deflation, Monetary Policy, Real Estate | Tagged , , | Leave a comment

Week-long unrest in Greece ahead of troika meeting

(click here if video is not observable)

Posted in Black Swan Watch, PIIGS, Sovereign Debt, Sovereign Risk | Tagged , , | Leave a comment

La Grande Divergence

Great chart of eurozone sovereign 10-year yields from Desmond Lachman of the American Enterprise Institute.  We made a decent living off the “great convergence trade” of the 1990’s, where yields of the eurozone sovereigns collapsed on top of each other.  This sent the Belgium dentists into a yield panic and contributed to a massive global tightening of credit spreads from U.S. high yield to Ecuadorian corporates.

Those were crazy daze.   We recall one sovereign deal in Panama oversubscribed to the tune of 25% of the country’s GDP!   That is,  bond investors,  in just one new issue, were willing to lend to the government of Panama in the amount equivalent to 25% of its GDP.   Efficient markets, anyone?

This is also a great chart in the context of today’s announcement leakage of Europe’s big bang sovereign/bank bailout, which is positive as the Eurocrats now recognize the seriousness of their problems and have finally stopped fighting the markets.   We just don’t know how the German and Finnish taxpayers are going to react to taking on leverage to convert the EFSF into a potential trillion euro bailout fund; not to mention how the Greeks respond to having their pensions cut by 40 percent.

The climax of Europe’s existential crisis is upon us, folks.   The political noise in Europe is about to grow much louder.  The deal risk is high and we’re watching how this reflex rally, which needs Asian market confirmation,  plays out.   Chalk up another nutcracker.

(click here if chart is not observable)

Posted in Black Swan Watch, Bonds, Budget Deficit, Euro, PIIGS, Sovereign Debt, Sovereign Risk | Tagged , , , , , | 1 Comment

Week in Review: Gold and the Three McBears

What a week.  The China/Asia slowdown worries came full force onto the radar screen with the collapse of copper and the Hang Seng.  We put more stock in these real time indicators than the official data coming out of officialdom.   Now the market must contend with three macro bears:  1)  how much and how Asia slows;  2)  the Eurozone debt crisis; and 3) the slowing U.S. economy and employment/political problem.

Can equities hold up?  We don’t know for certain but do think the danger is on the long side.   These three issues are going to take time to resolve with resolution of the latter two constrained by severe institutional and political pressure.

The equity markets have a few positive factors working for them:   1)  a lot of bad news is priced;  2)  earnings have thus far held up and will have to confirm the negative macro for stocks to break hard and stay down;  3)   commodity prices are falling back to earth, which is a positive real income shock for consumers and energy importers;  4)  fast money is bearish and most likely net short;  5) interest rates are approaching zero in almost all maturities and impatient money will have to be put to work somewhere;  6) the global volatility will end or accelerate the end of the tightening cycle in emerging markets;  and 7) we are pretty beared up, which is usually an indicator markets are ready to move higher.

Add it all up?   Continued volatility and 1101, 1101, 1101 on the S&P500!

Finally, we warned last week gold could take a big swan dive and $1,700 was where the “river meets the waterfall.”  The chart below shows the yellow metal  hasn’t been below its 200-day moving average in more than 2 1/2 years.    The power of the rally has been stunning.  We now think gold is set to test its 200-day moving average at $1,527, which is the level we will take a shot at getting long again.

Good luck this week!


(click here if charts are not observable)

Posted in Week in Review | Tagged , , , , , , | 2 Comments

Interview: Anni Podimata, Greece VP of the European Parliament

(click here if video is not observable)

Posted in Black Swan Watch, Euro, PIIGS, Sovereign Debt, Sovereign Risk | Tagged , , | Leave a comment

Each U.S Citizen Owes $3,719 to China and $475 to Russia

The Great Flow of US Debt
Created by: MBA Online

(click here if chart is not observable)

Posted in Black Swan Watch, BRICs, Budget Deficit, China, Sovereign Debt, Sovereign Risk | Tagged , , , | Leave a comment

Look east, young man, at the “64 million empty apartments”

In the context of Jeremy Grantham’s warning that this is no market for young men, coupled with this week’s collapse in copper, oil, and the Hang Seng, we wonder if the realization and fallout from China’s ghost cities is  really starting to haunt the global markets.   This video, a documentary from Australian TV from earlier this year,  is well worth your time.   Crunching tiger, hidden debt.  Yikes!

(click here if video is not observable)

Posted in Black Swan Watch, China | Tagged , , , | 1 Comment

Global Trend Indicators

(click here if tables are not observable)

Posted in Global Trend Indicators | Tagged , , , , , , , , , | 1 Comment

Phases of the Credit Cycle

Another great chart from the IMF.

(click here if chart is not observable)

Posted in Charts, Credit | Tagged | 5 Comments