The efficient market hypothesis (EMH) says that prices reflect all available information. This leaves a lot of room for interpretation. Should asset prices be set by rational investors whose only concerns are systematic risk1 and expected returns? It seems implausible to link recent meme-stock price movements to economic risks. Rather, they seem fueled by investor demand to be part of a social movement, hopes to strike it rich with a lucky stock pick, or plain-old schadenfreude. – Franklin
After reading the following article this morning on the Chinese stock market, we are reposting a piece from back in the day about how algos have buried the Efficient Markets Hypothesis (EMH).
My professors in grad school would say this is impossible, and I have one word for them: GameStop! (h/t Harry The K.).
It’s stunning that the SEC and other policymakers have allowed this to go on.
Monetary policymakers really “have a tiger by its tail.”
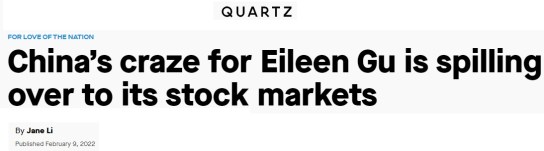
China has been cheering ecstatically for US-born freestyle skier Eileen Gu, who got a gold medal for China at the Beijing Winter Olympics during the women’s big air competition yesterday (Feb. 8). Now it turns out companies whose names resemble Gu’s Chinese name are also getting a lift.
It is not uncommon for small-cap companies listed in China to see their shares move due to news events, even if the firms have no connection at all with the newsmakers. In November 2020, a Chinese company whose name sounds like “Trump wins big” in Mandarin Chinese surged almost 10% on the final voting day of the US presidential election, whose two candidates were the Democratic party’s Joe Biden and the Republican party’s Donald Trump. – Quartz

Does Anne Hathaway Drive Berkshire Stock?
We posted last October our suspicions that algo/robo traders were driving the almost tick-for-tick correlation between the Australian dollar and the S&P500. Remember those days of great fun?

 Now, the Atlantic suspects that algorithms may, and we stress may, have been written and programmed to buy Berkshire Hathaway (BRK-A) stock when Anne Hathaway is mentioned in the news! Alexis Madrigal of The Atlantic writes,
A couple weeks ago, Huffington Post blogger Dan Mervish noted a funny trend: when Anne Hathaway was in the news, Warren Buffett’s Berkshire Hathaway’s shares went up. He pointed to six dates going back to 2008 to show the correlation. Mervish then suggested a mechanism to explain the trend: “automated, robotic trading programming are picking up the same chatter on the Internet about ‘Hathaway’ as the IMDb’s StarMeter, and they’re applying it to the stock market.”
The idea seems ridiculous. But the more I thought about the strange behavior of algorithmic trading systems and the news that Twitter sentiment analysis could be used by stock market analysts and the fact that many computer programs are simply looking for tradeable correlations, I really started to wonder if Mervish’s theory was plausible.
Madrigal checked in with John Bates, former Cambridge computer whiz whose company Progress Software writes algo strategies for hedge funds to ask, “Is this at all possible? Bates, to his surprise, answered “Maybe.”
We come across all sorts of strange things in our line of business, strange correlations,” Bates told me. “And I’ve had a lot of interest in this for a long time because it’s really often the secret source for certain hedge funds.”
Companies are trying to “correlate everything against everything,” he explained, and if they find something that they think will work time and again, they’ll try it out. The interesting, thing, though, is that it’s all statistics, removed from the real world. It’s not as if a hedge fund’s computers would spit the trading strategy as a sentence: “When Hathway news increases, buy Berkshire Hathaway.” In fact, traders won’t always know why their algorithms are doing what they’re doing. They just see that it’s found some correlation and it’s betting on Buffett’s company.
Algo/robo trading appears to becoming not only more bizarre, desperate and reaching the level of the absurd. Imagine a program, for example, written to sell 10K S&P500 futures contracts in illiquid market on the news of a report of a butterfly flapping its wings at home plate at Wrigley Field momentarily interrupting a Cubs game. The selling drives the index down 2 percent. Another program written to sell several thousand contracts when the index moves down 2 percent in, say, a 45 second time period then kicks in, driving the index down another 3 percent. Several thousand other programs are written to sell several thousand more contracts when the market is down 5 percent. A tornado on Wall Street set off by the flapping of a butterfly’s wings in Chicago? Hey, don’t entirely discount such a scenario. This is probably not far from what happened during last year’s “Robots Gone Wild” flash crash which was kicked off by the bank burning Greek riots.
At least we have some theories behind our correlations, such as the Hang Seng as an indicator species for global risk appetite. And we did make some money once buying Callaway (ELY), the proud sponsor of Phil Mickelson, the Friday before he won his first Masters.
But good luck trying to trade against this type of nonsense. We also wonder if the robot has been reprogrammed to sell rather than buy Nike (NKE) after Tiger’s downfall when he is now mentioned in the news. As they say on the newly paved Street, just go with the flow algo!
Email subscribers should always click the website version as the original post is often edited and updated. Thank you.