The Secular Decline in U.S. Manufacturing Employment

Manufacturing_Payrolls

The title of the post is a bit of a misnomer.

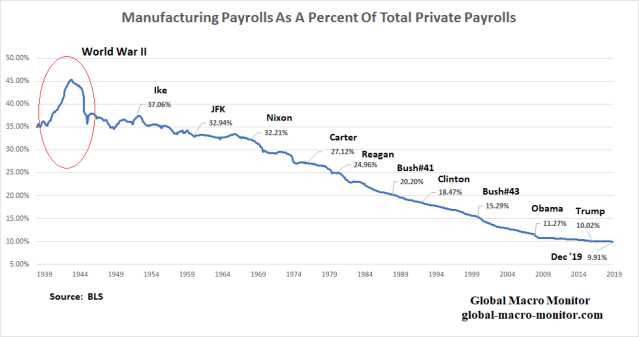
Though the number of manufacturing jobs in the United States is 40 plus percent higher than in 1939, the proportion of total private payrolls hit its lowest level in December at 9.91 percent.

That is there are almost 4m more manufacturing payroll jobs in December 2019 than in January 1939, which at the time — just four months before Germany invaded Poland to start WWII, BTW — made up 35 percent of American nonfarm payroll jobs.  It’s relative, however, as there are also 104m more private-sector payrolls.

Manufacturing peaked as a percentage of private payrolls in the U.S. at 45.30 percent in November 1943 at the height of World War II, when everyone and their mother not in uniform were building tanks and ships. Anybody hear of, or remember Rosie The Riveter?

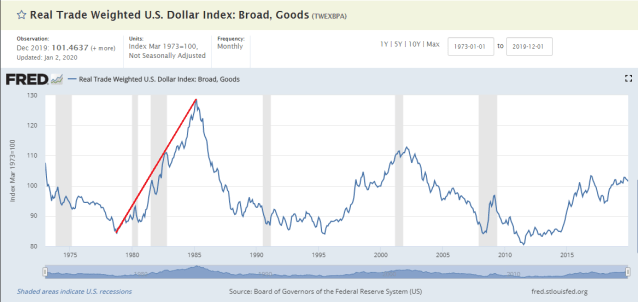
The absolute number of manufacturing jobs peaked at 19.6m in June 1979.  We do have our suspicions the 53 percent real increase in the value of the trade-weighted dollar from October 1978 to March 1985 inflicted a staggering and potentially fatal blow to the U.S. manufacturing sector.  Think hysteresis, folks.

Durable Manufacturing Employment

Because the above chart includes both durable and nondurable manufacturing, we have broken out durables.   Nondurables make up 37.3 percent of manufacturing payrolls, with food production about  35 percent of nondurable employment.  It’s our perception most do not think that making cupcakes and craft beer constitute a robust manufacturing sector.  Not surprisingly,  the production of craft beer has been one of the highest growth subsectors in manufacturing payrolls.

Manufacturing_Payrolls_2

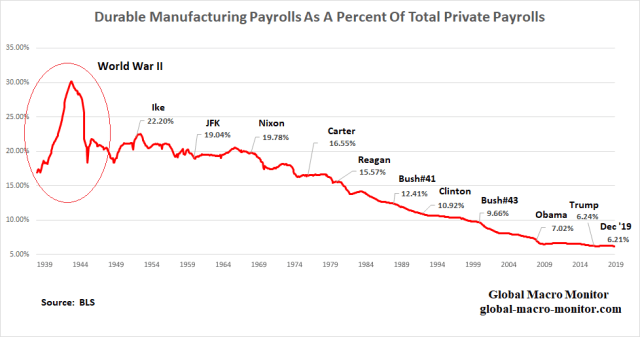
The data show that only 6.21 percent of all private-sector payrolls in December 2019 is in the durable goods manufacturing sector, also a historic low.

Golden Age Of Manufacturing Employment 

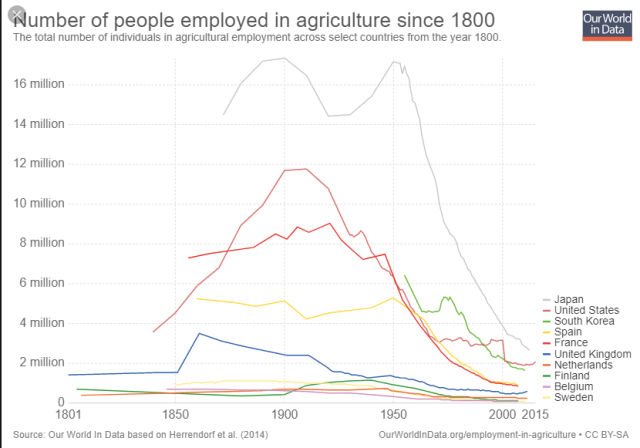
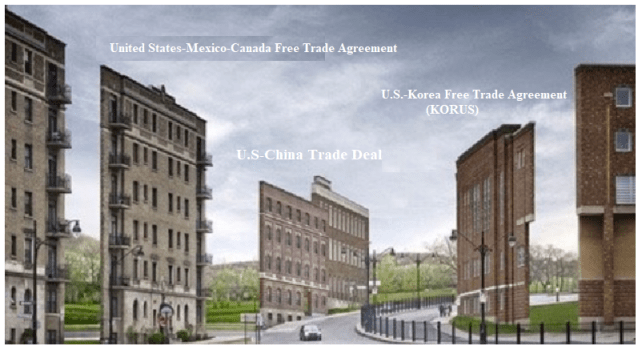
As the data show, the U.S. labor market has been in a secular relative decline moving away from manufacturing jobs.  Believing some minor tweaks to a few trade deals here and there will reverse the trend is Fantasyland and fairy tale thinking.   If anything, robotics and automation are going to take the proportion of manufacturing jobs down to similar levels as those in the agricultural sector, in our opinion.

The chart also clearly illustrates trade is not the only issue affecting the relative decline in manufacturing payrolls and the promised renaissance of manufacturing jobs just ain’t gonna happen.   Policymakers better prepare the public for a high-tech future or there will be more hell to pay, and then some.

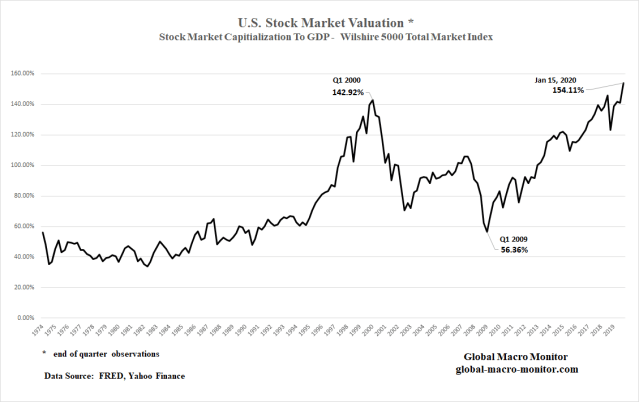
The Greatest Economy Ever

President Trump was out again today pounding the table about the “greatest economy ever.”  Man, the B.S. is getting old.

We thought we would let the data speak by juxtaposing the key economic digits in his first three years in office with President Obama’s last three years.   You decide.
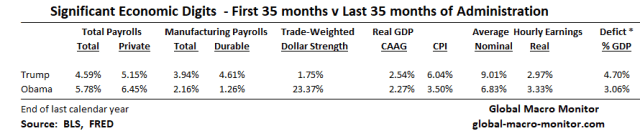
Table_Jan20

Dollar

Note the huge headwind caused by the dollar strength in Obama’s last three years.  No doubt it had a major impact on manufacturing payrolls.   Recall our analysis from last July,  which included the following table of the correlation of manufacturing payrolls with the year-on-year change in the trade-weighted dollar.

For example, the correlation between the 3-month moving average of the monthly change in machinery payrolls and the year-on-year change in the value of the trade-weighted dollar index lagged six months, is -0.877 for the period.  That is a stunningly high number, folks, and makes all the economic sense in the world.

Man_4

President Trump would have dropped the hammer and sickle big-time on the Fed if the dollar increased in value just a quarter of the move under Obama.

Wait…doesn’t POTUS hammer the Fed almost on a daily basis and saves his sickle for tariffs?

That’s clearly heavy-handed socialismo, in our book, folks.

Appendix

AG_Payrolls

Dollar_Trade_weighted


Posted in Manufacturing, Uncategorized | Tagged | Leave a comment

How Is That Austrian Century Bond Doing?

I guess it depends on your entry price.   The Austrian 2117 bond chart now looks like a broken stock.

We did notice during summer feeding frenzy and August highs, our bond trading buddies in Europe were pounding the table the loudest that every bond yield in the world was going to zero and beyond.   It’s always loudest at tops.

The whole negative-yielding debt fiasco was generated by a ginormous momentum trade or a greater fool theory, coupled with momentum-driven algos with no context, a dearth of low-risk fixed income securities, and ambiguity of how a new round of QE would unfold in Europe.

We wonder out loud if the proliferation of negative-yielding debt — $16 trillion and counting — would be taking place if humans and not the bots and algos were still in control of the markets?

Machines can go places where humans have never dared to venture as they have no context.  Algos in self-driving cars, for example, have no context and thus no ability to recognize a graffiti-ridden stop sign as a stop sign.

For all its impressive progress in mastering human tasks, artificial intelligence has an embarrassing secret: It’s surprisingly easy to fool. This could be a big problem as it takes on greater responsibility for people’s lives and livelihoods…

Indistinguishable changes to a stop sign could make computers in a self-driving car read it as “speed limit 80.”   – Bloomberg


Treasury_Distortion_7

No problem for a human driver even if the stop sign has more tags than a 95-year-old’s armpit.  – GMM, Aug ’19

Was the ECB going to be there to take you out of 10-year bunds yielding -2.0 percent?  That was the bet.

Keep in context the stock of negative-yielding debt is so much greater than the actual number of trades, which took place with negative yields.   Furthermore, negative yields are not equivalent to negative coupons.

Institutional investors may hold a large stock of negative-yielding bonds but how many negative-yielding bonds have they actually purchased?  Some, but probably not a whole helluva lot.

Austrian_Bond

Posted in Uncategorized | Leave a comment

Stocks Get Vertical & Vertigo

This is some chart.  Even if you assume a structural shift in valuations began when the Fed started backstopping markets after the 1987 crash, that puts the average valuation of the Wilshire Market Cap to GDP at 92.58 percent.   That’s an extremely mean regression to the mean from current levels.

Upshot? 

We are all momentum algo traders now.   When it stops, nobody knows.

Patience, grasshopper.   We wait patiently on the beach for the fever to break.

Stock prices are likely to be among the prices that are relatively vulnerable to purely social movements because there is no accepted theory by which to understand the worth of stocks….investors have no model or at best a very incomplete model of behavior of prices, dividend, or earnings, of speculative assets.  – Robert Shiller,  GMM  Dec’ 10


Stock Valuation


Posted in Equities, Uncategorized | Tagged , , , | 1 Comment

“Phase 1” Of Potemkin Trade Deal Signed, Sealed, And Yet To Deliver

PotemkinDeal

We have been busy collecting bets on the outcome of the U.S.-China Trade Deal.

We never believed for one moment that China would cave on any of the big issues, such as restructuring its economy and any deal would be just some token political salad dressing for the 2020 election.  Most importantly, it moves the needle very little in bringing jobs back to the U.S. rust belt as promised.  The global manufacturing sector is in recession — though appears to be putting in a bottom —  as a result of the administration’s trade policy and the U.S. farm belt has been devastated and may never fully recover.

But. if you know the trip to Disneyland is coming to end, its always best to stay in Fantasyland as long as possible.

So, after all the American economic carnage caused by Trump’s trade war, is the administration about to, or willing to cave on what they said were the most important issues:  1) intellectual property protection, 2) industrial policy reform?

Will Trump cut another meaningless Potemkin Trade Deal?  – GMM, Nov ’19

Socialism

Moreover, much of the deal depends on whether the Chinese will abide by Soviet-style import quotas.  Whatever happened to free markets?  Import quotas and managed trade are about as a socialist economic policy there is,  folks, except for maybe nationalizing the “commanding heights” of the economy.

We also thought “Socialism” was a big trigger word in the U.S. body politic?

But, hey, it is 1984-ish out there and even most golfers do not believe the USGA handicap system is tantamount to welfare.  In our local skins games,  the first question we ask our opponents upon moving to the next tee box is, “how many food stamps do you get on this hole.”  We do not disparage those on SNAP “as there but by the Grace of God go we.”

The deal has caused lots of pain with little gain, much like the USMCA — though USMCA was more diplomatic than economic pain as there is very little difference in NAFTA and NAFTA 2.0 (USMCA).

World Is Still Worse Off

The world — not stockholders — is worse off today than when the tariff war began as illustrated by the Peterson Institute for International Economics (PIIE) charts below.   Mr. Market was surprised yesterday that the tariffs are remaining in place?  Now that’s efficient but not surprising as he is going through one of those phases experienced about every ten years.

We are thankful, however,  the economic hostilities have momentarily ratcheted down but the game is hardly over.

We hope the World Trade Organization will reinvent itself, strip China of its developing country status, which allows for special and differential treatment, and we move back from the brink to a rules-based global trading system.

Dog Food

The following excerpt from the text of the deal exemplifies our perception:

Trade_Deal_7

How many S&P points is the above paragraph worth?

Both parties will begin discussions on China’s imports of, say, dog food?

Seriously, after more than two years of negotiations, they couldn’t even agree on dog and cat food imports?   

We fear tariffs are the new paranormal.

Trade_Deal_1

Source:  PIIE

Trade_Deal_2

Trade_Deal_4

Trade_Deal_5

Trade_Deal_6

Posted in Trade War, Uncategorized | Tagged , | Leave a comment

The New Quant Strategy

Posted in Uncategorized | Leave a comment

U.S. Treasury Borrowing & QE Forever

The U.S. Treasury recently released the December monthly statement, which put us to work crunching the data.  Note the Treasury is on an October-September fiscal year.  We are using calendar years in our analysis.

Federal Borrowing From The Public

The following chart illustrates the increasing pressure on the private markets given the spike in the U.S. budget deficit, which has almost doubled since 2016 to over $1 trillion in 2019.   It is much easier for the Treasury to float a trillion of debt during recessions or risk-off markets as haven flows are starved for riskless assets.  Supply is not an issue as demand is overwhelming.

We believe the big spike in borrowing in 2018 crowded out other markets, which put upward pressure on long-term interest rates in September causing the stock market to tumble 20 percent in Q4.  The Fed had to ride to the rescue and thus abandon its balance sheet normalization program.

In 2019, the Treasury’s borrowing pressure on the markets continued and forced the Fed to introduce it’s “not QE” policies to help calm the repo and money markets.   The long-end of the Treasury market was anchored by yield-seeking record foreign private inflows.

We are not ignoring the issue of why the Fed funds market did not help alleviate the repo rate spikes but just isolating our analysis to collateral supply and will leave the banking issues and analysis up to the experts.  At the end of the day, however, nobody really knows for certain what is going on.

Budget_1

The Supply Shock Caused By the Debt Ceiling

We have updated the following chart, which illustrates the “supply shock” caused by the lifting of the debt ceiling in August.  From January to July, the Treasury was forced by the debt ceiling to curb its borrowing and financed itself through running down its operating cash at the Fed and by other means, such as running arrears on federal pension funds.  Borrowing from the public only increased by a sum total of $113 billion during this seven month period and when the February borrowings are excluded, the Treasury took out a negative $36 billion from the public markets.

After the debt deal was signed in August, the Treasury borrowed almost $1 trillion from the public in the last five months of the year.   That is a huge supply shock, folks. Treasury officials are pretty good at managing disruptions to the markets and keeping guard of the yield curve but it does seem the budget beast is getting just too big to tame.

Such a public debt supply shock can partially explain, in our opinion,  the repo and money market turmoil and the coincidental timing of both do not go unnoticed.

Deficit_1


We don’t know but it is possible the money markets may calm down after the initial shock works through the system.  Then, again maybe not.  The Fed may be forced to buy a boatload of Bills as central banks used to hold almost 50 percent of all T-Bills outstanding.  They now hold only around 15 percent of the much larger stock, adding more pressure on the money markets.

Le Chatelier’s Principle

Another important point is that interest rates are not allowed to move to their market-clearing equilibrium levels, where the supply of loanable funds and capital meets demand for borrowing.

It’s a classic case of Le Chatelier’s principle (LCP) in action.  If one economic variable is repressed in a dynamic equilibrium system, such as prices or interest rates and not allowed to adjust to clear the market, another variable in the system will have to move to offset.  The great economist, Paul Samuelson, did his Ph.D. dissertation on LCP.  – GMM, Sept ’19

No wonder why the money markets are going batshit.

U.S. Budget Deficit

The U.S. budget deficit has almost doubled in the past three years, which is rare during a period of positive GDP growth.


Budget_2

Budget Expenditures

Note total Federal budget expenditures increased by over 7.5 percent in 2019 at a rate not seen since the GFC.

Budget_4

Budget Revenues

What surprised us about this chart was that the absolute level of budget receipts did not retain their 2007 pre-GFC levels until 2013, illustrating how ugly the economic downturn was and it deleterious impact on government revenues.  It also shows how recession and the subsequent collapse of budgetary receipts blows up the deficit.


Deficit_2

Upshot

Washington has thrown all semblance of budget discipline to the wind and, in our opinion, will increasingly have to depend on the Fed to help finance its spending without crowding out markets and tanking risk markets.   It is important to watch foreign private inflows into the Treasury market, which has already broken the annual record inflow even with only the latest data from  October.

The Treasury’s dependence on foreign savings to finance itself keeps a lid on long-term rates. Moreover,  private investors are much more sensitive to market pricing than foreign central banks, who make up 61 percent of foreign holders of close to $7 trillion in Treasury securities.   The Treasury is becoming more reliant on “hot money” flows.

Based on this analysis, we conclude the two big tail risks to monitor with respect to another public sector financing shock:  1) inflationary pressures, which could take the Fed out of the deficit financing game and spike interest rates, and 2) a reversal of foreign private inflows into the Treasury market, already at a record annual inflow of almost $350 billion as of October, which would put upward pressure on long-term interest rates.  The U.S. budget deficit in 2020 will be the equivalent of almost 90 percent of global foreign savings (current account surpluses).

Recession or slowdown fears, however,  will bring haven flows into Treasuries and repress interest rates even further.


TIC_Flows

Posted in Budget Deficit, Fed, Uncategorized | Tagged , , | 1 Comment

Inflation, Minimum Wages, Suicide, & Karl Marx

Is the rise of the global populism the result of a mismeasurement of inflation?

“Look around the world, I see small revolutions everywhere, in France with the gilets jaunes, Brexit in the UK, the election of Trump. I see a lot of angry people. You know, I grew up in France, so I had a good dose of Marx in my education. The first thing Marx teaches you is that revolutions are typically the result of inflation. Marx was wrong about many things, but he was right in that inflation is a deeply destabilizing force.”  — Louis-Vincent Gave, CEO of Gavekal Research,

Seeing lots of inflation as we enter the New Year — from milk and Subway sandwiches to big price spikes on restaurant menus.   It’s anecdotal and we have no doubt the government statisticians will find a way to massage the price hikes away.  They always do as they need to do.

Retailers Passing On Wage Costs

It now looks like retailers are passing on the relatively large increases in the minimum wage that went into effect on January 1st — between 8-15 percent in some California cities  — to consumers.

Maybe that’s partially why the stock market is going apeshit –margins are safe?

Min_Wage_2

While the federal minimum wage hasn’t changed in more than a decade — it’s still $7.25 an hour — many cities and states have adopted higher thresholds. In Arizona, Colorado and Maine the minimum wage is already $12 an hour. Minimums are higher still in California, Massachusetts and Washington state. – NPR

There is no doubt the White House will be taking a victory lap even though they had very little direct impact on the recent minimum wage increases.  The strong labor market does make them doable, however.

Moreover,  does it really move the needle for the standard of living of someone increasing their hourly salary from $12 to $13 per hour?

Apparently, for the high school and less educated it does improve mental health.   A new academic study speculates that raising the minimum wage can reduce the suicide rate for non-college educated workers,

Min_Wage_4

The new study suggests that raising the minimum wage in every US state by $1 between 1990 and 2015 could have prevented somewhere in the region of 27,550 suicides.

…the researchers estimate a 3.5-6 percent reduction in the suicide rate for every dollar increase in the minimum wage – that’s for those with a high school education or less (a group that saw 399,206 suicides between 1990-2015), with higher drops likely during periods of high unemployment.  — ScienceAlert

Binding versus Non Binding Minimum Wage

We really didn’t think the minimum wage rate was binding in California as some companies pay a much higher starting hourly wage for unskilled labor.

Recall our post from April 2018 with the photo I snapped at an In-N-Out in Marin County.


Apr24_In and Out


That’s a starting hourly wage of $16.00 to flip burgers, folks, which is close and, in some cases, more than what some high school substitute teachers make.

Min_Wage

We are economists and do believe a binding minimum wage will reduce employment, which depends more on the local labor market and small business conditions.   Because labor supply and demand curves are not observable in the real world, it’s always difficult to definitely forecast the ultimate outcome and must be done on a case-by-case basis.

Money Illusion

As I checked out at the grocery market the other night,  I mentioned to the cashier how surprising it was to see so many 10 plus percent price hikes on store items.  We then launched into a discussion about the recent increase in the minimum wage, which I perceived that it applied to her.   It wasn’t that long ago when a checker at a major grocery store was a decent middle-class job.

She responded something to the effect,

“A lot a good the wage increase is going to do, if we have to pay higher prices for food and other things.”  

She sounded like an economist pontificating on real wages!  She may not formally understand the laws of economics but sure acts as if she does.   Sorry, Noah, I still like Friedman’s pool player/physics analogy.

Inflation

If there is anything that will blow up the huge global bond market bubble, which will then torch the stock market bubble, it will be the realization that inflation is on the rise.  Mr. Market has been so gaslighted into thinking there is no inflation and that deflation lurks behind every 5 percent correction in the S&P500.  He has to believe, however, as the perception of this bull market’s longevity depends on it.

Because the market believes this, the Fed has to do it’s rain dance the central bank will ride to the rescue of every market downturn an extinguish the perception of an imminent deflationary economic collapse.  There doesn’t appear a path of extraction from this silly policy as the markets and central bank relationship is far beyond the tipping point and now exorbitantly linked.

We have been preaching, pounding the table, and debating for years that the official inflation numbers do not reflect life in the real world.  The government has a big incentive to keep the inflation rate low as 50 percent of Americans are dependent on government entitlement programs, many of which have cost of living adjustments (COLA) linked to the change in the CPI index.    Higher inflation = bigger deficits.

Karl Marx On Inflation

We were very pleased to have stumbled upon an interview with Louis-Vincent Gave, CEO, and co-founder of Gavekal Research last October.  Gave is one smart dude and he confirmed our suspicions, and then some,

I don’t buy the argument that we have deflation everywhere.

Why not?

Look at the median CPI in the US: It’s at a ten year high. Look around the world, I see small revolutions everywhere, in France with the gilets jaunes, Brexit in the UK, the election of Trump. I see a lot of angry people. You know, I grew up in France, so I had a good dose of Marx in my education. The first thing Marx teaches you is that revolutions are typically the result of inflation. Marx was wrong about many things, but he was right in that inflation is a deeply destabilizing force. We are being told today that there is no inflation, but if you take a basket of the 72 most bought items at Walmart, the price of that basket is up 4,8% year on year. So, if you are among the poorest people in America and you buy your Walmart items, your cost has gone up 4,8%, while your wages go nowhere. Should we be surprised that people are angry?  –  TheMarket

There are a lot of gems in this interview, folks, and we encourage implore you to give it a thorough read.

Prices In The Real World

If you want a good idea of what real prices on real things and real services are really doing in the real world follow the Chapwood Index,

The Chapwood Index reflects the true cost-of-living increase in America. Updated and released twice a year, it reports the unadjusted actual cost and price fluctuation of the top 500 items on which Americans spend their after-tax dollars in the 50 largest cities in the nation.  – Chapwood Index

Min_Wage_3

Bill Fleckenstein @fleckcap


Stay tuned, folks, we will be pounding the table even harder in 2020.

Just a heads up.  The Global Macro Monitor will soon be moving to a subscription-based model, which will restrict some premium posts to subscribers only.   We have researched and thought long and hard about the fee.  We have many readers from weak currency countries and don’t want to price them out.   We are contemplating a low monthly nut of, say,  around $10, which is fair and should attract enough subscribers to make it worth our time.  Free to $10 is inflation, no?  Stay tuned.  

Posted in Bonds, Inflation/Deflation, Uncategorized | Tagged | Leave a comment

COOLEST TECH at CES 2020

Posted in Uncategorized | Leave a comment

QOTD: War And Truth

QOTD – Quote of the Day

In war, truth is the first casualty. – Aeschylus

Posted in Uncategorized | Leave a comment

U.S. Troop Levels In Iraq

Great graphic from Stratfor, who, BTW, is running a great subscription deal.  You’re gonna need some good geopolitical analysis in 2020.  That we can be certain.  See here.

It seems like Mr. Market is the only one who didn’t see the Iranian retaliation coming.

EMH* über alles!   NOT!

Godspeed to our soldiers.

* Efficient Market Hypothesis


US Troop Levels In Iraq

Posted in Uncategorized | Leave a comment