Summary
- Last Friday’s nonfarm payrolls exceeded expectations with the first four months now averaging 205k jobs created, right on the monthly average since October 2011
- The employment data is moving the other way, however, falling 103 in April and has come in negative three of the first four months of the year
- Though a monthly positive nonfarm payroll number has coincided with a negative employment number around 19 percent of the months since 1990, three out of four consecutive months is a novelty
- This may be the result of the fact that nonfarm payrolls are not capturing the pain in the agricultural sector and the potential shrinkage of the informal labor market due to the crackdown on immigration
- The employment-population ratio came in at a little under 61 percent in April, still well below its April 2000 peak and the local high just before the Great Financial Crisis (GFC)
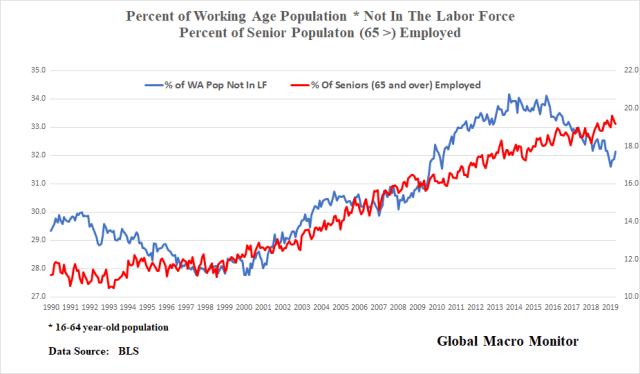
- Demographics may explain part of the failure of the employment-population ratio to make new highs but even the percentage of employed 16-64 year-olds has yet to capture the high just before GFC
- Seniors, the 65 years and older cohort group, are remaining in the workforce at a greater pace with more than 70 percent more seniors now employed than before the GFC. This compares to just around 5 percent for the 16-64 year-olds
- The percentage of the senior population now employed has increased from around 10 percent in the 1990s to close to 20 percent. We suspect much of it has to due to the lack of adequate retirement savings
- The unemployment rate is a very flawed statistic, especially when comparing two-time points in the economy
Last Friday’s payroll data blew out expectations with a monthly gain of 263 new jobs yet employment fell again by 103k, the third decline over the past four months. This is the first time in our database, which begins in 1990, that a positive monthly payroll number had an opposite sign of the employment data in three of four consecutive months.
That should make all of us sit up and listen.

In fact, during 2019 nonfarm payrolls have increased by 820k — nothing spectacular, by the way — averaging 205k per month, which is right on the monthly average since October 2011, all while total employment has fallen by 300k. What is impressive about the payroll growth is that most believe the pool of surplus labor is becoming increasingly shallow.
Why The Divergence?
Our priors are that nonfarm payrolls are not capturing the extreme pain currently taking place in the farm belt. Whereas the ag sector is included in the employment data.
“Even if the trade war ends, with this oversupply of corn and soybeans and wheat, we’re still going to have low prices,” Grassley said in an interview. Separately, the U.S. House of Representatives’ Agriculture Committee plans to hold a hearing on May 9 to review the rough Farm Belt economy.
So far this year, personal income for farmers is down 25 percent, the steepest decline since the first three months of 2016, according to an April 29 Commerce Department report. Regional banks, meanwhile, are holding their own.
…For farmers, more pain may be ahead. The Federal Reserve Bank of Kansas City last month said farmland prices may decline, and owners may receive lower returns on capital invested. That’s a change from the early stages of the downturn, when farmland values were relatively stable, and served as an attractive source of collateral for loans. — Bloomberg, May 3

Not certain if it can entirely explain such a large divergence, however.
Comparison of CES and CPS Surveys
The nonfarm payroll data are collected using the Current Employment Statistics (CES) survey, commonly known as the payroll survey and do not count the farm sector. The employment data does and is collected using the Current Population Survey (CPS) and is known as the household survey, which is also used to calculate the unemployment rate.
There are several differences in the methodology of the two surveys. Most important, the payroll survey not only excludes the agricultural sector but also the self-employed. Moreover, multiple jobholders are counted for each job. That is if a person holds three jobs, all three jobs are counted in the payroll surveys whereas it would only count once in the household survey.

Historically the two measures of the labor force track fairly well.
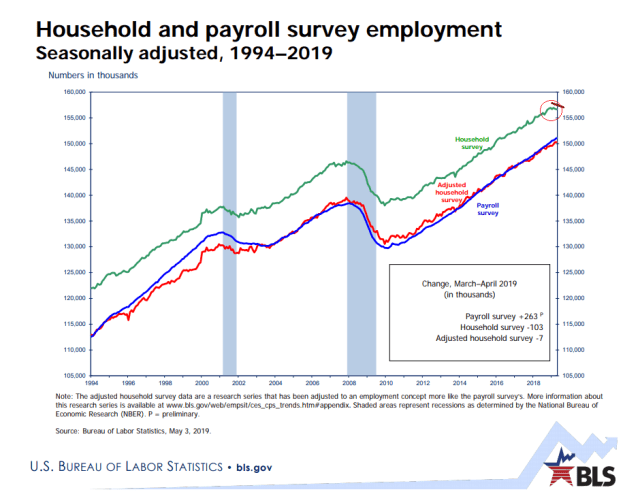
The chart below illustrates the ratio of the nonfarm payrolls to employment has remained in a range of around .92 to .97 since 1990, with the April number, .965, closing in on its high.
During two of the three expansions since the 1990-91 recession, the ratio moved higher. We’re not certain why the ratio declined during the expansion in the first decade of the century but suspect it had something to do with the housing bubble. Everyone and their mother turned into commission only real estate agents, jobs not counted in nonfarm payrolls. Nor are start-ups or the informal labor market.
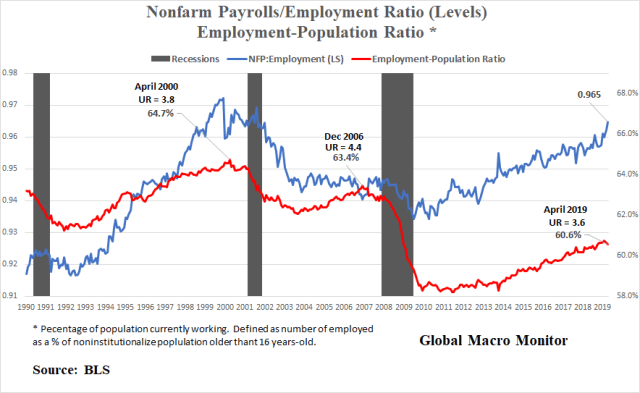
Employment-Population Ratio
The chart also illustrates the Employment-Population Ratio, the percentage of the working population 16-years and older that is employed. Interestingly, the ratio peaked in April 2000 at 64.7 percent when the unemployment rate was at 3.8 percent.
The percentage came in at 60.6 percent in April, much lower than the 2000 peak and even well below of pre-GFC peak of 63.4 percent in December 2006, when the unemployment rate was 4.4 percent.
What’s up with that? Isn’t this the greatest economy ever?
Demographics?
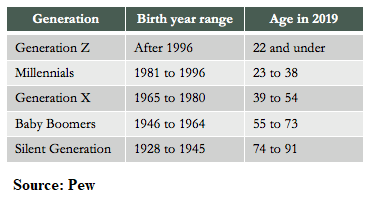
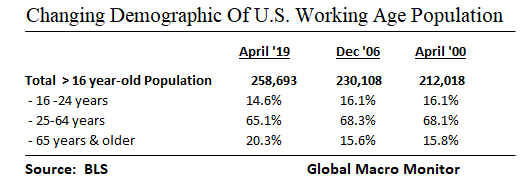
Some of it can be explained by simple demographics.
The table below illustrates how the U.S. population is aging and the proportion of the working-age population (16-64) is declining.
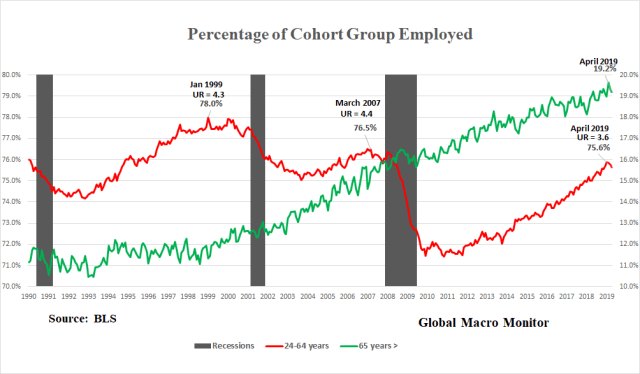
Even still, the percentage of the working-age population that is employed is lower than what it was before the GFC (see chart below).
We were also really surprised that the data so strongly confirmed our suspicions that seniors — the older than 65 years cohort group — have almost doubled their employment as a percentage of their rapidly growing population from around 10 percent in the 1990s to around 20 percent in the April data.
The growth of employed seniors 65-years and older since the month before GFC began is nothing less than stunning, 73.4 percent more seniors are employed versus only 5.4 percent for the 25-64-year-old cohort group. Kind of depressing that a growing number of older folk can’t retire and go fishing.
We will be out with more in-depth analysis soon but the participation of more seniors in the labor force, many who are probably forced to work due to a lack of adequate requirement savings, has increased the size of the labor pool.
Couple this with the fact the percentage of the employed working-age population has still yet to reach the pre-GFC and all-time highs, the surplus labor pool is probably much larger than most have estimated and explains the punk growth in wages.
Unemployment Rate
Given our analysis above, how is it that the unemployment rate is at a 50-year low? We suspect it is the quirkiness of how participation in the labor force is measured.
What are the basic concepts of employment and unemployment?
The basic concepts involved in identifying the employed and unemployed are quite simple:
- People with jobs are employed.
- People who are jobless, looking for a job, and available for work are unemployed.
- The labor force is made up of the employed and the unemployed.
- People who are neither employed nor unemployed are not in the labor force.
Who is counted as unemployed?
People are classified as unemployed if they do not have a job, have actively looked for work in the prior 4 weeks, and are currently available for work. Actively looking for work may consist of any of the following activities:
- Contacting:
- An employer directly or having a job interview
- A public or private employment agency
- Friends or relatives
- A school or university employment center
- Submitting resumes or filling out applications
- Placing or answering job advertisements
- Checking union or professional registers
- Some other means of active job search
Who is not in the labor force?
As mentioned previously, the labor force is made up of the employed and the unemployed. The remainder—those who have no job and are not looking for one—are counted as not in the labor force. Many who are not in the labor force are going to school or are retired. Family responsibilities keep others out of the labor force. Since the mid-1990s, typically fewer than 1 in 10 people not in the labor force reported that they want a job.
A series of questions is asked each month of persons not in the labor force to obtain information about their desire for work, the reasons why they had not looked for work in the last 4 weeks, their prior job search, and their availability for work. These questions include the following (the bolded words are emphasized when read by the interviewers).
- Do you currently want a job, either full or part time?
- What is the main reason you were not looking for work during the last 4 weeks?
- Did you look for work at any time during the last 12 months?
- Last week, could you have started a job if one had been offered?
These questions form the basis for estimating the number of people who are not in the labor force but who are considered to be marginally attached to the labor force. These are individuals without jobs who are not currently looking for work (and therefore are not counted as unemployed), but who nevertheless have demonstrated some degree of labor force attachment. Specifically, to be counted as marginally attached to the labor force, they must indicate that they currently want a job, have looked for work in the last 12 months (or since they last worked if they worked within the last 12 months), and are available for work. Discouraged workers are a subset of the marginally attached. Discouraged workers report they are not currently looking for work for one of the following types of reasons:
- They believe no job is available to them in their line of work or area.
- They had previously been unable to find work.
- They lack the necessary schooling, training, skills, or experience.
- Employers think they are too young or too old, or
- They face some other type of discrimination.- Bureau Of Labor Statistics
We also suspect the national opioid crisis is reducing, and/or participation in, the labor force thus having, at the very least, a marginal reduction in the unemployment rate. We have yet to find a study that quantifies the effect but are still searching. Nevertheless, the unemployment rate by definition must be lower on the margin even the working age population is affected.
Opioid addiction costs many lives, harms livelihoods, depresses labour market participation, and entails significant public healthcare spending. Death rates have surged in the past decade, particularly as (illicit) synthetic opioids have become more available around the country. The correlation with nonparticipation in areas most beset by opioid addiction suggests that addiction ultimately impairs participation. – OECD, 2018
Measures Of The Unemployment Rate
Of course, there are different measures of the unemployment rate.
U3 is the official unemployment rate. U5 includes discouraged workers and all other marginally attached workers. U6 adds on those workers who are part-time purely for economic reasons. The current U6 unemployment rate as of April 2019 is 7.30 percent. – Macrotrends
Nevertheless, we view the U3 unemployment rate as pretty much useless as a comp indicator across time due to the vagaries in measuring the labor force though it does give a crude measure of the health of the labor market. Comparing the unemployment rate across different years is meaningless, in our opinion.
It is like the old baseball stats that are similarly meaningless but just won’t die.
As a statistic, RBIs were not only misleading but dishonest. They depended on managerial control, a hitter’s position in the batting order, park dimensions and the success of his teammates on getting on base ahead of him. – Branch Rickey
The RBI stat is responsible for more bad postseason award decisions than any other single factor in baseball history…RBI just don’t tell us anything useful about a player’s individual performance in a game, a season, or a career, but they remain prevalent in the minds of writers and fans. – Smart Baseball
The BLS and the National Income and Product Accounts could use some updating and Sabermetrics.
Upshot
It’s always prudent to dig deeper, go beyond the headlines and look under the hood, folks. Never so true in our post-Truth, alternative facts, and spin to win bullshitting era.
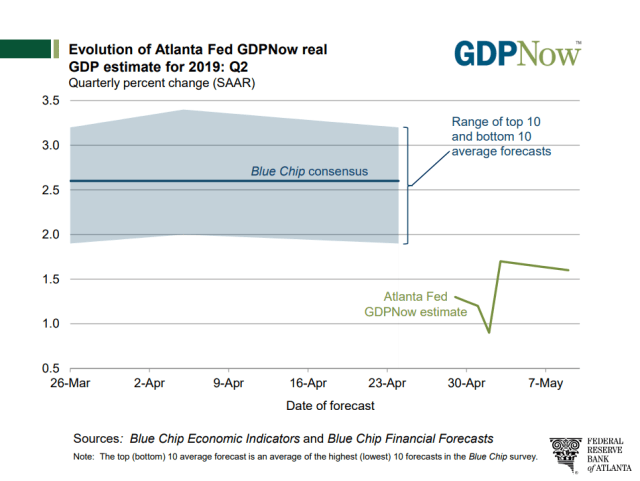
We were one of the first out with our skepticism about the 3.2 percent Q1 GDP print.
The number was much weaker than it appeared.
Private domestic demand (also known as real final sales to private domestic purchasers) –personal consumption + nonresidential and residential fixed investment – which is the traditional driver of robust and sustained economic growth contributed less than 35 percent to Friday’s headline growth number. This was the lowest proportional level since Q4 2009.
The bulk of GDP growth came from the combination of a big inventory build, net exports, and government spending (see table below).
…Empirical probabilities suggest that Q2 economic growth will be significantly lower than Q1 with the high likelihood of the final reading of growth in the quarter will be lower than the initial print. — GMM, April 28th
A few days later, a friend sent us this,
To Morgan Stanley’s economists, a lot of the boost can be explained by an unexpected surge in inventories (adding a 0.44 percentage point increase to GDP), a surge in net exports (1.2 point), and larger government spending (0.4). They didn’t view this as sustainable and are expecting the growth pace to slow to 1.1% in the second quarter, ending June 30. – Chief Investment Officer
The Price Of Gas
I showed some dude in a beer pub yesterday a picture to prove a point in a discussion we were having. He instantly retorted the picture was fake. It was shocking as much as it was depressing. We are losing all basis for meaningful dialogue. Facts don’t matter as many are increasingly becoming to believe facts don’t even exist.
We are losing our culture and country.
As a consequence, the price of gaslighting has never been lower and never so effective.
Gaslighting is a form of psychological manipulation that seeks to sow seeds of doubt in a targeted individual or in members of a targeted group, making them question their own memory, perception, and sanity. Using persistent denial, misdirection, contradiction, and lying, it attempts to destabilize the victim and delegitimize the victim’s belief. – Wikipedia
If this is the greatest economy of all-time, why does it feel so shitty and why are so many so angry?
Furthermore, it’s only a matter of time before our national economic data is labeled fake news and the product of manipulation by the “deep state.”
Dig deeper and sharpen your pencils, folks.