MADA!
This high school pitcher chose to hug his childhood friend instead of celebrate his championship-clinching strikeout.
Story: https://t.co/omJqeRk899 pic.twitter.com/gIP5OFHTcp
— Sports Illustrated (@SInow) June 11, 2018
We are not discussing any proposal to exit the euro. The government is determined to avoid the materialisation of market conditions that push us towards an exit in any way. – Giovanni Tria, Italian finance minister, June 11
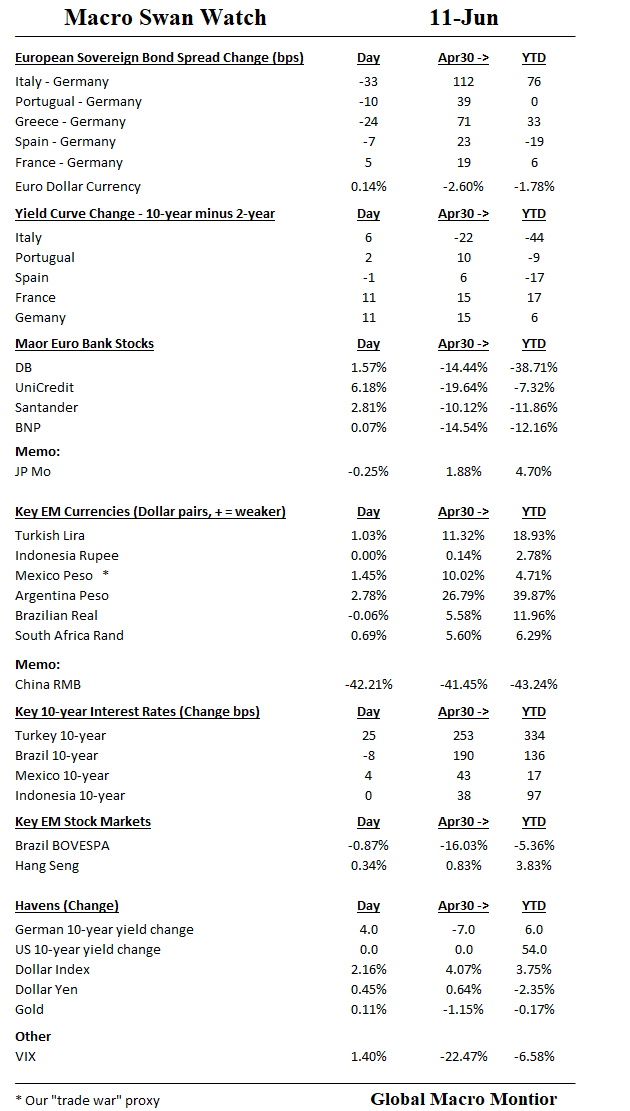
Italian and Euro periphery assets recovered today on the back of euro positive comments by the new Italian finance minister (see above). Italy’s 10-year sovereign spread in big by 33 bps against the the Bund with the curve steepening by 6 bps. Unicredit up over 6 percent.
BNP and other French bank lagged as the the government signaled the country’s banks need to raise additional capital. European banks still woefully undercapitalized.
EM
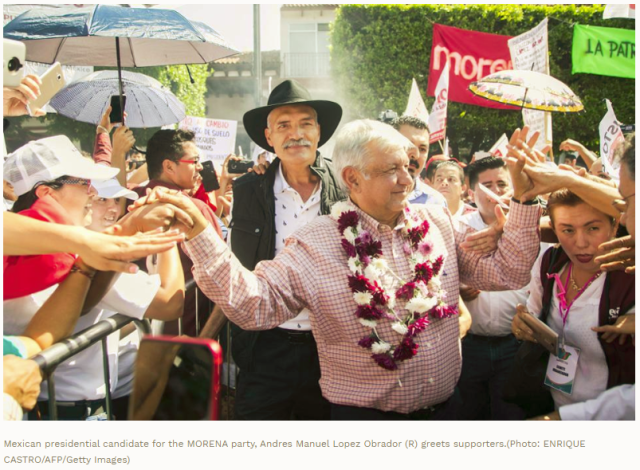
EM currencies remain under pressure as the focus now turns to Mexico’s presidential election on July 1. BMI research is now giving the lefty candidate, Andres Manuel Lopez Obrador (AMLO), a 90 percent of becoming the next president of the United Mexican States. Watch how this picture unfolds.
Very interesting lecture by game theorist Bruce Bueno de Mesquita. Money quote: “Not pie in the sky to use rigorous logic and evidence…to have an affect on really hard policy questions.” Game theory.
Nice story about Honest Abe,
“Abraham Lincoln founded the National Academy of Sciences. Abraham Lincoln was also the first attorney to make a statistical argument in front of the Supreme Court to buttress his economic claims, which were correct, that keeping bridges over the Mississippi to allow the railroad to pass over the river was economically more important than protecting paddle wheel steamers. ” – Bruce Bueno de Mesquita, 1:08 minutes
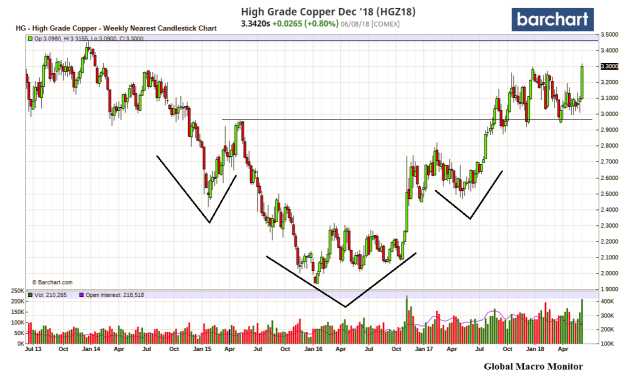
Classic inverse head & shoulders pattern for the weekly nearest copper futures chart. The break out above 2.961 puts a measured move to 3.94 in play, which is about 20 percent above the current level. The next big number for upside resistance is 3.466.
A new bull market for copper? Stay tuned.
This software enables computers to understand human emotions and turn them into actionable insights. Here’s how it works. – MarketWatch
Trump gave “a long, frank rant”, the official said, repeating a position he carried through the 2016 U.S. election campaign into the White House that the United States had suffered at the hands of its trading partners, with French President Emmanuel Macron pushing back on the assertion and Japanese Prime Minister Shinzo Abe chiming in.
It was a “a long litany of recriminations, somewhat bitter reports that the United States was treated unfairly,” said the French official, who spoke on condition of anonymity. “It was a difficult time, rough, very frank.” – Reuters
Washington is pushing for the complete, verified and irreversible dismantlement of North Korea’s nuclear capabilities. Achieving this would require much more than the removal of weapons
► Subscribe to FT.com here: http://bit.ly/2GakujT
Summary