Picture of the Day: Today’s Market Action

(click here if picture is not observable)

Posted in Cartoon of the Day, Chart of the Day | Tagged | Leave a comment

Assessing the Risks of French Banks

(click here if video is not observable)

Posted in Black Swan Watch, Equities, Euro, PIIGS, Sovereign Debt, Sovereign Risk | Tagged , | Leave a comment

Chart of the Day: The World’s Largest Employers

Great graphic from the Economist.  Note that 7 of the 10 are government-run.  Amazing WalMart employs almost as many as the People’s Liberation Army.   Gives new meaning to the “Human Wave Theory.”

(click here if graphic is not observable)

Posted in Chart of the Day, Uncategorized | Tagged , , , | Leave a comment

Buying the Moody Blues…

Classic sell the rumor, buy the fact trading action.  Within an hour after Moody’s downgrade of the French banks almost all the major global equity indices have turned up.   S&P futures were down almost 16 points and are now down just 1.6 one hour into the European open.  Let’s see how long it lasts, but it is usually the case when the ratings agencies show up it’s time to move on.

A lot of negative news is already priced, though certainly not Armageddon.  If the Four Horsemen of the European Apocalypse don’t show up soon, those who have positioned for the worst case are going to have to square up.  Stay tuned.

Posted in Black Swan Watch, Global Stock Performance, Global Trend Indicators, Sovereign Debt, Sovereign Risk | Tagged , , | Leave a comment

Europeans spooked by spectre of Greek default – Euronews

(click here if video is not observable)

Posted in Black Swan Watch, PIIGS, Video | Tagged , , | Leave a comment

Apple in Bullish Pennant Fight

We ask once again, “Will Apple Win the Pennant.”   Note the stock’s  bullish pennant formation and that it has been holding and now clear of its 50-day moving average.   Lots of bullish chatter today from Julian Robertson saying the valuation is ridiculously cheap and the stock would by 3-4x higher if this were the 1980’s.  Morgan Stanley was also out today noting the company will likely return some of its $76 billion cash to shareholders.

Furthermore, the company is close to a new product release in the iPhone5.  It’s now or never for the stock to break to new highs.   Apple could provide the leadership for the U.S. market or move higher on its own.   The risk is that the macro swans spoil the pennant race.   Place your bets, you know which side of the ship we’re on.

(click here if chart is not observable)

Posted in Apple | Tagged , | 5 Comments

The Current State of the Market in a Sea of Volatility

The picture below really captures the volatility of the current market and how traders must remain detached like the Coast Guard cutter closely monitoring how the ship (market) is listing.  When too many are standing on one side of the ship (market) due to fear certain events will take place,  the safest short-term bet is usually the other side.  The current market volatility illustrates this point.

The real world is much more complicated, however,  as we cannot see the ship and must guess how the bulk of the fast money is positioned.   Are most traders bullish or bearish, long or short?   And what is the probability the event they’re betting on going to be realized in the near-term?

Will Greece go to the drachma over the weekend?  Will a French bank fail in the next week?  Will Italy experience a failed bond auction?  Will Angela Merkel announce Germany is leaving the Euro?  In a loud emotional market it’s not easy to maintain the discipline to ask:  What is the event probability and how is the jet set positioned?

This raises the real issue about trading and investing.  Nobody but the crooks, who trade on inside information,  knows the future for certain.  George Soros says markets move from perception to reality back to perception and sometimes market perception can determine reality though destabilizing feedback loops.

We believe this is the state of the current market.  The markets fear a Eurozone sovereign default and that some banks are not adequately capitalized to weather such an event and there is potential for mass global contagion.  Eurozone leaders tell us this is flawed perception and does not reflect reality.

The markets are not listening, however,  and reducing funding to those institutions,  some,  of which, were the largest financiers of the sovereigns who are also experiencing funding problems.  The doom loop continues until it doesn’t or until a comprehensive credible plan is announced.  But this takes bold leadership.

We hope the Germans understand this and do what it takes to restore confidence as the current state is unsustainable.   If they don’t, the ship will capsize and the fast money, which has the staying power to ride out the volatility, and the short selling traders the Eurocrats despise so much, will become rich betting on their incompetence.   Stay tuned.

(click here if the picture is not observable)

Posted in Black Swan Watch, Euro, Fiscal Policy, Global Stock Performance, Monetary Policy, PIIGS, Sovereign Debt, Sovereign Risk | Tagged , , , , , | 2 Comments

Cartoon of the Day: The New Bond Salesman

A friend of ours, “Countrywide”, named for the girth of his posterior, who works at a major asset management firm,  sent this over yesterday.  He says the dude holding the sign looks like the Goldman Sachs bond salesman who covers him.   Those guys (and sometimes gals) will do almost anything to sell you bonds! Hat tip to “Countrywide” CB!

(click here if cartoon is not observable)

Posted in Cartoon of the Day | Tagged , | 4 Comments

Is the U.S. Becoming Japan?

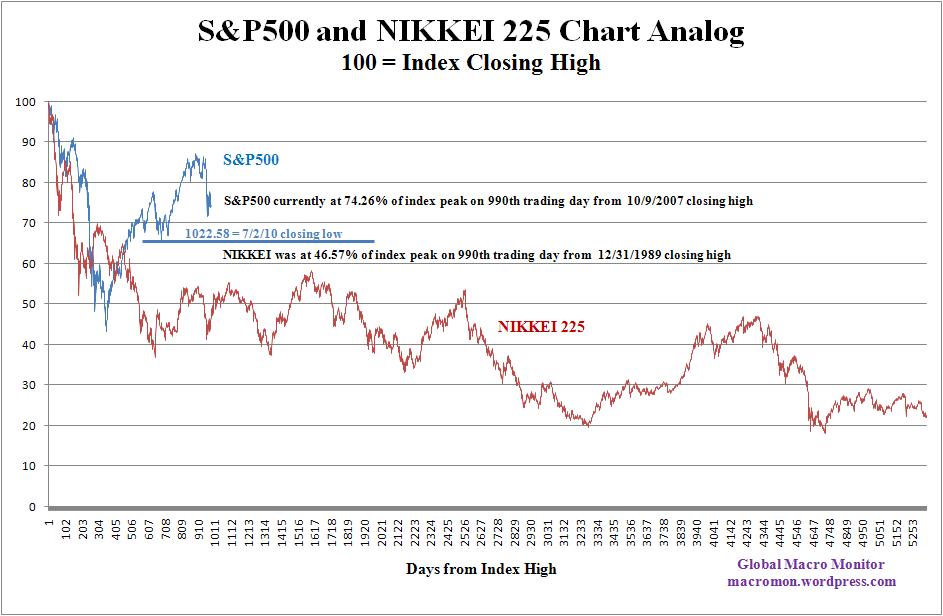
As Treasury bond yields tumble to record lows we’re hearing lots of talk the U.S. is following the economic trajectory of Japan.  Not so fast!   Take a look at the following chart.

After 990 days trading days from peaking, the S&P5oo closed today at 74.26 percent of its October 2007 closing high of 1565.15.    On the 990th day from its peak, the NIKKEI was only 46.57 percent of its closing high made on December 29, 1989.   The chart shows the S&P initially fell and rallied harder than the NIKKEI and how important it is the July 2010 closing low of 1022.58 holds.

It is also stunning to see that after 5,337 trading days from its peak, the NIKKEI currently sits at just 21.94% of the 38,916 closing high.   We can’t fathom an America and its resultant social mood and political angst, not to mention our own capital,  if the S&P500 is only 21.93 percent of its closing high twenty-two years after peaking.   That, by the way, would put the index at 343.29 in the year 2029.  No, that’s not a typo.

The Japanese are one resilient people and no wonder they have the world’s largest net international investment position, which is also one of the main drivers of the strong yen.

We remember the days of “peak Japan.”  Many cash strapped sovereigns, such as Mexico, Brazil and Venezuela,  hitting up the country that was going to dominate the next century for funds to finance their Brady Plan restructurings and to help restore confidence to their debt-ridden economies.   Sound familiar?

(click here if chart is not observable)

Posted in Black Swan Watch, Bonds, Budget Deficit, Equities, Fiscal Policy, Global Stock Performance, Sovereign Debt | Tagged , , , , , , | Leave a comment

Golden Falters

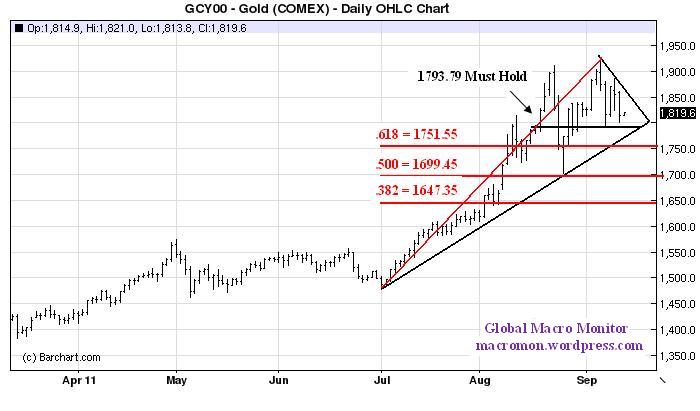
Gold’s 30 percent parabolic move from July 1 to September 6 is beginning to falter.   Maybe the yellow metal is just out of gas and needs to consolidate a little or maybe it’s something bigger, such as the liquidity issues in the European banking system.

Whatever the case,  1,793 needs to hold or the Fibs of the big move come into play.   The 50 percent retracement at around 1,700 coincides with the August 25 low of 1,703 and is also where the river meets the waterfall.   A close above 1,900 clears the path for the bulls.  The battle is about to get very interesting.  We’re flat and happy to be watching.   Ladies and gentlemen, “let”s get ready to rumble!”

(click here if chart is not observable)

Posted in Commodities, Gold | Tagged , , , | Leave a comment