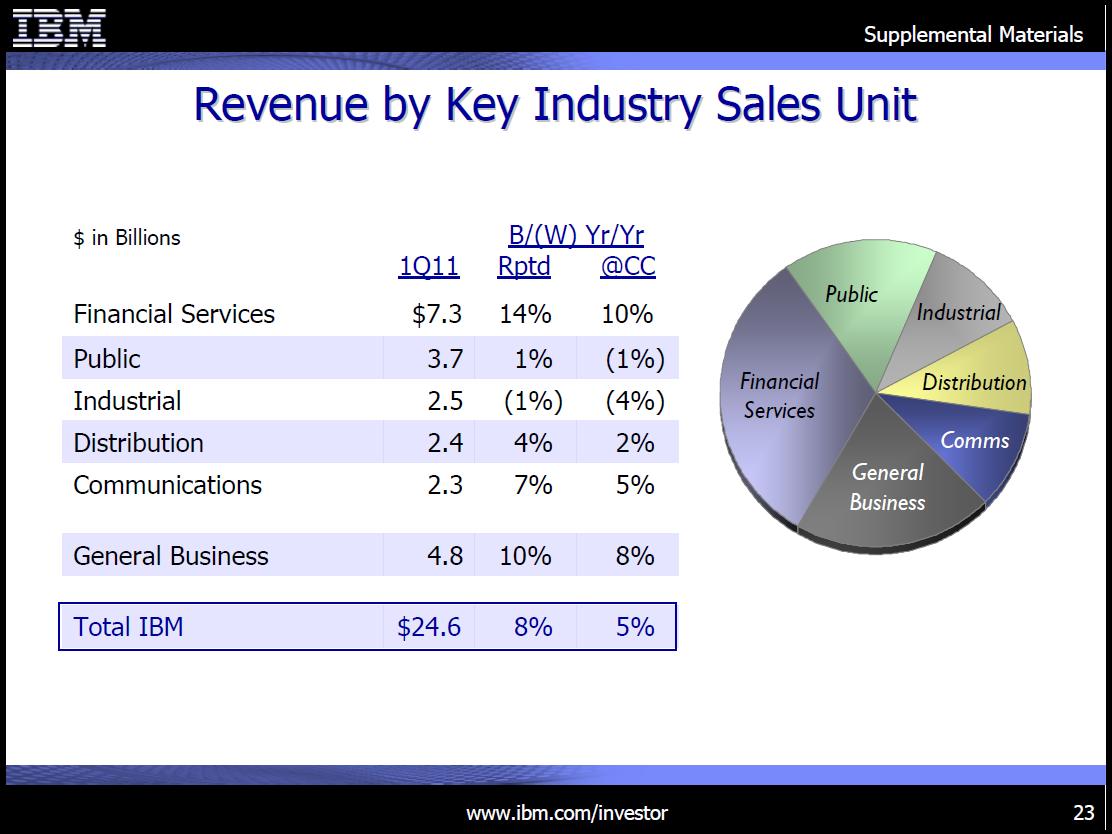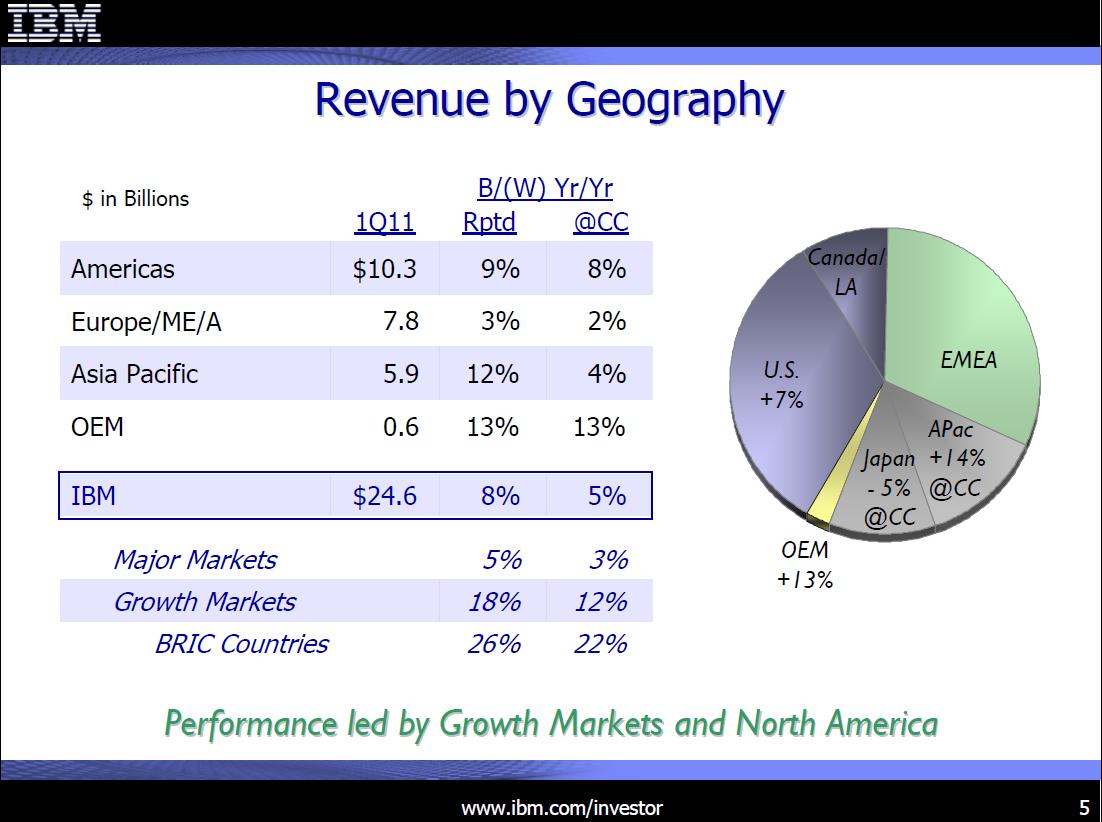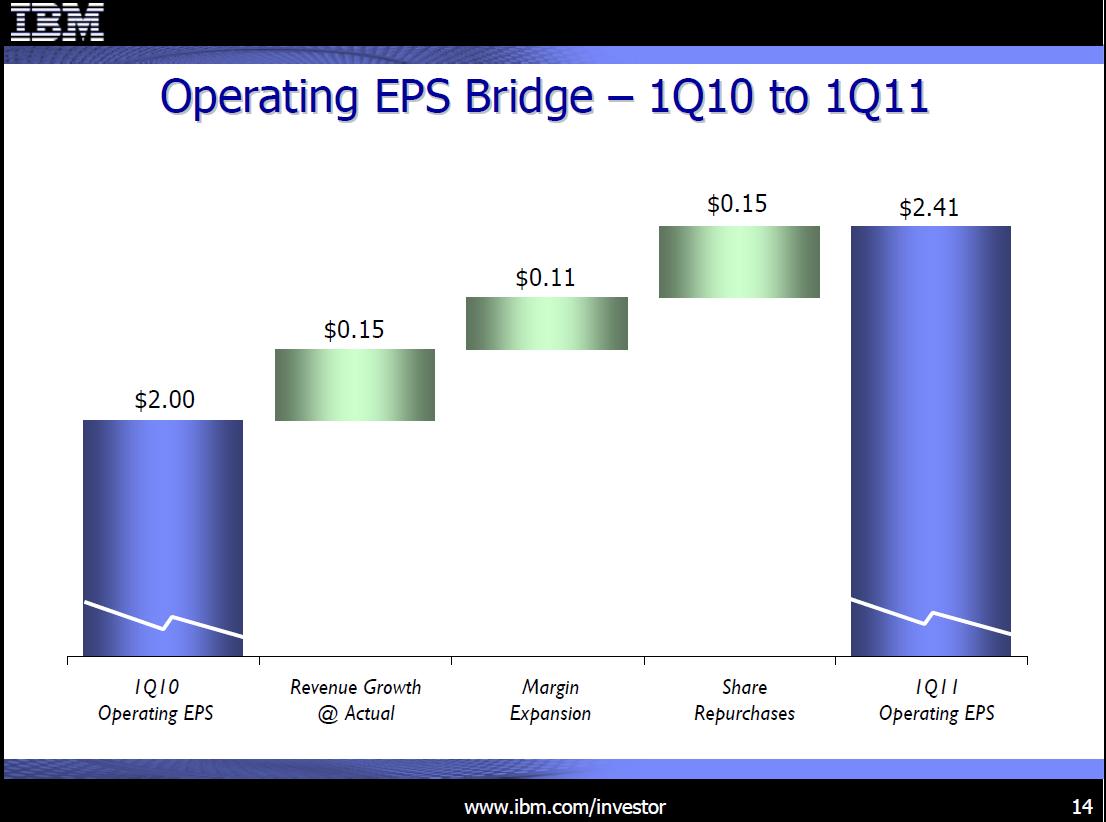
Key Charts from IBM Earnings

Wild trading in IBM in the after hours session.  The stock traded up almost to $170 a few minutes after earnings were announced then down to almost $160.  Strong numbers but apparently traders were not happy with the signings.  (click here if charts are not observable)

Posted in Earnings, Technology | Tagged , | Leave a comment

Quote of the Day: Europe in the True Finn Soup

Something new is going to happen and that’s very good because these bail-outs clearly have not been working. – Timo Soini, leader of the True Finns

Posted in Quote of the Day | Tagged , , | Leave a comment

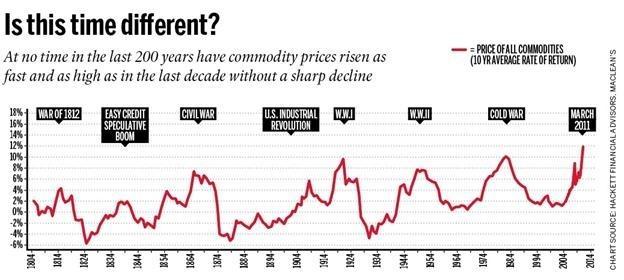
Week in Review: Is This Time Different?

Not much to say tonight and will point you to a great chart sent to us by our friend Jim Miller.   Is it really different this time or are we at the height of a commodity bubble which is about to burst?

In in the midst of all the inflation hysteria, we note potential deflationary forces are starting to resurface — China tightening/hard landing concerns;  European Debt Default;  ECB tightening;   potential U.S fiscal and monetary drag;  commodity relative price increases and real wage depression.    We seem to be caught in some type of inflation/deflation oscillation, which is causing traders to be whipsawed.   Take a look at last week’s deflationary performance in charts below.

We’re not sure where where this is headed but the end game will depend on the policy responses, which are becoming increasingly limited and constrained, in our opinion.

Apple broke its $330 support level at the end of trading on Friday, following Google down, which fell over 8 percent and is now down over 10 percent for the year.    Apple reports on Wednesday and will give key direction to the market, in our opinion.     We’re not liking what we’re seeing and no mood to take on risk here.   (click here if charts are not observable)

Posted in Week in Review | Tagged , , , | Leave a comment

Urban Mining Gone Wild

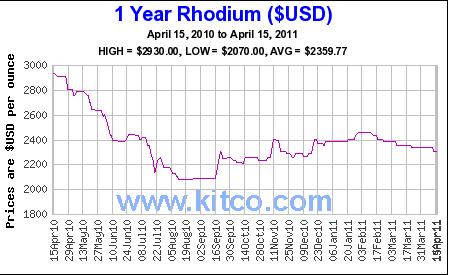
The increase in theft of catalytic converters is really starting to make headlines across the country.  Toyota SUVs and trucks appear to be the prime targets as their catalytic converters contain more of the three precious and rare earth metals the thieves are targeting:  1) platinum, which sells for $1,785 an ounce;  2)  palladium, which sells for $765 an ounce; and 3) rhodium, which sells for $2,300 an ounce.   SUVs are the auto of choice due to greater ground clearance and ease of dislodging the exhaust system.

Urban mining by the new land pirates.

Related Headlines

El Dorado County sheriff reports catalytic-converter thefts spike – Sacramento Bee
Brazen thieves target truck exhaust systems across Sonoma County – Press Democrat
Catalytic converter thefts 
on rise, costing local drivers – Middletown Journal
Boy Leads Police on Chase, Rash of Catalytic Converters Stolen – Shelby-Utica Patch
Precious metals prices tied to catalytic thefts – Vancouver Sun

Posted in Commodities, Gold, Rare Earth Elements, Technology | Tagged , , , | 2 Comments

The Weekend Read

IT LOOKS like a planetary tattoo designed to be seen from space, a vast set of concentric circles inscribed in the skin of southern California’s desert. Ground was broken on the Ivanpah power plant, which is to be one of the biggest solar installations in the world, last October. Already, some of the rings of mirrors which will eventually concentrate acres-worth of desert sunshine on to collectors perched atop 140-metre-high towers are in place. And as of this week, so is the financing.  – Economist

China
China Net Seller of U.S. Treasurys in February – WSJ
China’s Inflation Accelerates, Adding Pressure – WSJ
Chinese companies go on global bond spree – FT
Moody’s cuts China property outlook to negative – Market Watch

Commodities
Oil-Price Shock Is Hitting American Consumers Hardest – CNBC
Peak Fish and Other Insights from Agriculture 2.0 – Reformed Broker
Swan: Commodity prices on Australia G-20 agenda – MarketWatch

Currencies
Investors Lose Appetite for Dollar – WSJ

Economics
Euro Zone Posts Record Monthly Inflation – WSJ

Emerging Markets
Brics Group Warns on Capital Flows – WSJ
Emerging markets inflation surges – FT

Euro Debt Crisis
Anger begins to infect Europe’s prosperous core – FT
Finland Could Block Portuguese Bailout – CNBC
Germans plan for Greek debt shake-up – FT
Ireland Gets the Moody’s Blues – WSJ
Is Germany bailing out euro-area countries to save its own banks? – Economist

Markets
High-frequency boom time hits slowdown – FT
How to forecast a stock-market top – MarketWatch
Market Outlook Negative Both Technically And Fundamentally – Comstock Partners
Mutual funds inflows of $8.9 billion in the latest week, ICI  – WSJ
Treasurys’ Strength Could Amaze Naysayers – WSJ

Monetary/Fiscal Policy
Are public sector pensions broken? – CNBC
California’s Governor Brown Seeks Vote on Taxes in Fall – WSJ
Federal Reserve’s path of destruction – David Stockman – MarketWatch
Obama lays out deficit-cutting vision – Market Watch
US lacks credibility on debt, says IMF – FT

(click here if picture is not observable)

Posted in The Weekend Read, Uncategorized | Tagged , , , , | Leave a comment

Euro Fracture: Foreign Bank Exposure to GIPs

Great chart from the Economist of foreign bank exposure to Greece, Ireland, and Portugal (GIP) and explains why “restructuring” is so taboo with European policymakers.

The Greek sovereign credit curve is inverted with the 2-year now yielding around 18 percent and the 10-year with a 13 percent handle the last time we checked.  The inversion is usually a signal of default as investors/traders start worrying more about absolute price of the bond and potential downside rather than yield.    A bond trading at 97, for example, which matures at par (100) in 30 days yields over 35 percent on and annual basis.   A 5 percent coupon 1o-year bond trading at 55 has an annual yield of 13 percent.   Note which bond has more downside if the issuer defaults and the recovery value is, say, 45.   Witness the inversion.

We’re not so sure global markets will yawn if Greece defaults and are much too complacent (x/ gold) with what is happening in Europe, in our opinion.    Stay tuned.

(click here if chart is not observable)

Posted in Euro, Fiscal Policy, PIIGS, Sovereign Debt, Sovereign Risk | Tagged , , , , , | 1 Comment

Euro Fracture: Greek Restructuring? – German FinMin

German Finance Minister Wolfgang Schaeuble raised the specter of a Greece restructuring in an interview with German newspaper Die Welt.   Yields on Greek 10-year bonds jumped to 13.26 percent and the two-year note yield surged 103 basis points to 17.96 percent. Portuguese 10-year yields added 15 basis points to 8.89 percent, the most since at least 1997, while two-year note yields were 28 basis points higher at 9.33 percent.

It is hard to read what is coming out of the Eurozone but we don’t think that some of periphery countries can limp into 2013 without a restructuring.  Professor Jagdish N. Bhagwati  of Columbia University said this morning that restructuring is a taboo subject in the Eurozone because of push back from banks in core countries who hold large exposure to the periphery.

Kenneth Rogoff has been way out in front on the sovereign debt issue and we found this panel discussion (click here)  from INET’s Bretton Woods Conference very interesting

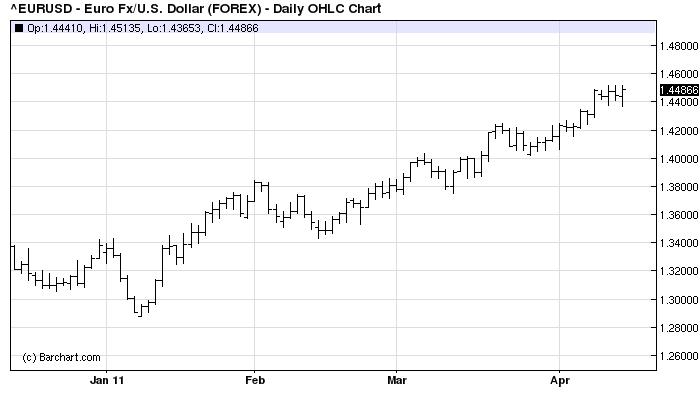
Meanwhile,  the Euro continues to strengthen as the rivets begin to pop in the European periphery.

(click here if chart is not observable)

Posted in Euro, PIIGS, Sovereign Debt, Sovereign Risk | Tagged , , | Leave a comment

Apple’s Bullish Hammer?

First a disclaimer.  You know our confirmation bias on Apple. We think it is the best company in the world, the Five Star General of this bull market, and the leader in the new wireless/app driven global economy.  We recognize we’re prone to seeing bullish signals for Apple in cloud patterns if we stare at them long enough.   But,  we’ve traded a fair share of the stock and have noticed, illustrated in the chart, that certain candlestick patterns often signal a big move.

After bouncing twice off the closing low of $330 of this correction,  today’s price action generated a bullish hammer candlestick pattern, which usually resolves itself in a bullish fashion.   We’re not betting the ranch and the pattern does need confirmation.   The next few trading days into expiration will be a big test and if the stock can close above $340,  the shorts are going to start sweating razor blades as we move closer to the April 20th earnings release.  All bets are off with a close below $330, however.  (click here if chart is not observable)

Posted in Apple | Tagged , , | 2 Comments

Components of the 10-Year Treasury Yield

An interesting chart from the IMF showing the components of the 10-year Treasury yield.   Note how oxymoronic credit risk (in pink)  crept into the “risk-free” 10-year rate starting around the collapse of Bear Sterns.   The IMF opines on what has driven yields from their 2.33 percent October low,

In sum, this analysis suggests that fiscal concerns
do not appear to have led to a higher cost of
funding during the most recent run-up in nominal
bond yields. Rather, improving growth prospects
and higher term premia are the main factors pressuring
long-term rates higher. Furthermore, QE2
does not appear to have contained long-term rates.
While the anticipation of QE2 initially led to a
sharp compression in term premia, that impact was
either fleeting or has been more than offset by other
factors.

It’s an interesting exercise and just imagine where rates would be had not the FED effectively funded over 60 percent of the Q4 deficit.  We believe Treasury yields are now one of the most distorted prices in the world.   Except for the massive flight to quality during the financial collapse,  foreign central bank recycling of BoP surpluses and now the Fed have been the marginal buyer of Treasuries (maybe not all 10-years)  since mid-last decade.   In fact,  the Fed and foreign buyers effectively purchased the entire stock of new Treasury issuance in Q4.

Alan Greenspan even blamed  foreign central banks for distorting interest rates and contributing to the housing bubble.  Newsweek writes,

From early 2001 to June 2003, the Fed cut the overnight fed-funds rate from 6.5 percent to 1 percent. The idea was to prevent a brutal recession following the “tech bubble”—a policy Greenspan still supports. The trouble arose when the Fed started raising the funds rate in mid-2004 and mortgage rates didn’t follow as they usually did. What unexpectedly kept rates down, Greenspan says, were huge flows of foreign money, generated partially by trade surpluses, into U.S. bonds and mortgages.

So you think the distortion of the most important component of the credit allocation mechanism has anything to do with the credit crisis, the enabling of $1.5 TN budget deficits, and now why the private sector is hesitant to make long-term mortgages?  We certainly do and look forward to seeing this chart updated after if the Cen Banks stop buying Treasuries.

Could it also be why the President is finally getting religion on the country’s fiscal position?    We’re not certain where this all ends up,  but it is certainly going to get very interesting.  Stay tuned.

(click here if chart is not observable)

Posted in Bonds, Budget Deficit, Fiscal Policy, Sovereign Debt, Sovereign Risk | Tagged , , , | 10 Comments

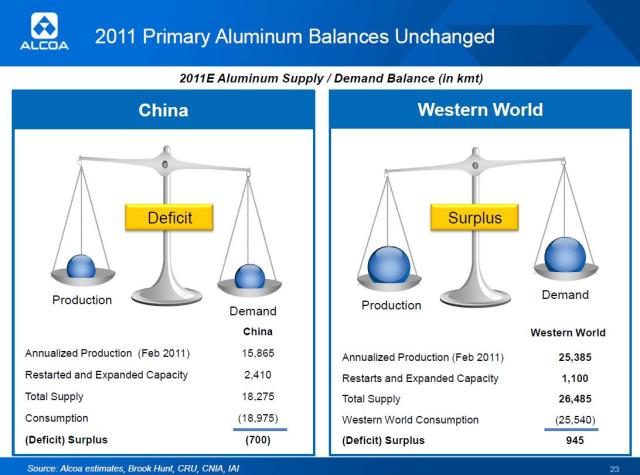
Macro Notes from the Alcoa Conference Call

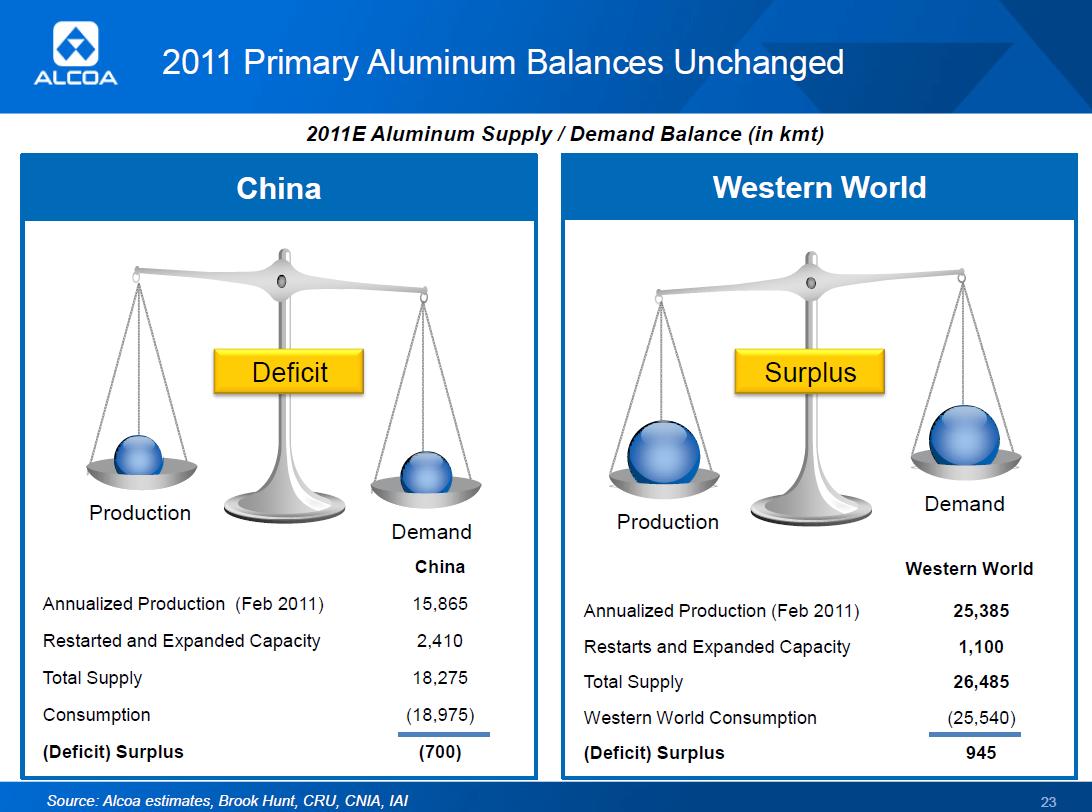
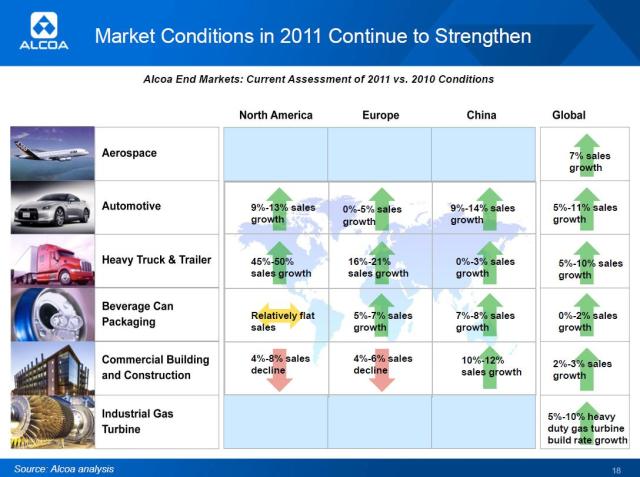
Here is our takeaway from the Alcoa conference call.  We build our macro view on micro foundations.   Alcoa’s stock is down 7 percent since announcing earnings on Monday evening.  The following are excerpts from the conference call taken directly from the executives’ presentations or the Q&A with analysts.    Some good charts follow the text.

Aeropace
So let’s start with aerospace….Boeing and Airbus have a production backlog of six years, and both companies have pretty much announced a substantial bid rate increase for all of their major models. You can go from the 737. They mentioned 31 to date, perhaps 42 a month going up there, 777 going from three to eight, 747-8 ramp up two per month by 2012, 787 is guiding up to 75 to 100 per year. And Airbus is pretty much the same story. A320 going from 36 to date to perhaps 44, A380 going from two to three per month by 2012 and the Extra Wide Body A350 starting up end of 2011 and first delivery 2013…

There’s a continued weakness on the business jet segment, but that’s a small segment. It’s only 13%. Japan, Middle East situation is another one of those…

And then another headwind is the fuel price increases, but most airlines so far have been able to pass these on either through fare increases or to buffer them off via hedging. And also, keep in mind on the fuel price increases which are substantial, that these are also positive driver for renewed fleet, because people are looking for more modern and more fuel-efficient planes. So all in all, on the aerospace side, we are positive 7% growth is what we expect this year, and we believe this market has a great outlook and I’ll touch upon that a little later.

Automotive
Automotive, the second category here in our end markets, the recovery continues to be strong. We expect overall on a global basis growth between 5% to 11%. North America, very strong start in 2011. February and March numbers posted selling rates above 30 million cars, and we expect year-on-year growth between 9% and 13%. There’s also a very good story in addition to that because we are looking at increased aluminum content, driven very strongly by the new CAFE emission standards driving very much for light weighting.

Europe automotive, we expect modest phase growth between 0% and 5%. The registrations since February in Europe are slightly up 1.4% on a year-on-year basis. That’s, by the way, the first year-on-year increase in 11 months. Last year production was still up, driven very much by export. So we believe production will be up again supported by European demand and export, but export’s lower than what we’ve seen in the last year.

China automotive, slow start into the year, just on the weekend. The new numbers came up for March. 5.4% year-on-year growth in March. Overall, the first quarter has a growth rate of 8% now. That is very strongly by — driven by the very fact that most vehicular incentives have expired, and it’s not as strong as 2010 was at 33%, but we expect a growth rate here of 9% to 14% because we will continue to see GDP growth in China and also increased consumer purchasing power driving that.

Heavy Truck and Trailer
We have increased our growth estimates, which originally was 0% to 5%, to 5% to 10% because there is an improved outlook here in North America and Europe. If you look at North America, very strong recovery. March Class 8 truck sales orders were 29,000. That’s on an annualized basis 350,000, as the fifth consecutive month above 24,000 and we are here approaching order rates of the peak year 2006 where the production was 376,000. But we believe that the year-to-date production is up 37%, and there’s an increased backlog on top of it of more than 98,000. So that’s all very positive. If you add into that the trailer production in the U.S. of around 14,400, this is up 102%. So we project for truck and trailer North America 45% to 50% growth rate.

Europe, EU27 truck and trailer registrations are up 65% by January. There’s a couple of factors here that go into and drive that. The catch up of the demand from the previous lows, then the export and also the local recovery in places like Germany, so we expect the growth rate in Europe between 16% to 21%.

And then comes China. January truck sales up 9%. February, 6% up. After 2010, there has been a remarkable growth of 60%, which came up to almost 1 million trucks. I think this is going to be hard pressed to be repeated as the stimulus program runs out and the housing market kind of slows down. But there’s also an expectation that new emission standards will be coming in by middle of this year. So we believe that the growth is going to continue, but on a slower pace in China, 3%, but applied to a very high number.

Commercial Building and Construction
Our expectations are really mixed, moderate weakness in North America and Europe and a healthy growth in China. So overall, 2% to 3%. North America, we expect further contraction of minus 4% to minus 8%. In the first quarter of this year, the nonresidential project delays eased slightly to 10% from 15% in the second half of last year. That’s an improvement clearly, but it’s still twice the normal rate.

In the last quarter of last year, architectural billing rates, and I think I reported on that, began to stabilize. So a lot of people thought that this was a good positive indicator, but then the first two months in 2011 showed that trend was reversed. So all of that pretty much shows that when it comes to commercial building and construction in North America, that’s a pretty fragile market still.

In Europe, we expect to further decline between 4% and 6% led by same. And in China, we believe that growth is going to continue 10% to 12%, as we will see continued infrastructure build out in areas like education, healthcare, as well as the consumer focus going into retail as well as office space.

Japan’s Supply Chain Impact
There’s the primary impact. I mean — and that is around our employees and the facilities that we have there. Fortunately, nobody has been hurt. The facilities have not been affected. That’s the first good news. Second, their impact that we see here is probably a dislocation of supply that might happen in the long supply chain. That’s hard to judge. We have really not seen major things coming in there, and I would say there’s a tertiary effect here and that is positive if — is the change here and this is around the debate on nuclear energy. I think there’s a new debate around that, and I think that increases the attractiveness of the gas turbine market, for instance. And then there is this discussion around an economic rebuild program, which actually could kick in pretty soon. And I think it’s the most interesting thing I saw on that, which I think gives a good indication of what people see out there. As the IMF had out, I think, a projection of Japan growth rate for this year of 1.6% and they brought it down to 1.4%, and the other things I just mentioned on the aerospace side also. I mean, the impact is manageable on a world market basis.

Scrap Market
…we have seen already, and that’s not a new phenomenon. A pretty strong tightness in the scrap market, that has not changed. I mean, the scrap market is very, very tight and continues to be tight, and that’s one of the reason why we continue to see also some people having to go away from scrap, because it’s just not available. And having to go for primary aluminum was another driver of the high regional premiums. And I think this will even get increased to what I mentioned on the China side. I mean, the target is 20% recycled material content until 2020. I mean, that’s a tough target. That’s a tough target. Given where the market is today already, very tough target.

(click here if charts are not observable)
Posted in Commodities, Earnings, Japan | Tagged , , | Leave a comment