Apple Holds Key Support at $330

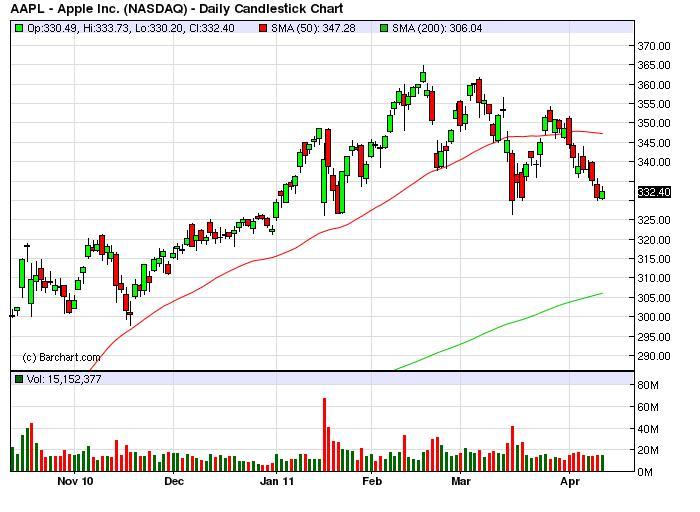
You should know by now that we believe Apple is the Five Star General of this bull market and have watching the poor action after the stock made a closing high of $360 on March 4th.   It held key support today around $330 for the third time this correction and finished up a couple bucks on some positive earnings talk.

This is an ugly chart and the stock has a lot of work to do to repair the recent technical damage.  On the positive side, however, it is setting up for a decent move on a positive earnings surprise.    Stay tuned.

Key Support Levels
330.01 – March 16 Closing Low   (tested and held three times)
326.26  – March 16 Intraday Low
313.50  – .382 Fib Retracement of the Aug-Feb  53.5% rally
306.04 – 200-day Moving Average

(click here if chart is not observable)

Posted in Apple | Tagged , | Leave a comment

Chart of the Day: Fed Ownership of the Yield Curve

We’ve updated our chart illustrating the Fed ownership of the U.S. yield curve.   We’ve also included the percentage of total maturities the Fed owns in each year from the April 2011 data and December 2010 data.   Most of POMO buying since December has taken place in the 7-9 year maturities.  In December, for example,  the Fed owned 13.4 percent of the bonds maturing in 2019 compared to 31.6 percent today.

We’re with the conventional wisdom of no QE3, no massive flight to quality, or a miracle long-term budget agreement.  We therefore expect continued upward pressure on interest rates.   We recently posted our Flow of Funds analysis showing that the Federal Reserve and foreign flows effectively funded 100 percent of the U.S. budget deficit in Q4 2010.  Interest rates need an upward adjustment to attract new non-official buyers, which could also put a short-term lid on commodities, in our opinion.   We’re on the same side as the Bond King.


(click here if chart is not observable)

Posted in Bonds, Budget Deficit, Chart of the Day, Commodities, Credit, Sovereign Debt, Sovereign Risk | Tagged , , , , | 1 Comment

Week in Review: Momentum To Be Tested

This week will be another key test for the markets.   The U.S. equity indices are right up against their year highs and there seems no let up in the momentum in crude and other commodity prices.  This is surprising given the tightening cycle has begun in Europe and the Fed is turning more hawkish.

Furthermore, the 10-year Treasury yield is up 36 basis points in the past few weeks and Apple, the five star general of the current bull market, and tech are behaving badly.   Earnings are going to have to beat expectations at a decent clip to keep the market momo going in order to offset the double hit of higher energy and interest rates.

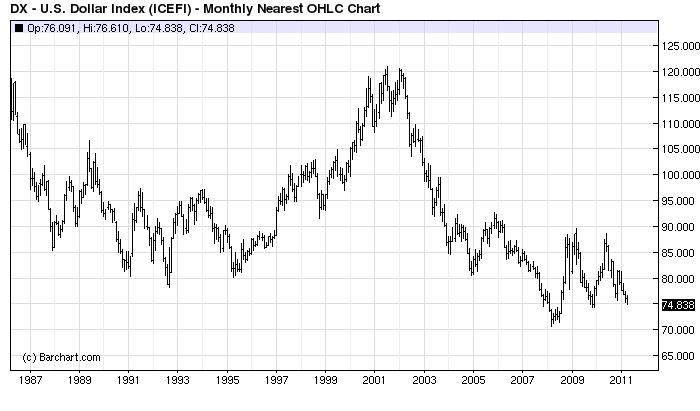
That is, unless we’ve moved into a phase of total loss of confidence in the dollar where equities become an inflation hedge.   A “Rory McIiroy collapse” in the dollar will likely be accompanied by spiking Treasury yields and commodity prices and a surprising rally in equities even as the Fed starts normalizing interest rates.   Watch closely.

The politicos are playing with fire in Washington and are clueless to the costs if global markets lose faith in their willingness to construct a long-term fiscal plan.  The risk they may just “posture” the U.S. into a crisis that makes the last one look like a picnic in Central Park is certainly not zero, in our opinion.

Silver appears to us to be in a speculative blow off phase and we just don’t like buying a commodity spike moving into a tightening cycle.   We would also feel more comfortable if gold were leading the precious metal rally, which would give us more confidence in the the dollar crisis trade.  The action in silver makes us think this move is totally based on spec and not a global wholesale  move away from the dollar.  The unwind could get ugly.  Do central banks buy silver?

We have been distracted over the past few weeks and are in a wait and see mode and thus keeping positions light.   The only trade we really have conviction in here is being short U.S. Treasuries.  In our trading we always heed the advice of the great Todd Harrison, “Discipline always trumps conviction.”   By the way, do you think a President Trump would have conviction in [fiscal] discipline?    Just askin’.

Good luck out there!

(click here if charts are not observable)

Posted in Week in Review | Tagged , , , , | 1 Comment

The Weekend Read

The single biggest threat to national security is the national debt, the chairman of the Joint Chiefs of Staff said yesterday, underscoring the importance of good fiscal stewardship and a need to stimulate economic growth.

American taxpayers are going to pay an estimated $600 billion in interest on the national debt in 2012, Navy Adm. Mike Mullen told local leaders and university students here.

“That’s one year’s worth of defense budget,” he noted, adding that the Pentagon is going to have to work to “cut the fat” from its overhead spending. – U.S. Dept. of Defense

China
Monetary Policy Tools Fooling No One in China – Andy Xie
Commodities

Gold Hits New Record: What’s Driving Prices So High – CBS MoneyWatch
Oil at the tipping point – Fortune
When Will Rising Energy Prices Start to Pinch? – WSJ
Economics

A perfect pension storm – Chicago Tribune
Retailers’ March sales top downbeat expectations – MarketWatch
Treasuries Extend Third Weekly Decline as Inflation Bets Rise – Bloomberg
Waiting for the great rebalancing – FT
Why aren’t the biggest U.S. companies hiring? – USA Today
Europe

A mini-stampede among European banks to raise capital – Economist
ECB Hikes Rates As Portugal Seeks Help – Wells Fargo
European Debt Crisis Morphs Into New Phase: Mohamed El-Erian – Bloomberg
Europe’s Subprime Quagmire – Project Syndicate
Portugal seeks help – Economist
Fiscal

Deal at Last Minute Averts Shutdown; $38 BN in Cuts to Spending This Year – NY Times
Monetary Policy

Dallas Fed chief says Fed might need to curtail its bond-buying program – Dallas News
How do you say bond vigilantes in French? – CNN
Is the ECB Making a Mistake on Rates? – Fox News
Pressure builds on Fed over inflation – LA Times
Politics

Taxpayers versus public-sector workers – Economist

(click here if video and chart are not observable)

Posted in The Weekend Read | Tagged , , , , , | Leave a comment

While Washington (and the Fed) Fiddle…..

Sorry about the hiatus.  We’ve been working on a special project that could be big and will share when and if possible.

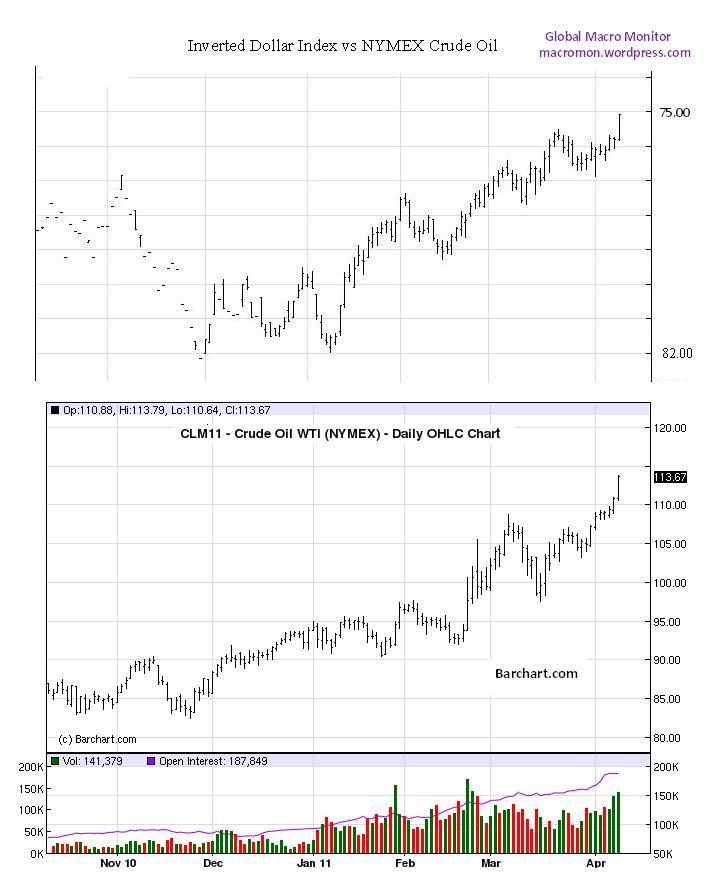
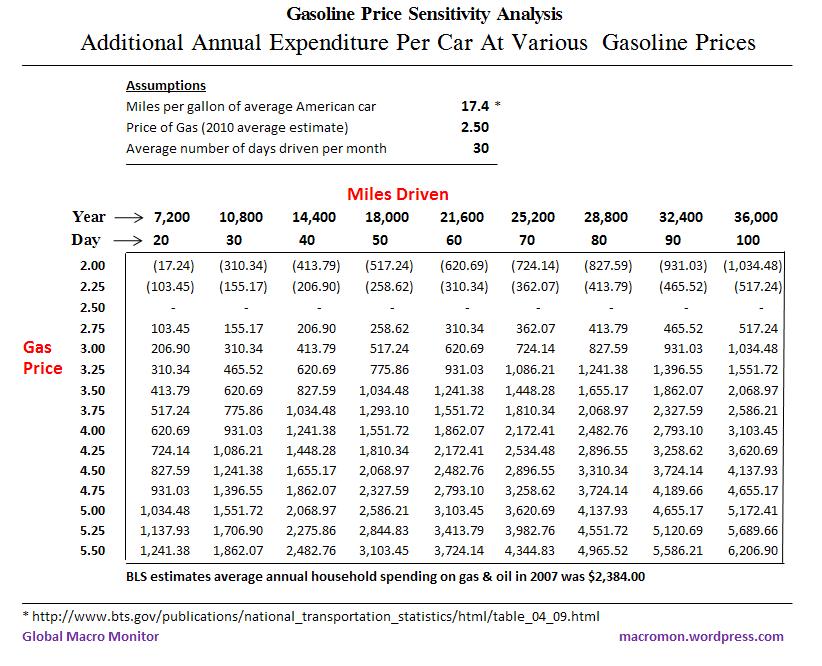
Thought we’d start by re-posting our gas price sensitivity analysis to show the cost of the U.S. government’s dithering over addressing the country’s  fiscal deficit.  While they fiddle in Washington, the dollar continues tank and the dollars you put into your tank continues to soar.

Make no mistake (it least we haven’t in our minds) this is not about Libya or Nigeria.   Nigeria is the excuse for the specs to take it up with the fuel of negative real rates and the money created to finance the huge U.S. fiscal deficit, which now looks intractable as the Congress and Administration can’t seem to even agree to a small fraction of cuts.

If the deficit was under control (lower than nominal GDP growth) and real short-term rates at 1 percent,  for example,  the dollar wouldn’t be as weak and crude oil would be $40-50  and gas $1.50 per gallon lower, in our opinion.   So while they debate over such issues which may save the average American $25.00 per year, the dollar melts down sending oil over $113 per barrel and gas prices to the moon.

Use the following matrix to calculate the your additional cost of gasoline this year based on average miles driven per day and  assuming your car gets 17.4 mpg, which is the national average.    We’re now paying about $4.25 per gallon in California and drive about 70 miles per day (family) and get pretty close to the assumed 17.4 mpg.  So as Washington fiddles,  we’ll be paying an additional $2,534.48 for gas this,  if today’s price is the average for the year, and that, our friends,  may be wishful thinking.   We may need another tax cut to offset the loss of purchasing power!   How’s that for an unstable feedback loop?

(click here if matrix is not observable)

Posted in Black Swan Watch, Bonds, Budget Deficit, Commodities, Muni Bonds | Tagged , , , , , | Leave a comment

The Weekend Read

Quantitative easing didn’t end deflation. What makes us think fresh bouts of it suddenly will? Japan’s problem isn’t the supply of yen. It’s that investors and households lack enough confidence in the economy to do anything with BOJ-created money. If the BOJ goes too far, Japan’s bond market could collapse. – William Pesek, Bloomberg

Bonds
Why Pimco cut its bond holdings – CNN Money
China

China’s Five-Year Plan and Global Interest Rates – Martin Feldstein
Chinese finance: A shadowy presence – FT
Currencies

The best alternative to a new global currency – FT
Economics

Euro Zone Inflation Jumps to 29-Month High – CNBC
U.S. payrolls rose by 216,000 as jobless rate drops to two-year low – Bloomberg
Equities

Six threats to stocks in the second quarter – MarketWatch
Why investors overpay for certain assets – Economist
Europe

Is the cost of saving the euro beyond reach? – Telegraph
The Eurozone’s Coming Inflation Divide – Project Syndicate
Geopolitical

The Arab Young and Restless – Jeffrey Sachs
The Many Faces of the Arab Spring – Project Syndicate
Japan

How Japan’s Earthquake Will Shake the World – Andy Xie
Japan and the global supply chain – Economist
‘Lehman Shock’ Is Kid Stuff Next to Fukushima: William Pesek – Bloomberg
Monetary Policy

A Strong Focus On The Concept Of Currency Value – Forbes
As Economy Sputters, a Timid Fed – NY Times
Europe rates to lead U.S. as global power shifts – Reuters
QE2: what happens when it ends? – FT
Sovereign Debt

A Cure for Fiscal Failure? – Ken Rogoff


Fan Gang, a former Chinese central bank adviser, talks about the outlook for the Chinese economy and interest rates. He speaks with Ryan Chilcote in Cernobbio, Italy, on Bloomberg Television’s “On The Move.”

(click here if chart and video are not observable)

Posted in Week in Review | Tagged , , , | 2 Comments

Q1 U.S. Major Market Review

(click here if charts are not observable)

Posted in Charts | Tagged , | 5 Comments

WalMart Says “Serious Inflation” Cometh

Last week we wrote you better “prepare for sticker shock at WalMart, the Gap, and Costco in the near future.”  In our post,  Inflation Cometh: The End of Cheap Chinese Goods, we cited Li Fung, which sources goods for WalMart,  declaring the end of Chinese led deflationary pressures as wages in that country are increasing at a 20 percent per  annum clip.

In today’s USA Today, WalMart CEO, Bill Simon, see “serious inflation” on the horizon,

U.S. consumers face “serious” inflation in the months ahead for clothing, food and other products, the head of Wal-Mart’s U.S. operations warned Wednesday

The world’s largest retailer is working with suppliers to minimize the effect of cost increases and believes its low-cost business model will position it better than its competitors.

Still, inflation is “going to be serious,” Wal-Mart U.S. CEO Bill Simon said during a meeting with USA TODAY’s editorial board. “We’re seeing cost increases starting to come through at a pretty rapid rate.”

Anyone surprised?

Posted in China, Economics, Monetary Policy | Tagged , , | 1 Comment

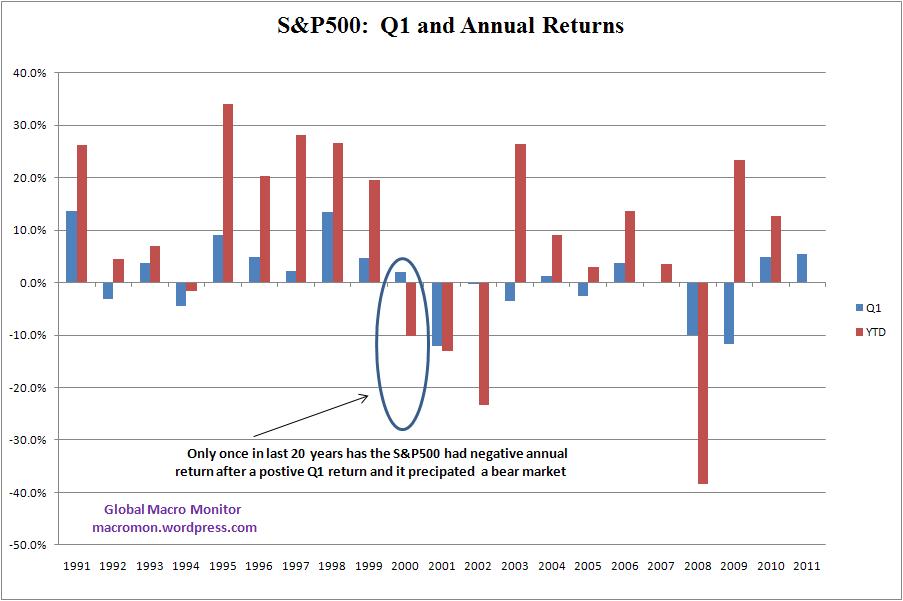
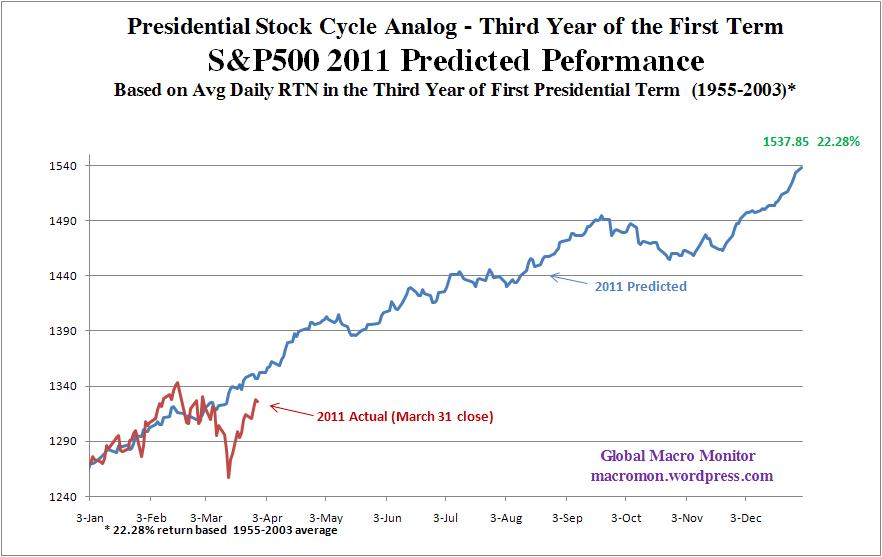
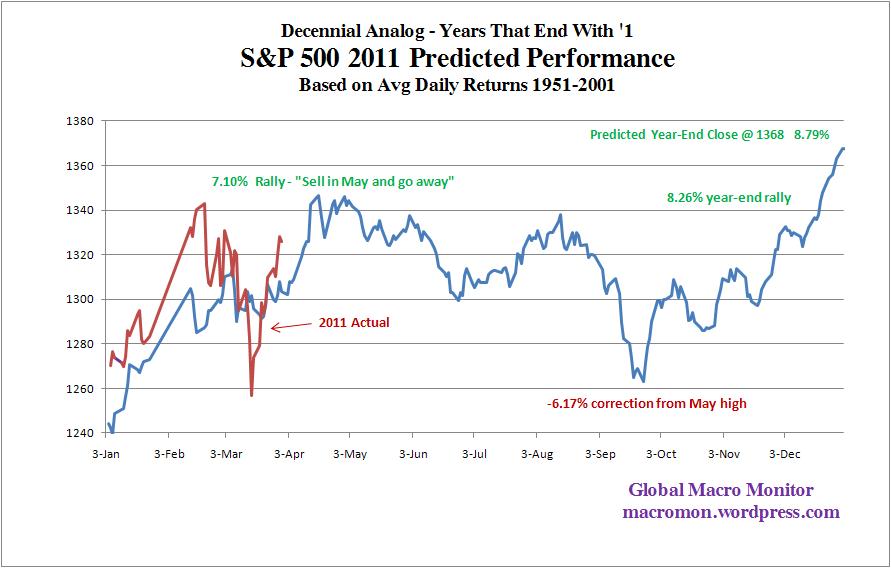
Presidenital and Decennial Chart Analog Tracking – Q1

(click here if charts are not observable)

Posted in Charts, Equities | Tagged , | 2 Comments

Week in Review: Anti-Nukes Nuke Merkel

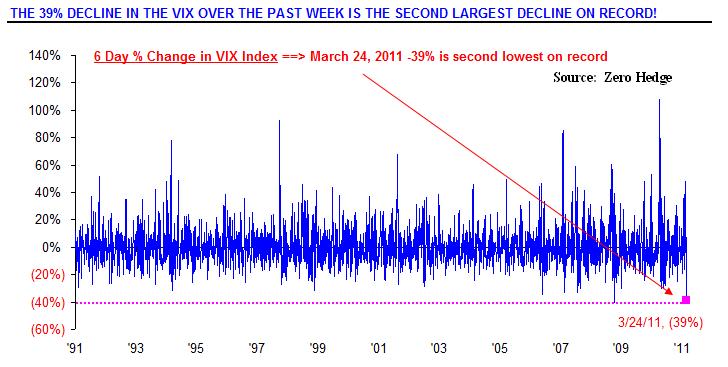
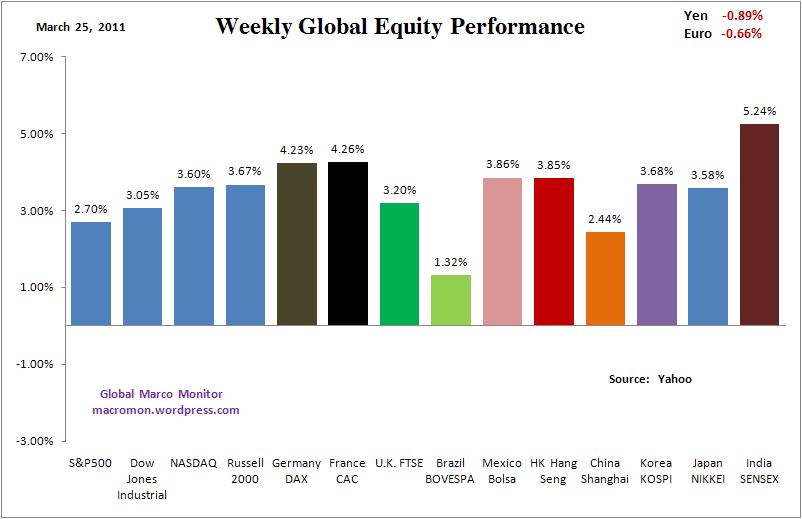
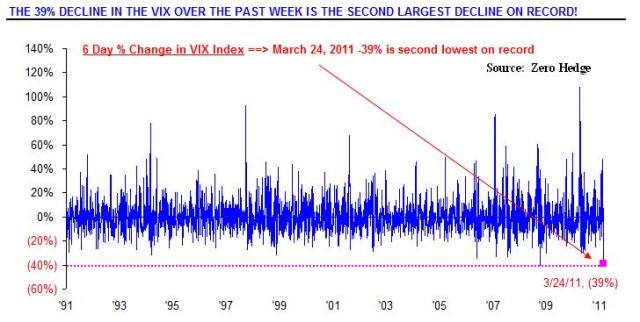
The markets showed incredible resilience last week in their ability to look past Japan’s potential supply chain and nuclear problem, continued MENA instability, $100 plus crude oil, and the recent cover of Newsweek.    The VIX experienced its second biggest weekly decline. All the major U.S. equity indices we follow recaptured their 50-day moving averages with the Russell 2000 and Nasdaq outperforming, both up over 3.6 percent for the week.
The European indices, hit much harder in the recent sell-off, generated textbook bounces off their 200-day with France and Germany jumping over 4 percent for the week.  The Mexican Bolsa down big last week was up over 3 percent and India, which is down the most year-to-date, experienced the largest bounce, up over 5 percent.  This week will be a key test as to whether last week’s equity rally was just an oversold bounce or the end of the correction.

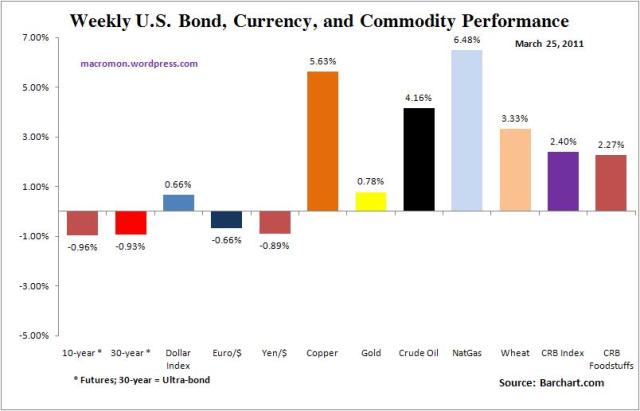
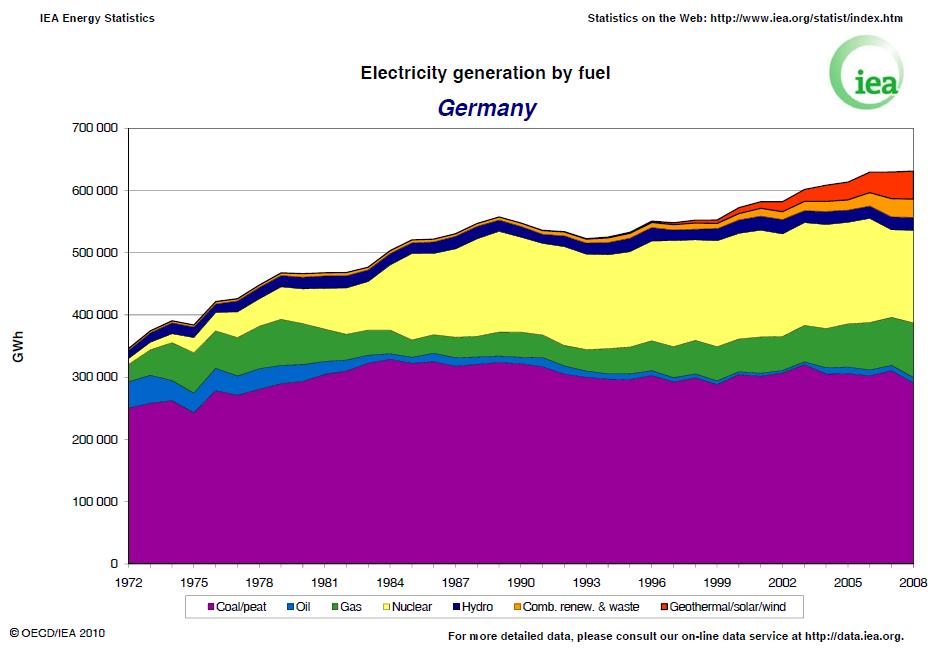
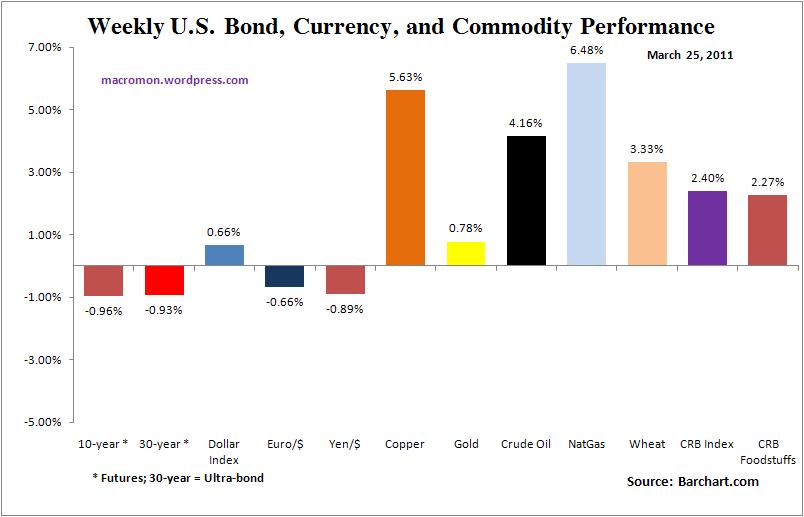
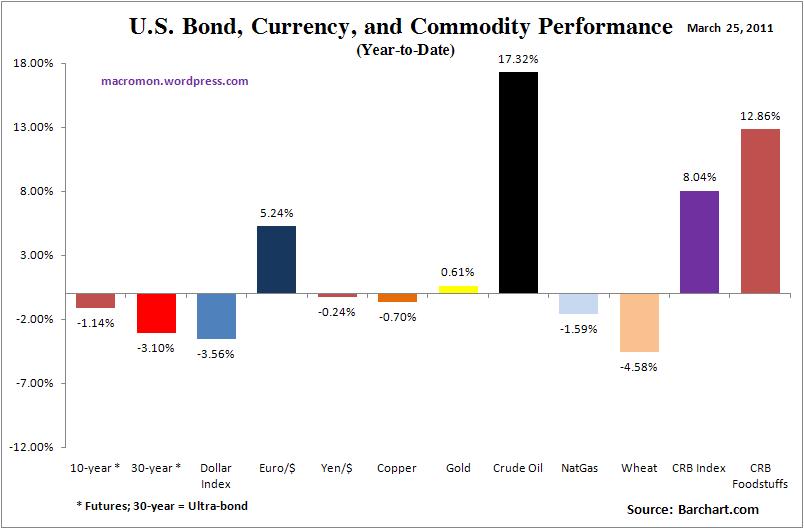
The Dollar was even able to bounce.  Natural gas was up 6.48 percent and should continue to be a major beneficiary of the anti-nuke sentiment sweeping the world.  Today’s elections in Germany were, among other things,  a slap at Merkel’s nuclear policy. Furthermore, the BTU equivalent crude oil price relative to natural gas is $24.11 per bbl.  This huge gap, in our opinion, is not sustainable.
Gold made a historic high on Thursday only to reverse sharply.  It look likes the sellers have drawn a line in the sand at $1,450.   The key short-term support levels to watch are $1419 and $1382.   Our biggest concern for gold and all commodities, for that matter,  is the potential for a spike in U.S. interest rates as we come to the end of QE2.

We’re watching $/Euro closely and think it should weaken given the German election results and Europe’s sovereign debt problems.  A move above last week’s cash high of 1.42474 would be a surprise and signal a major problem with the Dollar, in our opinion.

We like U.S. tech, natural gas, and clean tech stocks.   China, Korean, and Brazil equities look like decent trades.    We think U.S. bonds move lower and the Dollar is in for a short-term bounce.   We have positions in all x/China and Korea and are hedged with SPY puts.   We’re expressing opinions here and you know we never make investment or trading recommendations.  Have a great week!

(click here if charts are not observable)

Posted in Week in Review | Tagged , , , , , , | 1 Comment