Global Corporate Tax Rates

Lots of chatter the President is going to propose  a corporate tax cut in his State of the Union speech.    Corporations hold billions off-shore and maybe it will nudge some of it back into domestic capital expenditures or hiring?    We think this may be one of the positive surprises of 2011.

Nevertheless,  the competition is heating up to attract companies and jobs.   The Canadians are poised to cut their corporate rate to 16.5 percent on January 1.   Click here for excellent interactive table on global corporate taxes.

Related Articles
Obama Likely to Pursue Corporate-Tax Cut, Way to Pay for It – WSJ
Canada Slashes Business Levies – WSJ

Posted in Fiscal Policy, Policy, Politics | Tagged , | Leave a comment

Yuan Set for Almost 10% Real Appreciation in 2010

We find it interesting there is very little mention of China’s  real exchange rate in the media.  With official inflation in China set to outpace that in U.S. by 5 percent this year,  coupled with a nominal appreciation of the yuan around 3 percent,  the real appreciation is closer to 8-10 percent.  The real exchange rate is what matters and was one was of the most critical factors  in stimulating domestic demand in Latin America during the 1980’s and ’90’s.

This is illustrated in the following chart showing the impact of the real exchange on Argentina’s nominal GDP in dollar terms and its current account balance after the government implemented a quasi-currency board.  Domestic inflation took almost three years to converge on U.S. inflation and as consequence Argentina’s real exchange rate appreciated almost 50 percent, even though the nominal rate was fixed and pegged to the dollar.

P.S.  We never could figure out which term to use when referring to China’s currency: Yuan, Renminbi,  or RMB?   Until, that is,  the Wall Street Journal set us straight.  Click here.

Did you know  ‘Renminbi — abbreviated RMB — is the formal term most often used by Chinese officialdom to refer to the currency… Literally, it means “People’s Currency.”’

Posted in BRICs, China, Monetary Policy | Tagged , , , , , | 2 Comments

Chart of the Day: Bond ETF Performance

Interesting chart showing performance of Bond ETFs.   All have slid into year-end, converging around a 3-5 percent annual return, setting up nicely for a “jump ship” trade into equities.   Muni bonds have been a relative disaster.

(LQD)    Liquid Investment Grade index
(MUB)   Municipal Bond Index
(TLT)    Barclays Capital U.S. 20+ Year Treasury Bond index
(HYG)    iBoxx $ Liquid High Yield index
(PCY)    DB Emerging Market USD Liquid Balanced index.
(TIP)     Barclays Capital U.S.Treasury Inflation Protected Securities


Posted in Bonds, Muni Market | Tagged , | Leave a comment

U.S Employment: 25 percent of Jobs Are In 15 Occupations

Interesting chart and detailed data on the profile of U.S. employment  from the Department of Labor.  Take a look at the Top 25 percent (x/ nurses) and you can see why employment is so sensitive to the “wealth effect” generated consumer spending.  Click the chart and tables for a clearer picture.

Posted in Employment | Tagged , | 1 Comment

Ukraine Parliamentary Procedure

Let’s play Hardball!   Looking forward to this year’s “Thrilla on Capitol Hilla” between Chairman Ben Bernanke and Congressman Ron Paul, the new Chairman of the Domestic Monetary Policy Subcommittee of the House Financial Services Committee.  Our bet Bernanke will play Rope-a-Dope, which should be quite a show and we expect limited impact on the Fed’s independence.  By the way, we were early and all over the problems the Fed would face in a Tea Party Congress.

Posted in Monetary Policy, Policy | Tagged , , | 2 Comments

The Great Monetary Policy Swan Dive

Great chart from the OECD illustrating the dramatic actions taken by the world’s major central banks during the financial crisis.   The massive collapse in short-term interest rates has reduced income of savers and the splash of the heavyweight central banks has displaced yield seeking liquidity causing it to flood into the emerging markets and commodities.  “John Bull can stand many things, but he can’t stand two zero percent!”

Posted in Bonds, BRICs, Charts, China, Monetary Policy, Policy | Tagged , , , , | 1 Comment

Farmland Prices Surge 16%, Near All-Time High

The Des Moines Register reports the average price for an acre of Iowa farmland increased to $5,064, up 16 percent for the year,  according to Iowa State University’s annual survey.  The all-time inflation adjusted high is $5,711 per acre in 1979.   The Register writes,

Land values in Iowa declined by 2 percent in the
2009 survey. But farmland prices have surged in
recent months, along with a 50 percent rise in the
price of corn and a 30 percent increase in the price
of soybeans.

ISU Extension surveys indicate that farmers this fall
can expect profits of as much as $2 per bushel on
corn and $6 per bushel on soybeans.

Cattle and hog profits this year, for the first time
since 2007, played a role in the land price boom,
said Michael Duffy, the ISU Extension economist
who conducts the survey.

He said respondents also mentioned low interest
rates on loans, which have dipped below 6 percent
this year, as a factor fueling more farmland
purchases.

What a contrast to the recession of the early 1980’s when farmers were taking huge hits from the record high interest rates.   The days when extra security had to be installed at the the Marriner S. Eccles Federal Reserve Board Building in Washington to protect then Fed Chairman Paul Volcker from angry farmers.

Posted in Commodities, Real Estate | Tagged , | Leave a comment

The Ambiguity of Stock Value

Professor Robert Shiller,  of Yale University,  is probably best known for his book, Irrational Exuberance, which called the top of the dot.com bubble and the second edition called the top in the housing market.  During our days on Wall Street we were big fans of Shiller’s book,  Market Volatility.

We asked him once  to visit us in our offices and the meeting took place the day after then Fed Chairman Alan Greenspan’s famous Irrational Exuberance speech in December 1996,

But how do we know when irrational exuberance has unduly escalated asset values, which then become subject to unexpected and prolonged contractions as they have in Japan over the past decade?

The professor said he was in town to meet with Greenspan who was concerned about the run-up in stock prices.  During the meeting Greenspan solicited his thoughts on why stocks were rising.  The professor answered maybe it was just “irrational exuberance” among investors.  Hmmmm….

We think Shiller’s best work was Martket Volatility and specifically the following,

The Ambiguity of Stock Value

Stock prices are likely to be among the prices that are relatively vulnerable to purely social movements because there is no accepted theory by which to understand the worth of stocks….investors have no model or at best a very incomplete model of behavior of prices, dividend, or earnings, of speculative assets.

Shiller nails it here.  Stock values are ambiguous as there are no models to determine their “true” price. Even at the macroeconomic level this is true and Greenspan addressed it in his Irrational Exuberance speech,

There is, regrettably, no simple model of the American economy that can effectively explain the levels of output, employment, and inflation. In principle, there may be some unbelievably complex set of equations that does that. But we have not been able to find them, and do not believe anyone else has either.

Consequently, we are led, of necessity, to employ ad hoc partial models and intensive informative analysis to aid in evaluating economic developments and implementing policy. There is no alternative to this, though we continuously seek to enhance our knowledge to match the ever growing complexity of the world economy.

So to it is with our job in forecasting asset values, which can only be done with “ad hoc partial models” in the ether of ambiguity.   Because prices are determined by simple buying and selling, we paraphrase Shiller in constructing our ad hoc model,

Stock prices are likely to be among the prices that are relatively determined by capital flows because there is no accepted theory by which to understand the worth of stocks.

In our experience getting ahead of the capital flows has been more profitable than buying what we believe to be a “cheap” stock or selling an “expensive” stock.

And that leads us into the next issue of perspective based on reference points, time frames, and historical bias.

Take a look at the three objects.   Two charts of the exact same market, the S&P500 over different time horizons;   and one picture.

Do you see an S&P500 that is overvalued?  Undervalued?  Oversold? About to rollover or break to new highs?   Do you see a young lady or an old hag?  It most likely depends on your confirmation bias.     Larry Summers, who will leave the White House at the New Year,  coauthored a paper in the late 1980’s stating market volatility is caused by investors and traders with different time horizons.

But, like Keynes’ beauty contest analogy, the true question to ask for 2011 is not what we see, but what we believe the market – i.e., the dominant marginal buyers – will see.  Do they  see the young lady or the old hag?

Or maybe beauty is relative, or even ambiguous,  and we have to determine which markets will be deemed the least old or the most pretty.   And that just may be the best lesson here, which we think certainly is the case for the world’s major currencies.  Dollar strength doesn’t necessary equate to the young lady!

Posted in Currency, Equities | Tagged , , , | 20 Comments

Rare Earth Day 4.0

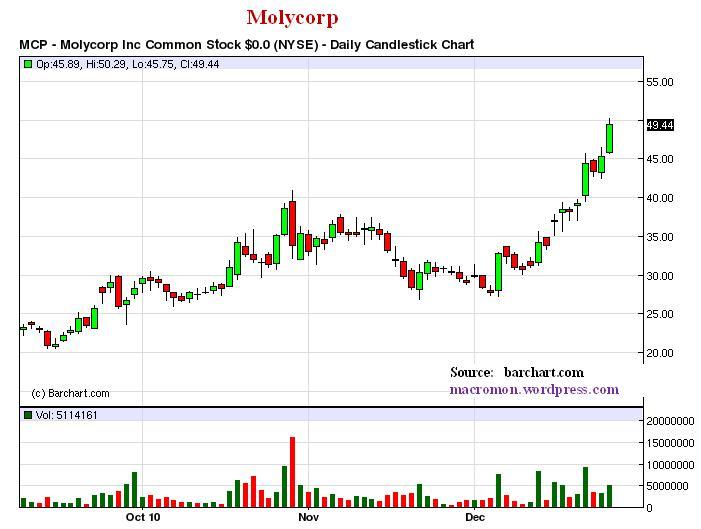
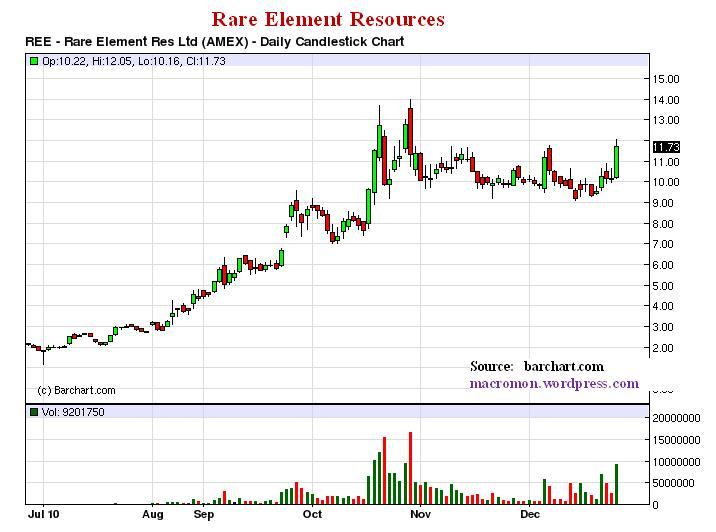
Rare earth stocks rocked today on the back of an article in PC magazinem which is really old news.   Molycorp (MCP) was up almost 10 percent,  hitting  a high of $50.29 a share, and Rare Earth Elements (REE) up almost 20 percent.   Molycorp has doubled since we first posted our views on Rare Earth Elements (REEs) in September,

Scarce commodities, which have no substitutes and critical for industry and national security?   Sounds like “Gold on Steroids” to us.  We wouldn’t bet the ranch, but don’t want to miss what could be a nice run as the market begins to focus.  This is a long-term story and experts say that rebuilding an independent U.S. supply chain could take 15 years.   The Defense Department is about to release a study on the national security aspects of the U.S. REE dependence on China.

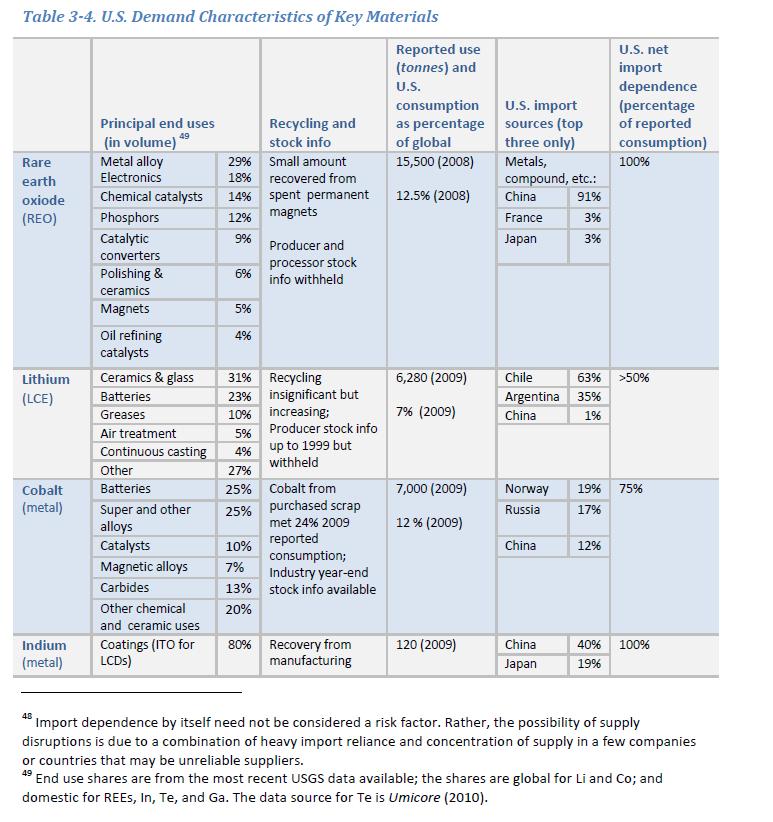
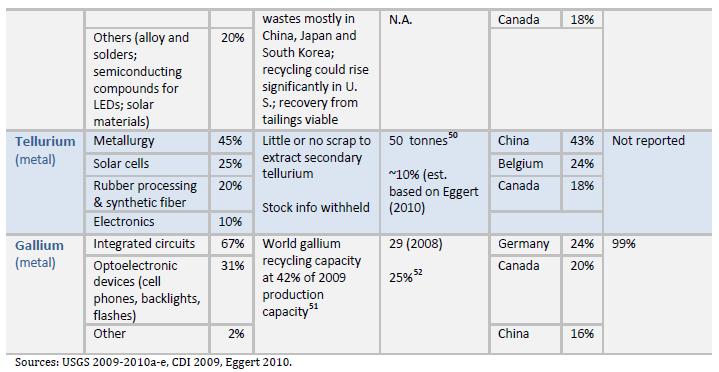
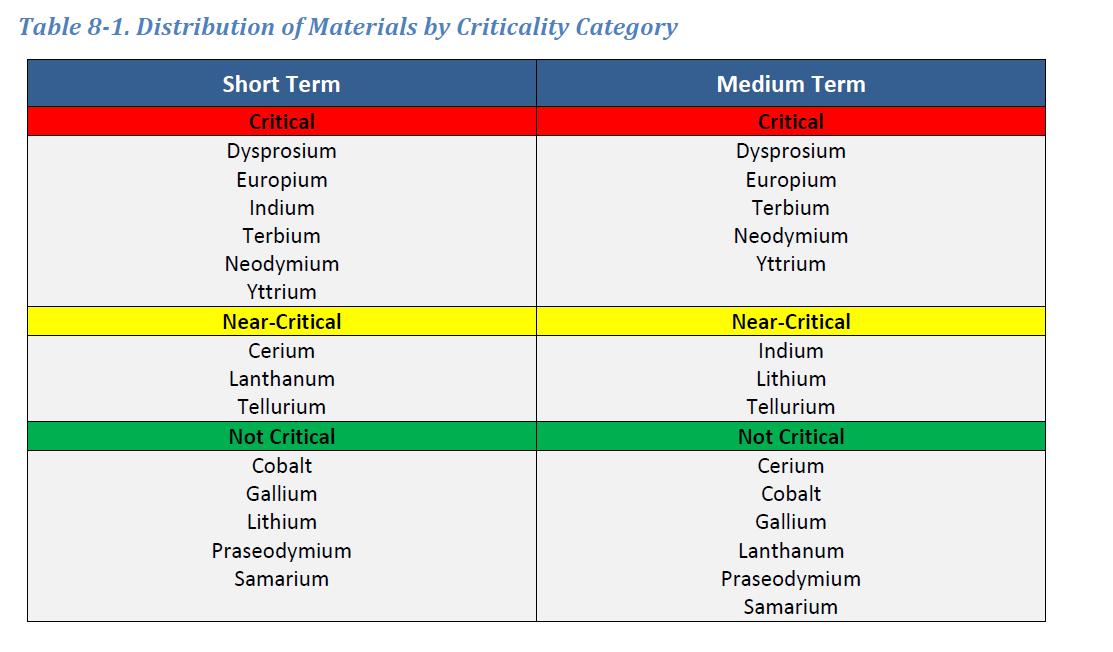
After China cut-off rare REE exports to Japan in a diplomatic dispute, we suspected a “Sputnik Moment” and panic among end users as China controls more 90 percent of the world’s production.   These are very volatile stocks and we have existed our position looking to reload at lower prices.   Also, check out the very informative charts below from the Department of Energy.

Related Posts
Rare Earth Day
The New Gold Rush?

What is Spec? Baby, don’t hurt me, don’t me. No more!

Rare Earth Day 2.0
Rare Earth Stocks Up Big on China Restrictions
Rare Earth Day 3.0
Did the Chinese Drop a Rare Earth Trade Bomb?
Rare Earth Metals ETF (REMX) Begins Trading October 28th
China to Resume Shipping Rare Earth Minerals – NY Times

Posted in Black Swan Watch, Commodities, Rare Earth Elements | Tagged , | 1 Comment

Apple Ups 1Q’11 iPhone Shipment Target

Taiwan’s Digitmes, a must read and the best source for supply chain news,  reports,

Apple has raised the global shipment goal for its iPhones for first-quarter 2011 from 19 million units originally to 20-21 million units, according to sources with Taiwan-based component suppliers.

The first-quarter shipment goal for WCDMA iPhones has been adjusted from 13 million units to 14-15 million units, the sources said. The shipment goal for CDMA iPhones, which will be launched in North America and Asia Pacific in the first quarter, is set at 5-6 million units, the sources added.

Global iPhone shipments in fourth-quarter 2010 are estimated at 15.5 million units, resulting in a total of 47 million units for the entire 2010, the sources indicated.

Related Articles
Apple tops Amazon’s most-gifted lists  – Fortune
2010: Year of the Apple – Gizmo
Apple, Steve Jobs hit new heights in 2010 – AFP
Silicon Valley visionary who put Apple on top – FT
Analyst: iPad 2 to sport dual-core chip – CNET

Posted in Uncategorized | Tagged , , , | 1 Comment