QOTD: Quote of the Day
Happiness, not in another
place but this place…
not for another hour
but this hour – Walt Whitman,
“A Song for Occupations,” Leaves of Grass

QOTD: Quote of the Day
Happiness, not in another
place but this place…
not for another hour
but this hour – Walt Whitman,
“A Song for Occupations,” Leaves of Grass
Fibonacci retracement levels are horizontal lines that indicate where support and resistance are likely to occur. They are based on Fibonacci numbers. Each level is associated with a percentage. The percentage is how much of a prior move the price has retraced. The Fibonacci retracement levels are 23.6%, 38.2%, 61.8%, and 78.6%. While not officially a Fibonacci ratio, 50% is also used. – Investopedia
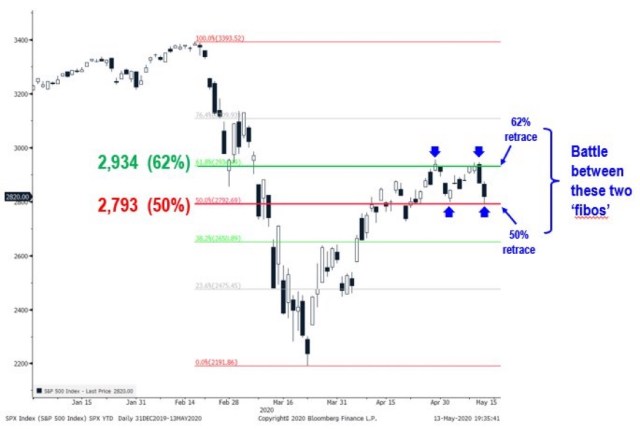
Traders and ‘bots are clearly in control of this market.
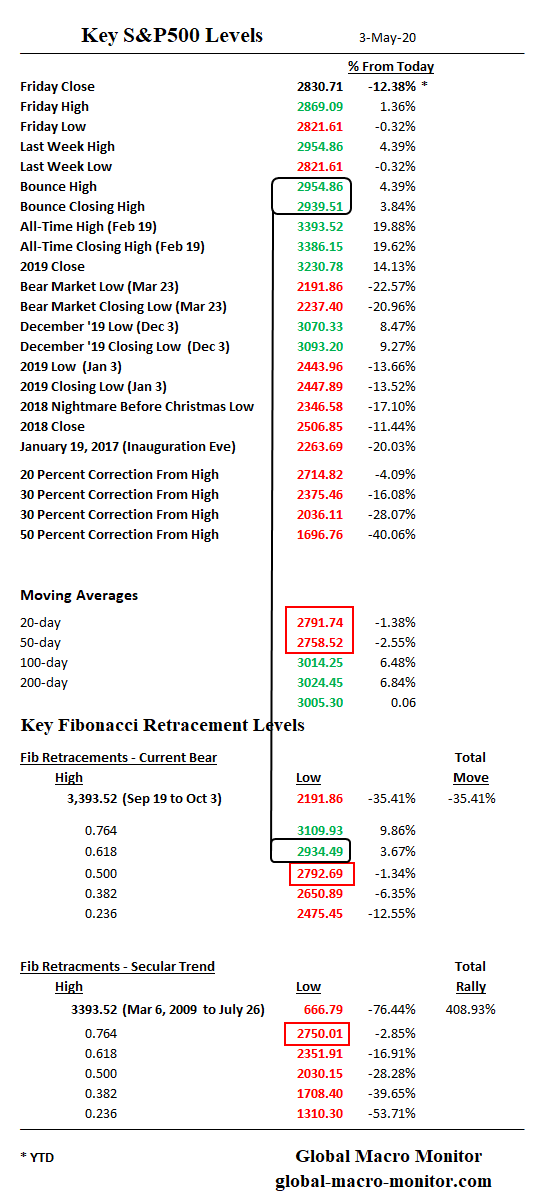
We are fairly convicted the 50% Fibo won’t hold, which sets up a quick move to 50-day moving average at 2721-ish.
Source: Carl Quintinalla
Be careful out there, folks, the shorts have been destroyed in the big bounce off the March 23rd bottom and there is very little holding up this market now x/ hope, delusion, and the specter of more financial asset shortages, in our opinion.
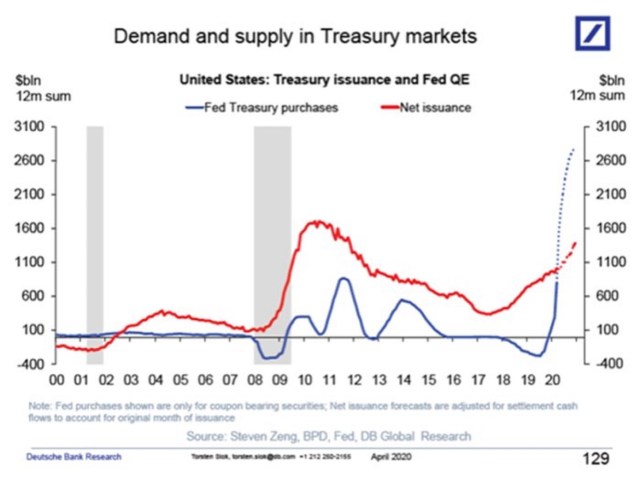
Bonds
Moreover, there is little room in yields for bonds to now be used as a stock market hedge or short proxy.
Though it’s possible the trading momo boyz & ‘bots may believe Jerome Powell will take them out of their longs at -2.0 percent, we have our doubts as it will create a real problem for the Fed and Treasury.
It’s [negative interest rates] an unsettled area. I know that there are fans of the policy, but for now, it’s not something we’re considering. We think we have a good toolkit, and that’s the one we’ll be using.” – Chairman Powell, May 13th
Though the Chairman was likely referring to only policy interest rates, it is not clear that if traders pushed U.S. notes and bond yields into negative territory the Fed would be there to buy as part of their QE program. If they do, imagine the shit show this would cause with the monthly Treasury auctions.
Treasuries are not German bunds and have polar opposite supply technicals. The former with “trillions upon trillions” of new issuance coming and the latter as scarce as hand sanitizer and a 2020 Yankee game, the result of perennial budget surpluses, making the border crossing into the negative yielding promised land a cakewalk. Not so for Treasuries, however, as massive deficit financing has erected a border wall at zero percent that only President Trump can fantasize about.
It’s not that hard to issue a few billion euros of negative yielding German bunds but super-sized billion dollar Treasury auctions with negative yields? Forget about it.
Are Long-Term Fundamental Bond Investors Extinct?
How could any fundamental real money fiduciary responsibly purchase an asset that is guaranteed to lose money if held to maturity? Maybe long-term bond investors have gone the way of the Pterodactyl. It’s pretty safe to say the 40-year jig in bonds is over.
We suspect the momo boyz and ‘bots don’t have the firepower to climb the wall into negative yielding territory but if the Fed is taking down most or all of the new issuance and then some, you just never no. Stunning, at least to us, how some bond bulls have no clue about this as they take their pyrrhic victory laps on Twitter.
Do the ‘bots and momentum boyz have this context and understand what is at stake? More important, do the policymakers?
What. An. Absolute. Fricikin’ Mess.
Here’s to hoping and let us pray money demand in the U.S. remains infinitely elastic as our policy morph into MMT depends on it. Good luck with that.
As always, we reserve the right to be wrong.
QOTD: Quote of the Day

Hedge fund legend, Stanley Druckenmiller, is all beared up saying the risk-reward for equities is the worst he’s seen in his career, and he has been around the block more than a few times. He does like Amazon, however, saying people should be thankful that the company exists right now given the number of jobs created.
In the future, [Druckenmiller] said he wouldn’t be surprised if the Trump administration’s response to the coronavirus outbreak becomes the “poster child for the worst public policy decisions ever made from a cost-benefit analysis.” – Bloomberg
Summary
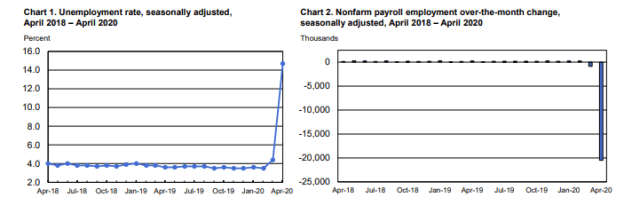
Since the COVID crisis hit America, many businesses are operating at limited capacity while others have ceased operations completely. The unprecedented aggregate supply and demand shock to the U.S. economy has resulted in horrific economic data, including the 20.5 in nonfarm payroll jobs lost in April and the unemployment rates shooting up over 14 percent.
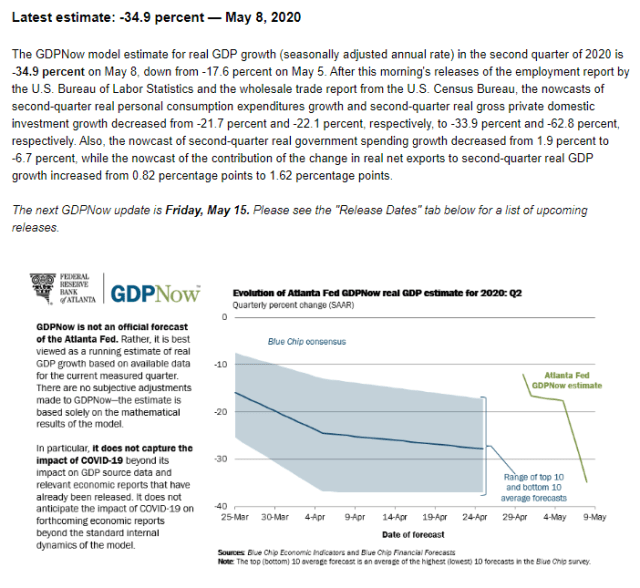
The data released Friday also caused the Atlanta Fed’s GDP Now model to lower its Q2 GDP estimate to a stunning annualized -34.9 percent, which puts it at the lower end of the range of Blue Chip forecasts. The GDP Now Q2 estimate will certainly change as new economic data is released over the next few months.
Context
It is important to keep the data in context. The economy has been slammed shut for two months and is just starting to slowly reopen. The data surely does not reflect the prospects for the economy over the next 12 months unless a second and more virulent wave of COVID-19 breaks out, which is not a zero probability, by the way.
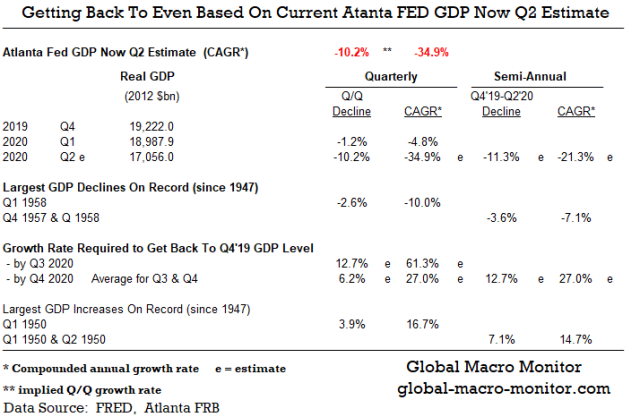
Still, if Q2 GDP does come in at the annualized -34.9 percent, it would represent a quarterly collapse 3.5x the next largest decline of 10.0 percent during the Eisenhower recession in Q1 1958. Even more stunning, the non annualized first-half 11.3 percent GDP collapse in 2020 would approach the worst year of the Great Depression when GDP fell 13.1 percent for the entire year during a period of mass bank failures.
Depression Data But Depression Not The Base Case
We all can take a little consolation and hope, at least for now, that though we are witnessing economic data plumbing the depths of the Great Depression, the data will improve as the economy slowly reopens. It is uncertain how much structural damage the pandemic and the temporary lockdown has done to the economy but it will be significant.
There is also very little doubt it will take some time for the economy to recover. How long is anyone’s guess?
The table above illustrates for U.S. GDP to recover its Q4’19 level by Q3 (assuming the Q2 GDP Now estimate holds), growth will have to snap back by an annualized 61.3 percent next quarter. To recover real output fully by the end of the year, GDP growth will have to average an annualized 27 percent in Q3 and Q4.
We. Don’t. Think. So.
Recovery During The Great Depression
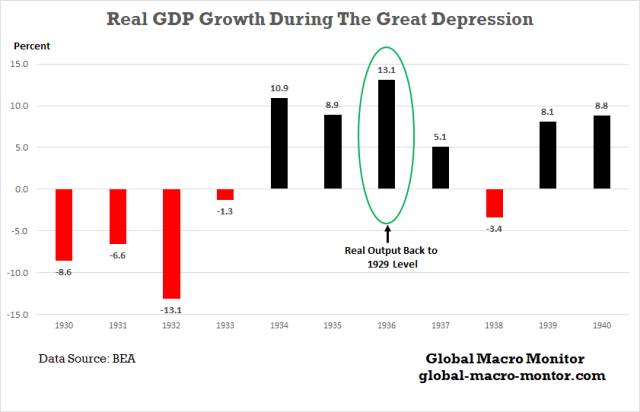
During the Great Depression, the economy didn’t recover its 1929 real output level until 1936.
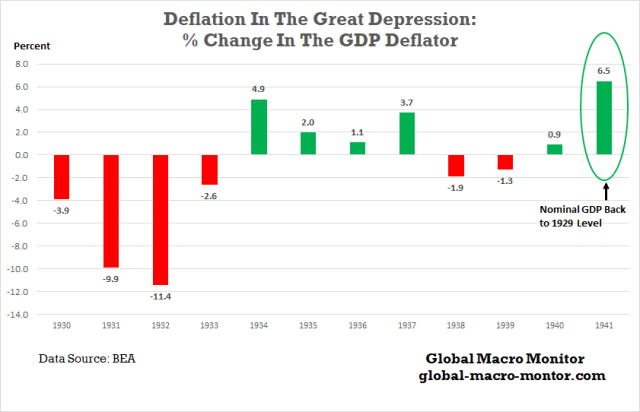
Furthermore, because of the virulent deflationary forces that took hold during the Depression, the result of the 25-30 percent contraction in the monetary aggregates, caused by the massive bank failures from 1931-33, nominal GDP did not recover its 1929 level until 1941. From 1929 to 1933, demand deposits, which made up over 85 percent of narrow money in 1929, fell by 35 percent. The Fed failed big-time in its role as lender of last resort.
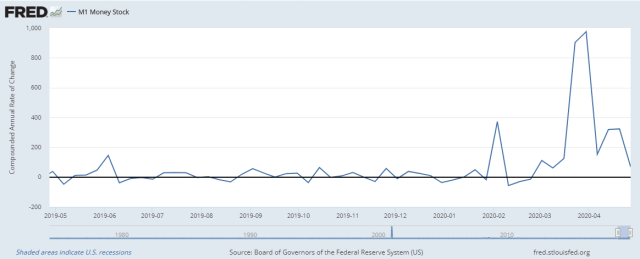
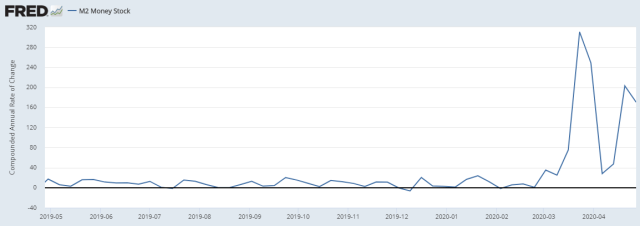
That’s not the problem today as illustrated in the following charts of the compounded rate of change in M1 and M2. The U.S. central bank has painted itself into a corner as markets and the economy cannot survive without ever increasing doses of free and easy money.
While many fret over temporary deflationary pressures, some of which are just relative price changes as the economy begins to adjust to the post-COVID new normal, we fear more about a coming wave of big inflation over the medium-term, which absolutely nobody is prepared.
Lord have mercy on bond investors.
M1 Money Stock Compounded Rate Of Change
M2 Money Stock Compounded Rate Of Change
Go Stonks
A macro argument has and can be made when the monetary aggregates are growing faster than nominal GDP the differential provides the liquidity and rocket fuel for the stock market. Just throwin’ it out there and if traders believe it is true it effectively becomes a self fulfilling feedback loop.
Q3 Economic Snapper Is Coming
We suspect the economy has already troughed and the employment data will bottom in May allowing GDP to realize a fairly sharp snapback in Q3, which will most likely exceed the 3.9 percent largest Q/Q GDP increase in the post-WWII period, realized in Q1 1950. There is no doubt the Trump administration will sell it as “the greatest economic recovery in history” and tout the huge annualized GDP growth number.
White House Cheerleaders Preparing The Pom-Poms
If the economy can muster, say, a 5.0 percent Q/Q growth rate in the third quarter, which may be a push but not totally unreasonable that translates into a 27.6 percent growth headline number, far exceeding the Q1 1950 16.7 percent annualized growth rate. Don’t you think the White House is preparing the pom-poms for such a rebound and cranking up the Tweet machine? We suspect this will be the central focus of the President’s campaign strategy.
Even so, U.S. real output will still be down 6.8 percent from its 2019 closing high and unemployment will most likely be in low double digits. Can Trump be re-elected with those numbers?
November Election
The body politic may give another POTUS, who is more empathetic, honest, more decisive, and popular the benefit of the doubt but that is not who Donald Trump is.
Based on our analysis, not our political bias, our central case, assuming a fair election, is the Democrats are going to take the White House, Senate, and House by wider than expected margins in November.
Recall our post in early April, Prepare For The Senate To Flip, when we were a lone voice crying in the wilderness. We were also putting our money where our analysis is,
We look at the individual Senate races and can’t understand why PredictIt is still pricing the Republicans to remain in control of the Senate with a 61 percent probability.
…We have our money where our analysis is, betting on a Blue Senate, and if we are right, we are looking at a 439.11 percent compounded annual return (CAAG) by election day. Beat that in the stonk market, folks. — GMM, April 13
The market is now even money and marching north that the Democrats will take the Senate. We are up 28 percent in 28 days, and now everyone and their mother on Mothers Day is talking about how the Upper Chamber is now in play. We do realize 175 days to election day is an eternity in politics and much can change but we are sensing a wave election is building.
Investors and businesses should plan accordingly, including for higher corporate and capital gains taxes, which are the low hanging fruit. More regulation of the financial markets and industry will almost certainly be on the docket.
The markets are still obsessing over “flattening the curve” and the first-order existential effects of the pandemic. This crisis has n dimensions, however, including state and local government budget crises, a coming tsunami of bankruptcies, and an emerging market debt crises. There is also now increased uncertainty over private property rights, an existential crisis for the Euro currency and European Union, doubts that small business can survive, especially independent restaurants, and there are many other concerns.
Still a buyer of stocks?
Upshot
There you have it, folks. Our thoughts and best guesses. We are all in the guessing game these days and remain at the mercy of whatever trajectory the pandemic decides to take, which will largely be determined by the efficacy of U.S. health policy, or lack thereof.
As always we reserve the right to be wrong.
GMM Has Some Positive News
We have some potential good news on the ex-Morgan Stanley stock picker we wrote about last month. We had a chance to analyze her portfolio of 35 large-cap stocks this weekend, looking at the returns for the year and the critical dates of the Feb 19th market high and March 23rd recent low.
Nothing short of astonishing and not tech stocks, by the way. Check this out.
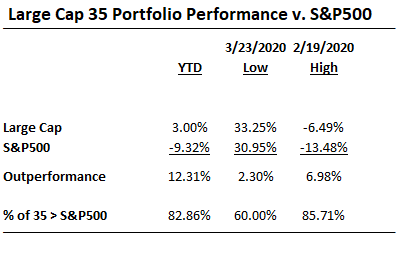
We are negotiating on how to bring her in and monetizing her work, which will help you and I make some money. We are global macro 24/7 and its nice to have a very smart and savvy stock picker around. Stay tuned for that.
The term “flattening the curve” now means so many things too so many people. Very Churchillian, no? We maintain what we should be looking for are inversions ala New Zealand and Korea.
Not! The deception of averaging as most jobs that were lost are in the lower wage sectors, such as bars and restaurants.
We have written several posts about how deceptive economic data can be simply because of averaging. See here and here.
In April, average hourly earnings for all employees on private nonfarm payrolls increased by $1.34 to $30.01. Average hourly earnings of private-sector production and nonsupervisory employees increased by $1.04 to $25.12 in April. The increases in average hourly earnings largely reflect the substantial job loss among lower-paid workers; this change, along with earnings increases, put upward pressure on the average hourly earnings estimates. (See tables B-3 and B-8.) – BLS
Stay tuned for more analysis on the Employment Report.
In a few hours, the BLS will release the employment situation for April, which will illustrate the devastation the COVID crisis has inflicted on the U.S. labor market. Since the crisis began 30 million plus American workers have filed for unemployment insurance, which is about 20 percent of the 150 million workforce.
Not all 30 million will show up in this morning’s number due to lags in how the data is gathered. We expect the unemployment rate will probably peak in the May report and gradually begin to recover. All bets off if the country is hit with a second wave of COVID infections and deaths.
Today’s Unemployment Rate Reflects A Closed Economy
Though we are very empathetic to those who have lost their jobs, we are also cognizant that many of the 30 million unemployed will return to work once the economic reopening accelerates and what really matters is how much long-term damage has been done to the economy and American labor force. Nobody knows for certain as we are all engaged in a guessing game, which will probably be the case until the economic fog begins to burn off in the fall.
There will likely be an initial burst of economic activity due to a huge pent-up demand as America opens for business but the long-term reality will be determined by how much damage and hysteresis the lock-down has inflicted.
Hysteresis in the field of economics refers to an event in the economy that persists into the future, even after the factors that led to that event have been removed. – Investopedia
Stocks seem to be expecting a fairly rapid return to normal as the S&P is only a little over less than 10 percent from it’s all-time high. We are not so sanguine and our priors are the unemployment rate will linger in the low double-digit range for sometime.
A high stock market and double-digit unemployment is not a good look going into the November presidential election, especially for President Trump, who derives much of his support from his populist and anti-elitist rhetoric.
Top 10 Percent Of Households Own 88 Percent Of Stock Wealth
The elites, or let’s say the Top 10 percent of households, for example, own 88 percent of stock market wealth. See our post, Why The Stock Bull Is A Big Meh For Most Americans.
And a stock market clinging close to its highs with an unemployment rate that has nearly tripled will reopen the wounds of the Great Financial Crisis (GFC) that the “fat cats” were once again bailed out at the expense of Main Street.
The same toxic politics – but this time on steroids – which helped Trump get elected in 2016.
“This is the second time we’ve bailed their asses out,” grumbled Joe Biden, the Democratic presidential candidate, last month. The battle over who pays for the fiscal burdens of the pandemic is just beginning. On the present trajectory, a backlash against big business is likely…
The most overlooked risk is of a political backlash. The slump will hurt smaller firms and leave the bigger corporate survivors in a stronger position, increasing the concentration of some industries that was already a problem before the pandemic. A crisis demands sacrifice and will leave behind a big bill. The clamour for payback will only grow louder if big business has hogged more than its share of the subsidies on offer. It is easy to imagine windfall taxes on bailed-out industries, or a sharp reversal of the steady drop in the statutory federal corporate-tax rate, which fell to 21% in 2017 after President Donald Trump’s tax reforms, from a long-term average of well over 30%. Some Democrats want to limit mergers and stop firms returning cash to their owners. –The Economist
Moreover, a narrative is beginning to take shape that the Trump administration and his Republicans are more of a Trojan Horse for the 1 percent and Greenwich set. That is, tax cuts for the wealthy and large corporations while cutting social services and healthcare for the middle class and pumping up and bailing out stocks at the expense of Main Street, where the top 10 percent directly hold almost 90 percent of total stock wealth while the bottom 90 percent have only a little over 10 percent.
At the same time, the Trump administration presents itself as sort of a dysfunctional Honey Boo Boo reality show to entertain its base. Though what some may perceive as a nice circus act but not quite exactly the savior of the working and middle class that many voted for.
Finally, today’s cover of The Economist pretty much nails it and also frets how divorced financial markets are from the current and coming economic reality.

TOTD: ‘Toon of the Day
Fairly safe bet this cemetery ain’t in ‘Frisco.

QOTD: Quote of the Day
Intellectual capital will always trump financial capital – Paul Tudor Jones
More than his words, he spoke with his wallet. He usually relishes a down stock market to take advantage of lower prices. Not this time. He hadn’t made any purchases recently; he didn’t buy up stocks when they had fallen last month during what felt like a mini-panic: “We have not done anything, because we don’t see anything that attractive to do.” – Warren Buffet, NY Times
Berkshire Hathaway held its annual “Woodstock for Capitalists” over the weekend. The event was conducted virtually because of the global pandemic where Buffett expressed a deep sense of concern about the immediate future.
Not Buying
Warren ain’t buyin’ nuttin’. In fact, he just dumped all of his airline stocks.
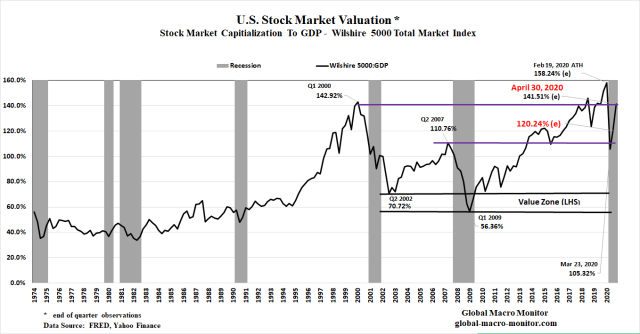
Take a look at the stock market cap-to-GDP ratio, aka the Buffett Indicator, and you will get of sense why Warren is stingy with his cash, which is mounting higher and higher by the day currently at $137 billion.
Stock Market Capitalization-to-GDP
The Buffett indicator closed the first quarter with a stock market capitalization at almost 141 percent of GDP. Incredibly, just 2 points below the peak-end-of-quarter valuation level of the dot.com bubble. Moreover, today’s relative valuation is effectively much higher than than in Q1 2000 as there are fewer public companies now traded on U.S. stock exchanges.
We aren’t touching this market until there is a big enough valuation cushion to make stocks look more attractive. What we are sayin’ is, “No No to MoMo,” even if it takes years for stocks to cheapen up, which just might be the case.
If runaway inflation takes hold and stocks become an inflation hedge, which is not a zero probability as monetization of government spending skyrockets, we will be in good shape with our gold position.
Market Capitalism, No More
After the Fed effectively locked down the bond markets with the bailing out of junk bonds, we are giving our analysis and posting a rest as there really is very little fundamental analysis to be had or done. Stay tuned, however, as we will be posting periodically on issues and topics du jour.
We find it quite bizarre to watch analysts explain the movement in the Treasury market, for example, raising the notion of inflation expectations or investor demand, when the Fed has purchased $1.3 trillion of notes and bonds over the past two months. That is all we need to know.
Market forces are no way in hell driving the bond markets as the Fed is effectively monetizing the ballooning budget deficit and then some and has locked down the bond markets. Why a long-term investor will pay for a bond that almost guarantees a loss, at least in real terms, is beyond us.
Furthermore, the Treasury market anchors all financial assets. Until it doesn’t.
Mass Economic Uncertainty & Hysteresis
At the current moment, there is very little clarity on the economy. Though the 30 million increase in unemployment is horrendous, it does not reflect the true unemployment trend.
We can’t say with any certainty but it is safe to say many filing unemployment claims are furloughed workers who will be rehired once the economy begins to open up. Moreover, no one knows what the economy will look like on the other side and we’re not going to get worked up over the current data until the hurricane passes, or semi-over, and we can assess the structural damage the pandemic has done to country’s long-term economic prospects.
Think in terms of hysteresis, folks.
Hysteresis in the field of economics refers to an event in the economy that persists into the future, even after the factors that led to that event have been removed. – Investopedia
How much hysteresis will there be? Make a guess and our hope is not much.
Mr. Market Not A Good Multitasker
We have written about the nth-order effects of the COVID crisis as the market seems to be only obsessed and focused on the first-order existential crisis of survival and is driven by rumors of vaccines and the new “curve flatteners.” There several order effects, which are just beginning to surface on the market’s radar.
State and local government finances are a big one. The last chart below reflects the devastation the pandemic is having on state budgets.
“Last year I did a May revise with a $21.4 billion budget surplus,” Newsom said Friday during his daily briefing on the state’s response to the outbreak. “This year I will be doing a May revise looking at tens of billions of dollars in deficit. We just went tens of billions in surplus in just weeks to deficits.” – Gov Gavin Newsom, Bloomberg
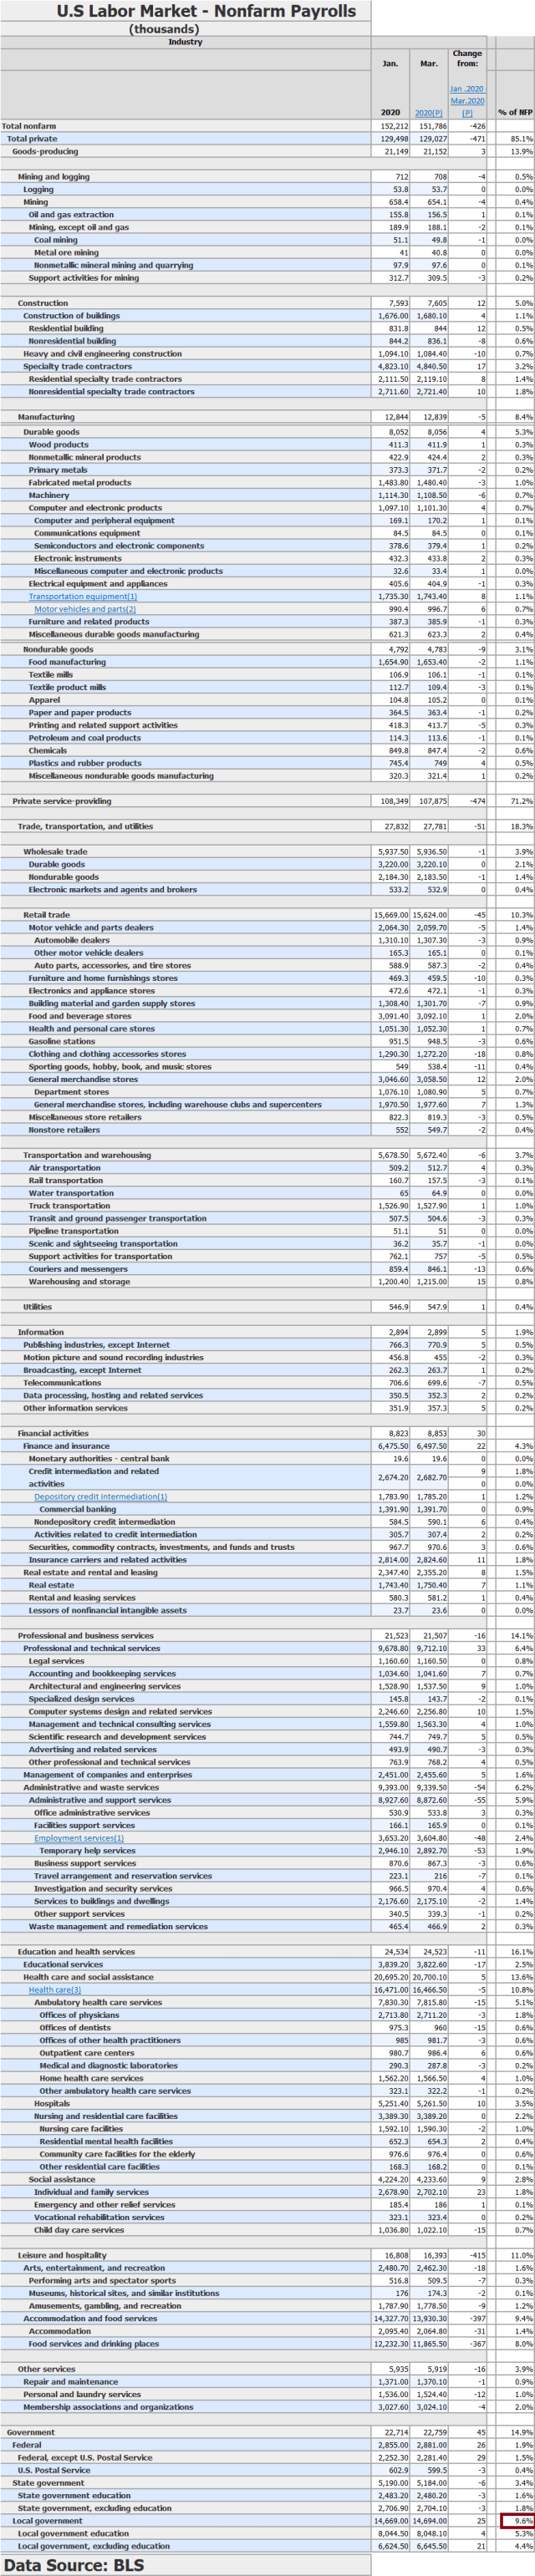
Then there is are local government budgets, which may even be more devastating as local municipalities are one of the largest employers in the country, totaling almost 10 percent of total nonfarm payrolls, a similar level to jobs in the retail sector. Local government is, or one of the largest employers in many counties across the country, including the one that we domicile. We will have to wait to see how this all plays out.
Will the state and local governments get a full-blown bailout or will they begin to furlough and layoff workers as some have already begun?
The 90% Economy

This week’s Economist has a fairly decent piece on the prospects for the global economy.
A second reason is uncertainty. After lockdowns cease, much about the disease will remain unknown, including the chances of a second peak, whether immunity endures and the prospects for a vaccine or a cure. This inhibits those who fear the disease. Even as some states ease social distancing, a third of Americans say they would be uncomfortable visiting a mall. When Germany allowed small shops to open last week customers stayed away. Danes under lockdown cut household spending on services, such as travel and entertainment, by 80%. Danish economists reckon that people in next-door Sweden, which didn’t lock down, cut spending by about as much.
Many businesses will emerge from lockdown short of money, with strained balance-sheets and facing weak demand. In a survey for Goldman Sachs, almost two-thirds of American small-business owners said that their cash would run out in under three months. In Britain the share of commercial tenants who have fallen behind on their rent has risen by 30 percentage points. This week the boss of Boeing warned that air travel would not match the level of 2019 for two or three years. Investment, which accounts for roughly a quarter of gdp, will fall, not just to conserve cash, but also because risk cannot be priced (one reason to think a recent stockmarket rally has weak foundations). – The Economist
Upshot
We are certainly in uncharted territory. The most massive sell-off in such a short time frame followed by one the largest bounces makes life exciting for some of the best traders but offers little guidance to future economic prospects.
These extremes make valuations hard for investors to assess. It is as if someone tuned on a scalding hot shower and then reacted by emptying a bucket of ice over themselves. And there are few historical parallels. The outbreak of the first world war was also a genuine shock, but the authorities quickly closed stock exchanges, so it is not a useful basis for comparison.
…So although the origins of the bear market may be unusual, and the support from central banks and governments have been substantial, the same feedback process seen in other downturns could yet occur. Bad debts may rise, and investors may lose their enthusiasm for risky financial assets for an extended period.
In the wild, bears are likely to run away when they hear a lot of noise. So perhaps the authorities have done enough to scare this one off. But with most countries still in lockdown, we are unlikely to be out of the woods yet. – The Economist
The only thing we see rational about the totality of the past ten weeks of trading is the rebound, which topped out on Thursday and halted right about the 61.8 Fibonacci retracement level. Bravo for the Fibos!
We remain in the bunker until the market cheapens up and moves closer to the value zone, which is a long way down. Patience, young grasshopper.