Russian Rouble Tumbles With Oil Prices

(click here if video is not observable)

Posted in BRICs, Crude Oil, Video | Tagged , , , | Leave a comment

Global Trend Indicators

(click here if tables are not observable)

Posted in Global Trend Indicators | Tagged , , , , , , , , | 2 Comments

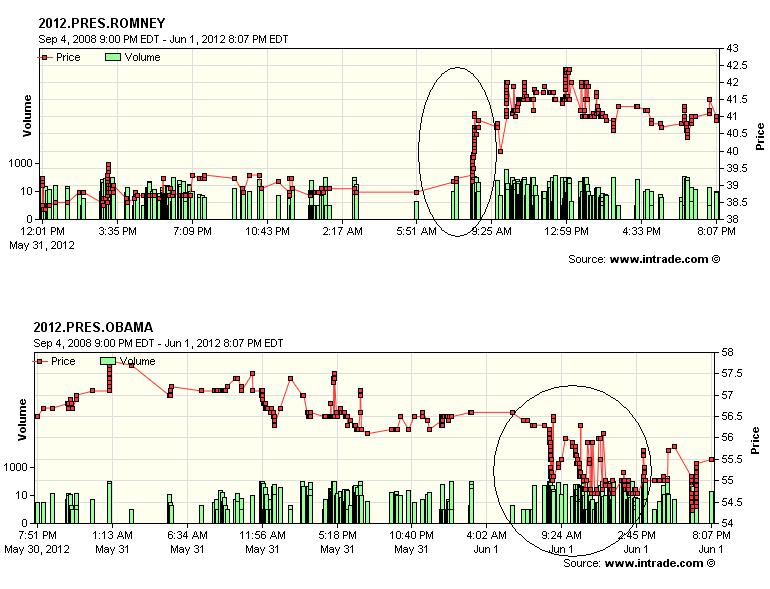
Romney’s Odds Ramp on Deteriorating Employment Data

Check out the trading at Intrade right around the employment data released this morning.  The odds of Romney winning the November election ramped about 3 percentage points right after the jobs number was released.

Rahm Emmanuel in an interview with Bloomberg  couldn’t have framed the current election better,

“I don’t think Mitt Romney is the president’s opponent — the economy is.

Note the charts show the probabilities of winning the Presidency in November.   The trading  may be subject to politically motivated “tape painting” and manipulation.

(click here if charts are not observable)

Posted in Politics | Tagged , , , , , | 1 Comment

Picture of the Day: Raining on the Risk On Parade

This mural in Poland encapsulates the global markets today.  It’s raining pouring on the risk-on trade.

The markets were hit by a hat-trick of three Macro Swans coming home to roost — fears of: 1) China hard landing;  2)  Eurozone bank and debt collapse; and 3)  the U.S. economy rolling over.  The S&P500 closed below its 200-day moving average for the first time this year.

Capitulation is coming.  Stay tuned.

(click here if picture is not observable)

Posted in Black Swan Watch, Picture of the Day | Tagged , , , , | 2 Comments

Spanish Capital Flight

We’ve posted about this.  The FT has a piece on it.

The big question is how and when will it be reversed?

(click here if video is not observable)
Posted in Black Swan Watch, Euro | Leave a comment

Weekly Eurozone Watch

Key Data Points
German 10-year bund yield down 20 bps to record low of 1.1720 percent;
Italy 27 bps wider;
Spain 42 bps wider;
Ireland 26 bps wider;
Greece 52 bps wider;
Large Eurozone banks down 1-1o percent on the week;
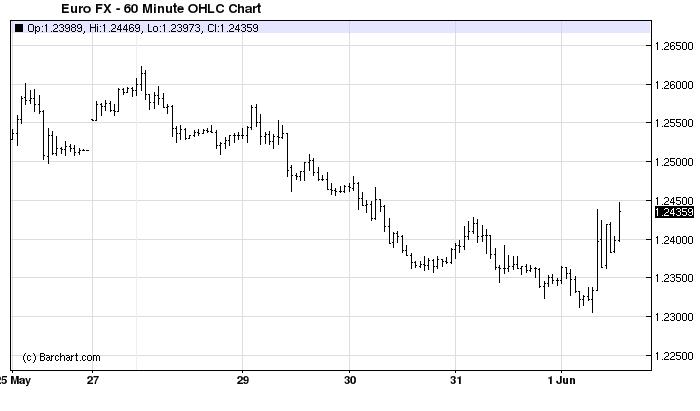
Euro currency down 0.61 percent;

(click here if charts are not observable)

Posted in Weekly Eurozone Watch | Tagged , , , | 1 Comment

U.S. Employment Situation – May 2012

Just as last month, the weak jobs report really crushed equities today.

Note the destruction of construction jobs.  This is the one sector most sensitive to interest rates and should be leading the way in job creation with zero interest rate (ZIRP) monetary policy and sub 4 percent mortgages.   More later, but we believe (to be confirmed in later post)  there has been net zero construction jobs created since the jobs recovery started in March 2010 after losing over 2 million during the great recession.

Here’s the BLS take,

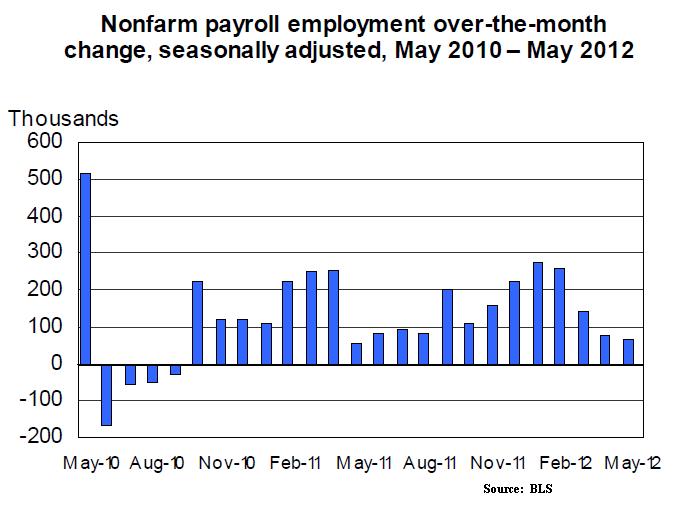
Nonfarm payroll employment changed little in May (+69,000), and the unemployment rate was essentially unchanged at 8.2 percent, the U.S. Bureau of Labor Statistics reported today. Employment increased in health care, transportation and warehousing, and wholesale trade but declined in construction. Employment was little changed in most other major industries.

Both the number of unemployed persons (12.7 million) and the unemployment rate (8.2 percent)
changed little in May.

(click here if charts are not observable)

Posted in Employment, US Releases | Tagged , , | 3 Comments

HSBC Korea Manufacturing PMI Falls to 51

Markit reports,

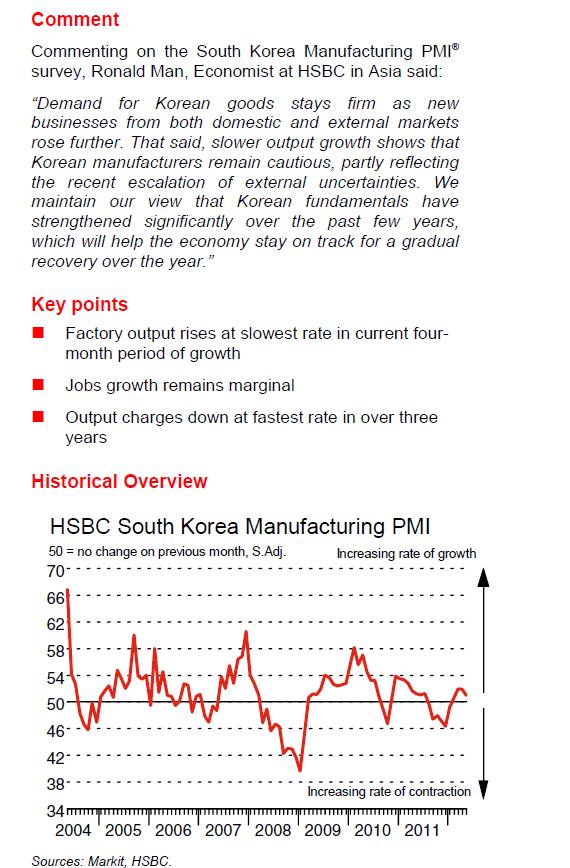
Growth of South Korean manufacturing output lost momentum in May, slipping to the weakest in the current four-month period of expansion. New order growth held up relatively well in comparison, with the latest increase only slightly weaker than in April. Meanwhile, goods producers added to their staff numbers on average, although the rate of job creation remained marginal. On the price front, output charges decreased to the greatest extent in more than three years, while input cost inflation eased to a marginal rate.

After adjusting for seasonal factors, the HSBC Purchasing Managers’ Index™ (PMI™) – a composite indicator designed to give a single-figure snapshot of operating conditions in the manufacturing economy – posted 51.0 in May, signalling a fourth successive month of improving operating conditions. However, the index lost ground for the second successive month, and was below the long-run average for the series of 51.3.

(click here if chart is not observable)

Posted in Economics, PMIs | Tagged , , , | Leave a comment

Facebook’s About Face

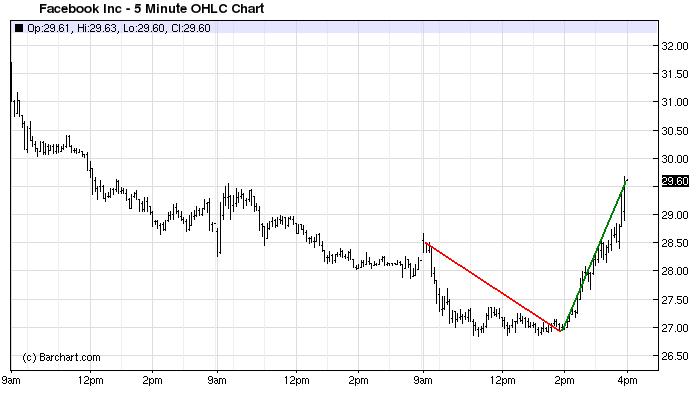
Check out the reversal in Facebook right at 2 PM and $27.00.    In the words of Paul “Yosemite Bear” Vasquez,  “what does this mean”?

We don’t know but someone (Morgan Stanley?) had an axe to buy and spooked the shorts.

P.S.  Tough markets.

Economic data moving in the wrong direction.   Market drifting lower, no liquidity, and stocks are being tossed to and fro by headlines and tape bombs.

Some think today was the capitulation sell-off.  If only they hadn’t sold the close.

The chop may last though the summer.  Think we’re going fishing.

(click here if chart is not observable)

Posted in Equities, Technical Analysis | Tagged , , | Leave a comment

Draghi: ‘EU must clarify euro vision’

(click here if video is not observable)

Posted in Black Swan Watch, Euro, PIIGS, Sovereign Debt, Sovereign Risk, Video | Tagged , | Leave a comment