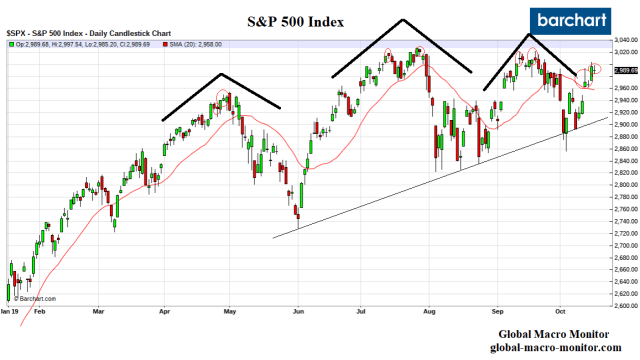
In our Saturday post, Heads Up! Friday’s Rare S&P Shooting Star Candlestick, we pointed out the S&P500 had formed a rate shooting star Doji candlestick on Friday with price action that had been observed only once since 2010, last Halloween day.
Run don’t walk to view the post, here.
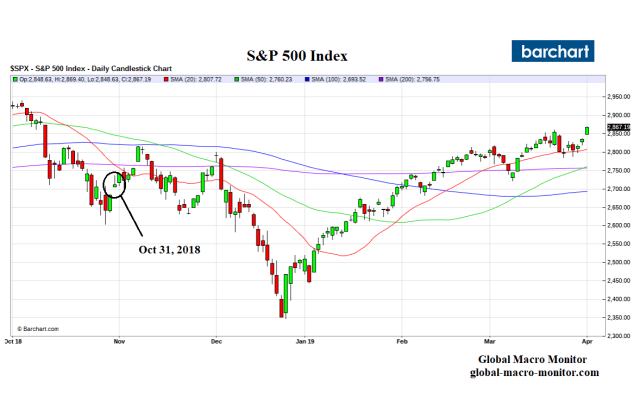
Halloween 2018
Take a look at last Halloween’s S&P shooting star. The index consolidated the next few days then gapped up with a nice long green candle, which probably sucked in many traders into long positions. The next day the S&P formed a long-legged Doji before rolling over to eventually crash to the December 2018 low, forcing the market socialists to call, no scream for a Fed rescue.
Upshot
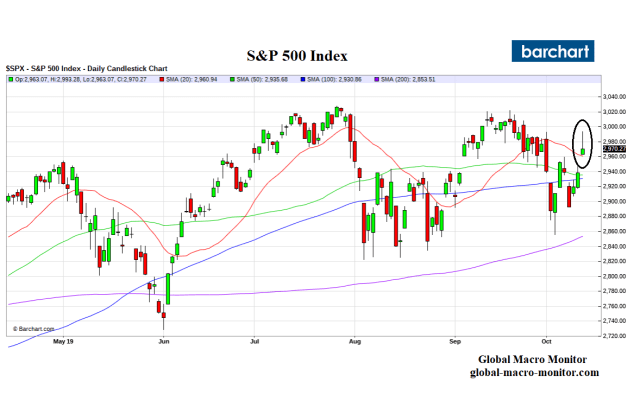
The key now is to watch the price action next week.
A break on Monday of 2960 (see below for key support levels) or the formation of more Doji candlesticks will further reduce the market fog and indicate the market is probably headed for some trouble. — GMM, Oct 12th
Since Saturday’s post, the S&P500 has formed two daily Doji candlesticks during the past three trading days, including today. These are signs of indecision by traders.
Our sense is that many traders are expecting a breakout to new highs and were probably sucked into long positions with Tuesday’s big move.
Doji City And Price Reversals
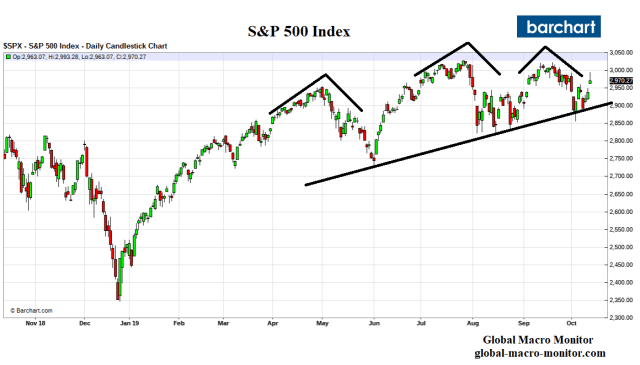
Our observation of the price action over the past few years is that when Dojis begin to become ubitiquous it’s a warning, signal, and confirmation of a potential major price reversal. It’s not a guarantee but after Friday’s shooting star candle followed by the price action similar to last Halloween, coupled with the head & shoulders formation, we are on full alert.
Key Levels
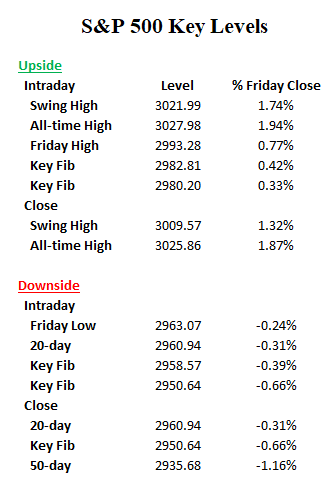
To the upside is Tuesday’s intraday high of 3003.28 and 3021.99, which would negate the head & shoulders pattern. A close above 2995.68 (Tuesday’s close) and then 3007.39 would be positive.
To the downside, is the 20-day moving average at 2958, which coincides with some key Fibo levels, is a must hold. A break there would trigger a definite sell and, of course with a stop-loss.

Upshot
Short-term trading is very difficult and, in our opinion, has turned into a mug’s game since the rise of the trading ‘bots and algos. We have learned the hard way with some very expensive lessons. Thus, we don’t pay much attention to the daily noise anymore unless we believe a big move may be setting up.
Market Manipulation.
Moreover, the powers that be have tried their very best to keep the market moving higher. Beat the Tweets? Come on, man!
Unless, of course, you know they’re coming.
Read the following, then feel free to throw up. Make sure to click on the link and read the entire piece.

In the last 10 minutes of trading at the Chicago Mercantile Exchange on Friday, September 13, someone got very lucky. That’s when he or she, or a group of people, sold short 120,000 “S&P e-minis”—electronically traded futures contracts linked to the Standard & Poor’s 500 stock index—when the index was trading around 3010. The time was 3:50 p.m. in New York; it was nearing midnight in Tehran. A few hours later, drones attacked a large swath of Saudi Arabia’s oil infrastructure, choking off production in the country and sending oil prices soaring. By the time the CME next opened, for pretrading on Sunday night, the S&P index had fallen 30 points, giving that very fortunate trader, or traders, a quick $180 million profit.
It was not an isolated occurrence. Three days earlier, in the last 10 minutes of trading, someone bought 82,000 S&P e-minis when the index was trading at 2969. That was nearly 4 a.m. on September 11 in Beijing, where a few hours later, the Chinese government announced that it would lift tariffs on a range of American-made products. As has been the typical reaction in the U.S. stock markets as the trade war with China chugs on without any perceptible logic, when the news about a potential resolution of it seems positive, stock markets go up, and when the news about the trade war appears negative, they go down.
The news was viewed positively. The S&P index moved swiftly on September 11 to 2996, up nearly 30 points. That same day, President Donald Trump said he would postpone tariffs on some Chinese goods, and the S&P index moved to 3016, or up 47 points since the fortunate person bought the 82,000 e-minis just before the market closed on September 10. Since a one-point movement, up or down, in an e-mini contract is worth $50, a 47-point movement up in a day was worth $2,350 per contract. If you were the lucky one who bought the 82,000 e-mini contracts, well, then you were sitting on a one-day profit of roughly $190 million.
…But these wins were peanuts compared to the money made by a trader, or group of traders, who bought 420,000 September e-minis in the last 30 minutes of trading on June 28. That was some 40% of the day’s trading volume in September e-minis—making it a trade that could not easily be ignored. By then, President Trump was already in Osaka, Japan—14 hours ahead of Chicago—and on his way to a roughly hour-long meeting with China’s President Xi Jinping as part of the G20 summit. On Saturday in Osaka, after the market had closed in Chicago, Trump emerged from his meeting with Xi and announced that the intermittent trade talks were “back on track.” The following week was a good one in the stock market, thanks to the Trump announcement. On Thursday, June 27, the S&P 500 index stood at about 2915; a week or so later, it was just below 3000, a gain of 84 points, or $4,200 per e-mini contract. Whoever bought the 420,000 e-minis on June 28 had made a handsome profit of nearly $1.8 billion.
Traders in the Chicago pits have been watching these kinds of wagers with an increasing mixture of shock and awe since the start of the Trump presidency. They are used to rapid fluctuations in the S&P 500 index; volatility is common, of course. But the precision and timing of these trades, and the vast amount of money being made as a result of them, make the traders wonder if all this is on the level. Are the people behind these trades incredibly lucky, or do they have access to information that other people don’t have about, say, Trump’s or Beijing’s latest thinking on the trade war or any other of a number of ways that Trump is able to move the markets through his tweeting or slips of the tongue? Essentially, do they have inside information?
..given how fishy and coincidental the trading in e-minis seems to be these days, the SEC or CFTC would be doing a great service (and their job) for the American people by investigating who is behind these lucrative trades, and what they knew before they placed them. At the moment, what we’re getting from them is an indifferent shrug.
Federal regulators might start here: In the last 10 minutes of trading on Friday, August 23, as the markets were roiling in the face of more bad trade news, someone bought 386,000 September e-minis. Three days later, Trump lied about getting a call from China to restart the trade talks, and the S&P 500 index shot up nearly 80 points. The potential profit on the trade was more than $1.5 billion. — Vanity Fair, Oct 16th
If the above has any semblance of truth, that kind of swampiness makes the Pantanal in Brazil look like the marsh at our local park. The fact we have to even think about this kind of bullshit makes us wanna hurl.
As always, we reserve the right to be wrong.
We are almost out of free lunches, folks, and will be posting only sporadically unless your support increases. Donate whatever you think is fair by clicking on the PayPal button just below the Twitter and search icons on the upper right-hand side of the blog. You do not need a PayPal account and can use almost any credit card.
Don’t be a free rider. Thanks, so much.

October Datafest
October is always a month of feasting for us macro data junkies as the IMF releases several of their annual reports and databases, such as the World Economic Outlook (WEO) and the Global Financial Stability Report (GFSR). We have a preference for the IMF economists as they don’t have a pom-pom/cheerleading bias in their analysis with a BTFD or “the market is cheap” tint to their narratives as do many sell-side and buy-side analysts, who almost always seem to be talking their books. Not all, but several.
“It is difficult to get a man to understand something, when his salary depends on his not understanding it.” — ― I, Candidate for Governor: And How I Got Licked
We know first hand as we’ve worked on all sides. At several Wall Street investment banks, hedge funds, and began our career at one the Bretton Woods institutions.
Academic Versus Market
The IMF and World Bank analysts have an academic bent, however, which also needs to be discounted. After working on Wall Street for a few years, I went back to Washington to speak with one of my professor friends about finding an arbitrage opportunity in a Korean mutual fund. He responded, “That is not supposed to happen, markets are too efficient” Yeah, right, I thought. Go talk with the Efficient Market Hypothesis (EMH) geniuses who blew up Long Term Capital Management (LTCM).
The moral of the story is, in general, don’t look to academics to help you understand real-world market dynamics to make money trading. They are very useful on the theory, however. But you can’t bend theory to fit market price action. Or, can you?
Finally, nobody knows the future so we are the first to admit and warn to heavily discount our opinions and market views. Take them into account with other counter-narratives and you use them to stress test your own views and portfolios.
Overvalued Markets
Here is the nice chart and a short excerpt from the recently released Global Financial Stability Report,
Other risk assets are also showing signs of stretched valuations. Equity markets appear to be overvalued in Japan and the United States (Figure 1.2, panel 3, shows misalignments scaled by monthly price volatility). Since April, US equity prices have increased whereas fundamentals-based valuations have declined as higher uncertainty about future earnings outweighed the boost from an expected rebound in earnings and lower interest rates. Equity valuations in major emerging markets, however, are closer to fair value, as investors’ risk appetite may have been tempered by concerns about trade tensions and the economic growth outlook (see Chapter 4)
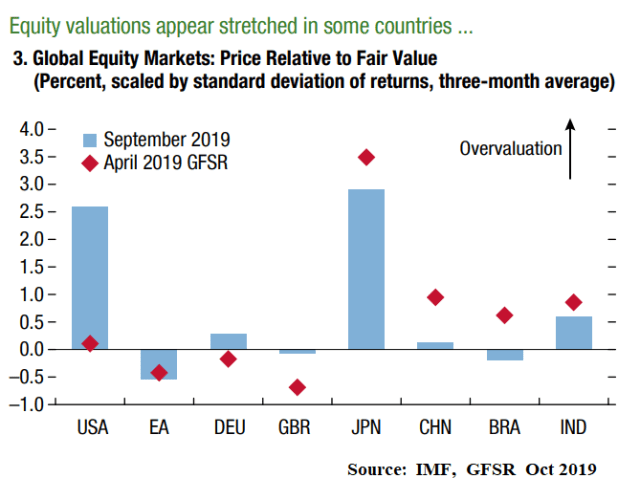
The equity valuation models presented in this report are based on the dividend discount model(DDM), which explains equity prices as a function of expected corporate earnings, the compensation required to take on equity risk (the equity risk premium), and interest rates. – IMF, Anex 1.1. Technical Note
We’re not looking for confirmation bias but the above does confirm our bias that U.S. stocks don’t have much room to run to the upside. See our recent post, How Far Can The Stock Market Run?
Just because we and the IMF think the U.S. stock market is overvalued — using totally different metrics, by the way — it doesn’t rule out that stocks can’t break to new highs. Markets always do what they are going to do regardless of whatever the consensus or contrarians believe.
To buy higher, however, would be tantamount to picking up nickels in front of a steam roller and dangerous to your financial health, in our opinion.
Whither Japan
It is also stunning to see that Japan’s stock market is so overvalued.
The NIKKEI stock index is still 42 percent below its high 30-years after the December 29, 1989 peak of 38,957, even after 20 years of zero and negative interest rates (ZIRP & NIRP) and a massive quantitative easing (QE) program, which includes the central bank’s outright purchases of stocks (BoJ is on pace to become the largest shareholder of stocks) and the ballooning of the Bank of Japan’s balance sheet to where its size now exceeds the country’a GDP. Isn’t it obvious, QE forever is not going to save U.S. stocks in the long-run?
Imagine the politics and turmoil in the U.S. if the S&P500 is trading at the NIKKEI equivalent of 1745 in 2049? How would pensioners be living then? We can get a glimpse of how some of the Japanese elderly are surviving during their stock market’s long secular bear market and zero income on savings.
At a halfway house in Hiroshima – for criminals who are being released from jail back into the community – 69-year-old Toshio Takata tells me he broke the law because he was poor. He wanted somewhere to live free of charge, even if it was behind bars.
“I reached pension age and then I ran out of money. So it occurred to me – perhaps I could live for free if I lived in jail,” he says.
“So I took a bicycle and rode it to the police station and told the guy there: ‘Look, I took this.'”
…Toshio represents a striking trend in Japanese crime. In a remarkably law-abiding society, a rapidly growing proportion of crimes is carried about by over-65s. In 1997 this age group accounted for about one in 20 convictions but 20 years later the figure had grown to more than one in five – a rate that far outstrips the growth of the over-65s as a proportion of the population (though they now make up more than a quarter of the total). — BBC
That is fracking sad and one helluva social security program. You go, central bankers.
Though we are not expecting the U.S. markets and economy to follow the same path as Japan but the above does illustrate how difficult it is to predict the future. Ex-ante we tend to believe history progresses in a linear fashion. Ex-post we see it takes a non-linear path.
The Pacific Century
At peak Japan in 1989, for example, the shelves of bookstores were stocked with titles and themes similar to something to the effect, “The 21st Century Will Be The Pacific Century.” Open any one of them back then, read the cover and every author was certainly not focused on a Pacific dominated by China but one controlled by Japan.
Docile Population
Moreover, do you really think the U.S. population would be as docile as the Japanese if the S&P500 is trading at 1745 in 2049? We don’t.
Upshot
Question everything, including our analysis, take nothing for granted, don’t be complacent and stay alert, folks.
We are almost out of free lunches, folks, and will be posting only sporadically unless your support increases. Donate whatever you think is fair by clicking on the PayPal button just below the Twitter and search icons on the upper right-hand side of the blog. You do not need a PayPal account and can use almost any credit card.
Don’t be a free rider. Thanks, so much.
A very smart friend of mine thinks WeWork could be the Lehman-like trigger that causes risk premiums, including equity, to blow out. Jamie to the rescue with a $5 billion line of credit?
And to think investors almost got stuffed with what was originally valued close to a $50 billion IPO of this toxic waste just a few months ago. Where is the SEC?
We are far from experts on WeWork. To get the good oil on this fiasco go to NYU prof, Scott Galloway’s blog.
Commercial Real Estate Fallout
WeWork will almost certainly, if it hasn’t already, put, the big hurt on commercial real estate, particularly in New York City and San Francisco,
WeWork has become the biggest tenant in the booming “flexible office” space sector where it holds leases on about 11 million square-feet of the total 70 million square-feet dedicated to the new breed of real estate nationally, according to real-estate brokerage firm CBRE.
The potential spillover, should WeWork start giving back its space, could “negatively affect the valuations of surrounding office properties in those cities – even if they don’t have direct exposure to WeWork,” Bank of America Merrill Lynch analysts wrote in a weekly client note. – MarketWatch

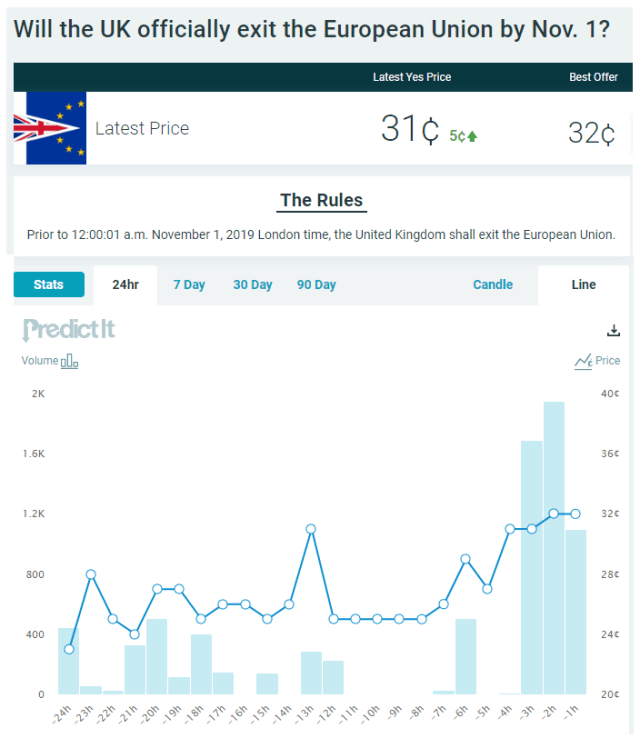
The PredictIt market on a Brexit by November 1st is up over 50 percent in the past 24 hours.
The Rules
Prior to 12:00:01 a.m. November 1, 2019 London time, the United Kingdom shall exit the European Union. – PredictIt
Driven by a tape with the following headlines, this one from the WSJ.
Still, the market is only pricing around a 30 percent probability of an October 31 Brexit, which may be due to the potential for a temporary extension of the deadline to conclude negotiations. We don’t know.
Nevertheless, if you’re confident BoJo can come to an agreement with the EU and Parliament will pass it, place your bets at PredictIt.
As of the recent price of 31 cents, the two-week return is 225.8 percent if Brexit gets done. It’s a binary trade if you hold it to maturity (Oct 31) and the loss is 100% if Brexit fails.
We like the fact you can trade in an out of these contracts as the probability of an agreement increases or decreases though they are not that liquid.
If you’re looking to do sizeola, as in >$50k, forget about it. These are lunch money bets, folks.
If you’re speculating in other markets based on a Brexit event, keep an eye on this one. Cable is also up almost 2 percent on the day.
To be honest, we never thought Brexit would happen and the UK would hold a second referendum where British voters choose to remain in the EU. We are not wrong yet as the market odds are still over 3:1 that Brexit gets done on schedule.
Stay tuned.
Updated: October 15
Very little to the upside. Very much to the downside.
Macro Valuation Metrics
Lots of incoming over our S&P Shooting Star post, most of which can mostly be summed up to the effect, “Why so bearish?”
Seriously? Our predisposition to the market is always anchored in time tested valuation metrics, which are hard to manipulate. That is why we like market capitalization deflated by some macro variables, such as nominal GDP or wages.
Micro measures, such as Price-to-Earnings are way too distorted by buybacks and can be easily manipulated by CFOs, who play around with variables such as depreciation or loss reserves.
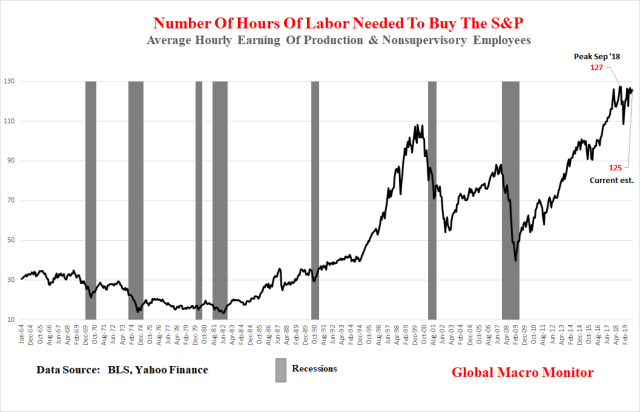
Our two favorite are 1) market cap-to-GDP, which, according to Warren Buffet is, “the best single measure of where valuations stand at any given moment.” Take a look at the following chart and you will understand why the Oracle of Omaha is sitting on a record $122 billion stockpile of cash, 2) the number of hours of work needed to buy the S&P500, not a perfect valuation measure but does track our other favorite quite well. The average person, making the average salary is not a big holder of stocks but the metric does give a heads up when the stock market becomes divorced from the underlying economic trend.
Take a look at the data and you decide, folks. Keep in mind, the charts are ratios, not price indices, and can’t continue to rise from lower left to upper right, forever.
Turn off the talking heads on bubble vision and #FinTwit, who will find it difficult to interpret the following charts because their salaries and year-end bonuses depend on their not understanding them or are incentivized to dismiss them outright.
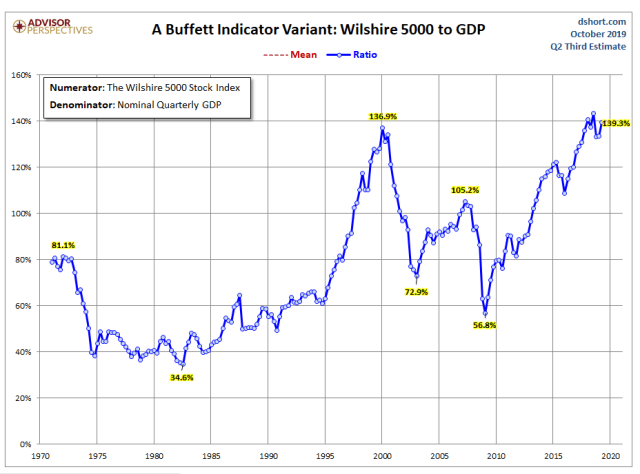 Source: Advisor Perspectives
Can markets, once again, convince themselves that historic valuations no longer matter? That this time is different?
Possibly, but they will need a prevailing narrative to fuel the delusion.
Quantitative Easing Forever
It could come in the form QE Forever, which we don’t think is very probable. That jig is almost up and any further rise in inflation will put a stake through its heart. The Cleveland Fed’s median CPI just pierced 3 percent for the first time since the Great Financial Crisis (GFC).
H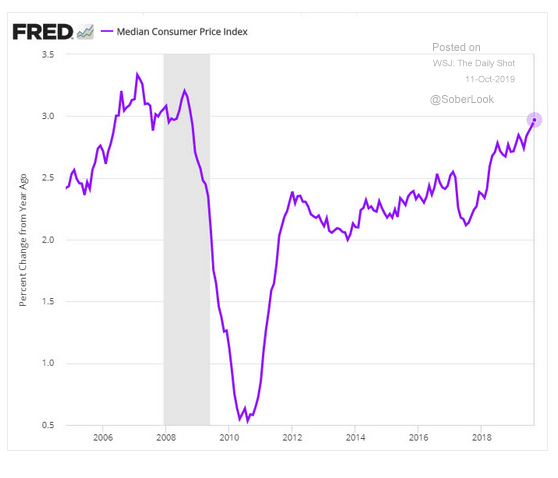
Source: The Daily Shot
AI
Artificial Intelligence? This is the one to watch, which will be a major disruptive force for decades to come.
The theme goes something like this: Companies can lay off all their workers and replace them with machines and algorithms, which will inflate margins to infinity and beyond.
The problem with this scenario is it would crush aggregate demand and economic growth. The geniuses are trying to find a balance and, thus far, have come up with concepts such as Universal Basic Income (UBI) and Modern Monetary Theory (MMT).
Stay tuned.
Wake us up after the above charts regress to their means, about 40 percent lower.
We are almost out of free lunches, folks, and will be posting only sporadically unless your support increases. Donate whatever you think is fair by clicking on the PayPal button just below the Twitter and search icons on the upper right-hand side of the blog. You do not need a PayPal account and can use almost any credit card.
Don’t be a free rider. Thanks, so much.
After negotiations in Brussels failed to produce a breakthrough, the odds at PredictIt of an official Brexit by November 1 tanked into the teens on big volume. The market was only pricing around a 30 percent probability of a deal by October 31, however.
Here’s some commentary by the FT,
Boris Johnson’s hopes of sealing a Brexit deal in time for a critical EU summit later this week were in jeopardy on Sunday evening after two days of intensive negotiations left Brussels baffled about the UK’s new customs proposals.
Michel Barnier, EU chief Brexit negotiator, told diplomats on Sunday evening that British plans to keep Northern Ireland in the UK’s customs territory while avoiding a hard border on the island of Ireland were fiendishly complex and not yet properly worked out.
There was “no breakthrough yet”, said one EU diplomat, while noting it was positive that talks would continue in Brussels on Monday. “If the British government wants a solution, it must move quickly now. The clock is ticking.” – FT
Global markets were all lathered up on Friday over the U.S.-China non-deal and the potential for a Brexit deal. Monday’s trading will be interesting, to say the least.

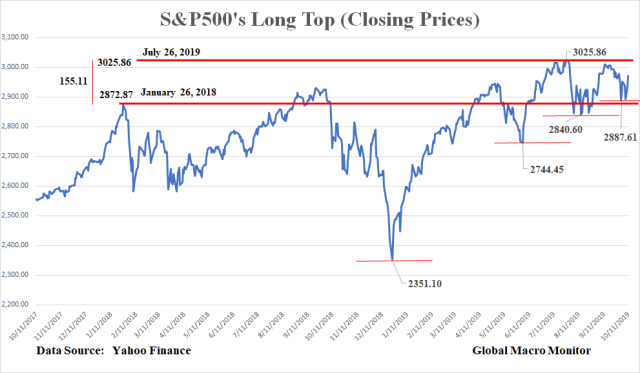
We’ve been ignoring the daily noise of the stock market given the futility of trying trade against the blatant market manipulation but especially, after the S&P met our target of 3025, which we posted on April 1st,
If you have been reading GMM, you know our thoughts on equities. The sheer momentum of such a strong first-quarter carries over into the rest of the year, which is the justification of our year-end S&P target of 3025. – GMM, April 1st
Check. The S&P peaked on July 26, closing at 3025.86.
Unlike most, however, we didn’t lift our target and began selling as we try not to let price action determine our fundamental view.
We have entered the selling zone — S&P 3025-3100 — to execute the Get Shorty trade. This also provides an excellent opportunity for long-term investors to start cutting back on risk if they have not already been doing so.
You know our view. Rarely should LT investors reduce risk in a significant manner, maybe just three to four times during their working lives, but this is one of those times, we believe. – GMM, July 26th
Friday’s Rare “Halloween” S&P500 Candlestick
We do sit up and listen, however, with the type of rare price action exhibited in the S&P500 on Friday.
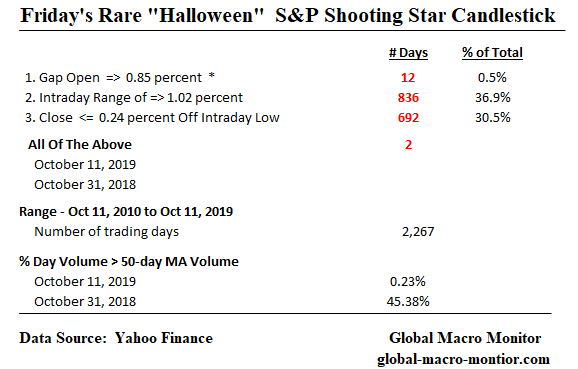
The rare shooting star candlestick formation has only exhibited all three of the following price action characteristics (greater/less than or equivalent % changes) once since October 2010. On Halloween 2018. Spooky.
What is rare, however, is when all three of the above occur on the same trading day. Again, only twice since October 2010, on Friday and last Halloween.
Many other market indices experienced similar shooting star candlesticks on Friday. Go to the Slope of Hope website for an excellent review.

What Does A Shooting Star Candle Signal?
Investopedia does a good job of ‘splaining.
A shooting star is a bearish candlestick with a long upper shadow, little or no lower shadow, and a small real body near the low of the day. It appears after an uptrend. Said differently, a shooting star is a type of candlestick that forms when a security opens, advances significantly, but then closes the day near the open again.
For a candlestick to be considered a shooting star, the formation must appear during a price advance. Also, the distance between the highest price of the day and the opening price must be more than twice as large as the shooting star’s body. There should be little to no shadow below the real body. – Investopedia
The shooting star candle is not a perfect forecaster, nor is its signal of a pending price reversal always timely. It is a warning flag, however, and traders should take heed when they witness one.
Halloween 2018
Take a look at last Halloween’s S&P shooting star. The index consolidated the next few days then gapped up with a nice long green candle, which probably sucked in many traders into long positions. The next day the S&P formed a long-legged Doji before rolling over to eventually crash to the December 2018 low, forcing the market socialists to call, no scream for a Fed rescue.
Upshot
The key now is to watch the price action next week.
A break on Monday of 2960 (see below for key support levels) or the formation of more Doji candlesticks will further reduce the market fog and indicate the market is probably headed for some trouble.
TINA is not an attractive investment proposition for us and a dangerous gambit given the ubiquitous geopolitical and domestic political risk. Moreover, Friday’s price action was a giant meh to the hyped China trade deal, which was no deal at all and still leaves all the uncertainty in place for the business community.
Furthermore, if you think the market was pricing the new October 15 tariffs to take effect, which were taken off the table, I’ve got a new conspiracy to sell you.
S&P Key Levels
We do have conviction the top, or near-top is in for the S&P.
In fact, we believe the bear market began in January 2018 and the S&P in the midst of forming a very long top. Stock buybacks have restricted supply and there doesn’t seem to be as much leverage in the financial markets — x/ weaker credit corporates — as the liquidity created by endogenous money (deposits through credit expansion) that can vanish and contract during market panics has been, in large part replaced by QE.
We, therefore, suspect this bear market will be long and drawn death by a thousand cuts as it grinds and zig zags lower.
As always, we reserve the right to be wrong.
Stay tuned.

We are almost out of free lunches, folks, and will be posting only sporadically unless your support increases. Donate whatever you think is fair by clicking on the PayPal button just below the Twitter and search icons on the upper right-hand side of the blog. You do not need a PayPal account and can use almost any credit card.
Don’t be a free rider. Thanks, so much.
Chalk up another meaningless, photo-op trade agreement with the recent U.S.-Japan Trade Agreement. The country and, especially, American farmers would have been much better off staying in the Trans Pacific Partnership (TPP).
The Japan deal is just another Potemkin trade agreement that will not move the needle one centimeter in bringing jobs back to the United States as was promised.

The dominant loop in the algo to predict President Trump’s behavior with respect to just about everything is to reject all things Obama even if it damages the country. It’s really not rocket science, folks.
Here’s Forbes on the Japan trade deal,
If you’re looking for evidence that a U.S.-China trade agreement is a pointless exercise in economic futility, consider Donald Trump’s non-deal with Japan.
…Late last month, he [Abe] gave Trump a “deal.” That, Trump figured, would enable him to claim a much-needed win on the global stage and get his impeachment troubles out of the headlines. Knowing this, Abe’s team skillfully watered down the deal—essentially to TPP levels. All it means is that U.S. farmers missed out on nearly three years of increased access to Japan, Australia, Singapore, Malaysia, Chile and elsewhere.
Yes, the man famed for the ghostwritten bestseller Art of the Deal got played by Japan’s negotiators. And soon, Xi Jinping’s trade team will be able to make the same boast. Any U.S.-China deal will be a cosmetic affair that gives Trump a “win” and President Xi clearance to make China’s rise great again.
Trump is desperate for a face-saving way to end the trade war. Fallout on U.S. farmers and consumers paying higher import prices is imperiling Trump’s reelection odds for 2020. Yet backing down to Beijing would create its own problems with Trump’s base. Xi’s men are well aware of this, just like Abe’s. – Forbes, Oct 8th
We have been very critical of the Administration’s trade policy simply because there is none.

It is starting to get real, folks. The U.S. is in the midst of a major and potentially very destabilizing Constitutional Crisis.
Don’t listen to the talking heads flapping their jaws. Everything is not awesome. Any strength or rallies are a gift to reduce risk and/or get shorty. Buckle the f$&k up!